Stats 2.1: Frequency Distributions & Their Graphs
 Call Kai
 Learn
Learn Practice Test
 Spaced Repetition
 Match
Match Flashcards
 Knowt Play
1/16

There's no tags or description
Looks like no tags are added yet.
Name | Mastery | Learn | Test | Matching | Spaced | Call with Kai | Chat |
|---|
No analytics yet
Send a link to your students to track their progress
17 Terms
Characteristics of Data Set
center
variability
shape
Frequency Distribution
frequency distribution
table that shows classes (or intervals) of data entries w/ a count of the number of entries in each class
Frequency Distribution
frequency
number of data entries in a class
Frequency Distribution
lower class limit
lowest data value that can fit in a class
Ex: class = 1-5 → LCL = 1
Frequency Distribution
upper class limit
highest data value that can fit in a class
Ex: class = 1-5 → UCL = 5
Frequency Distribution
tolerance
[LCL of next class] - [UCL of previous class]
aka difference between the [lowest of higher class] & [highest of lower class]
Ex: tolerance between class [1-5] & [6-10] = 6 - 5 = 1
Frequency Distribution
class width
distance between lower (or upper) limits of consecutive classes
aka difference between the 2 lowest/highest values of each adjacent class
Ex: class width between class [1-5] & [6-10] = 6 - 1 = 5
Frequency Distribution
range
difference between the maximum & minimum data entries
Ex: range between lowest class [1-6] & highest class [26-30] = 30 - 1 = 29
Frequency Distribution
Guidlines for Constructing Frequency Distribution
pre. find RANGE
decide on # of CLASSES (# class = range / class width)
find CLASS WIDTH (class width = range / # classes & round UP)
find class LIMITS (can NOT overlap)
make tally mark for each data entry
count tally marks to find total FREQUENCY
Frequency Distribution
class boundaries
numbers that seperate classes w/o forming gaps between them
UCBoundaries = UCL + Tolerance/2
LCBoundaries = LCL - Tolerance/2
*UCB of lower class = LCB of higher class

Frequency Distribution
midpoint
[sum of LCL & UCL ] divided by 2
Frequency Distribution
relative frequency
portion or % of the data that falls into that class
frequency of 1 class / cumulative frequency
unit: % or decimal (more preferred)
Frequency Distribution
cumulative frequency
sum of frequencies of that class & ALL previous classes
∑f of LAST class = sample size (n)
Graph
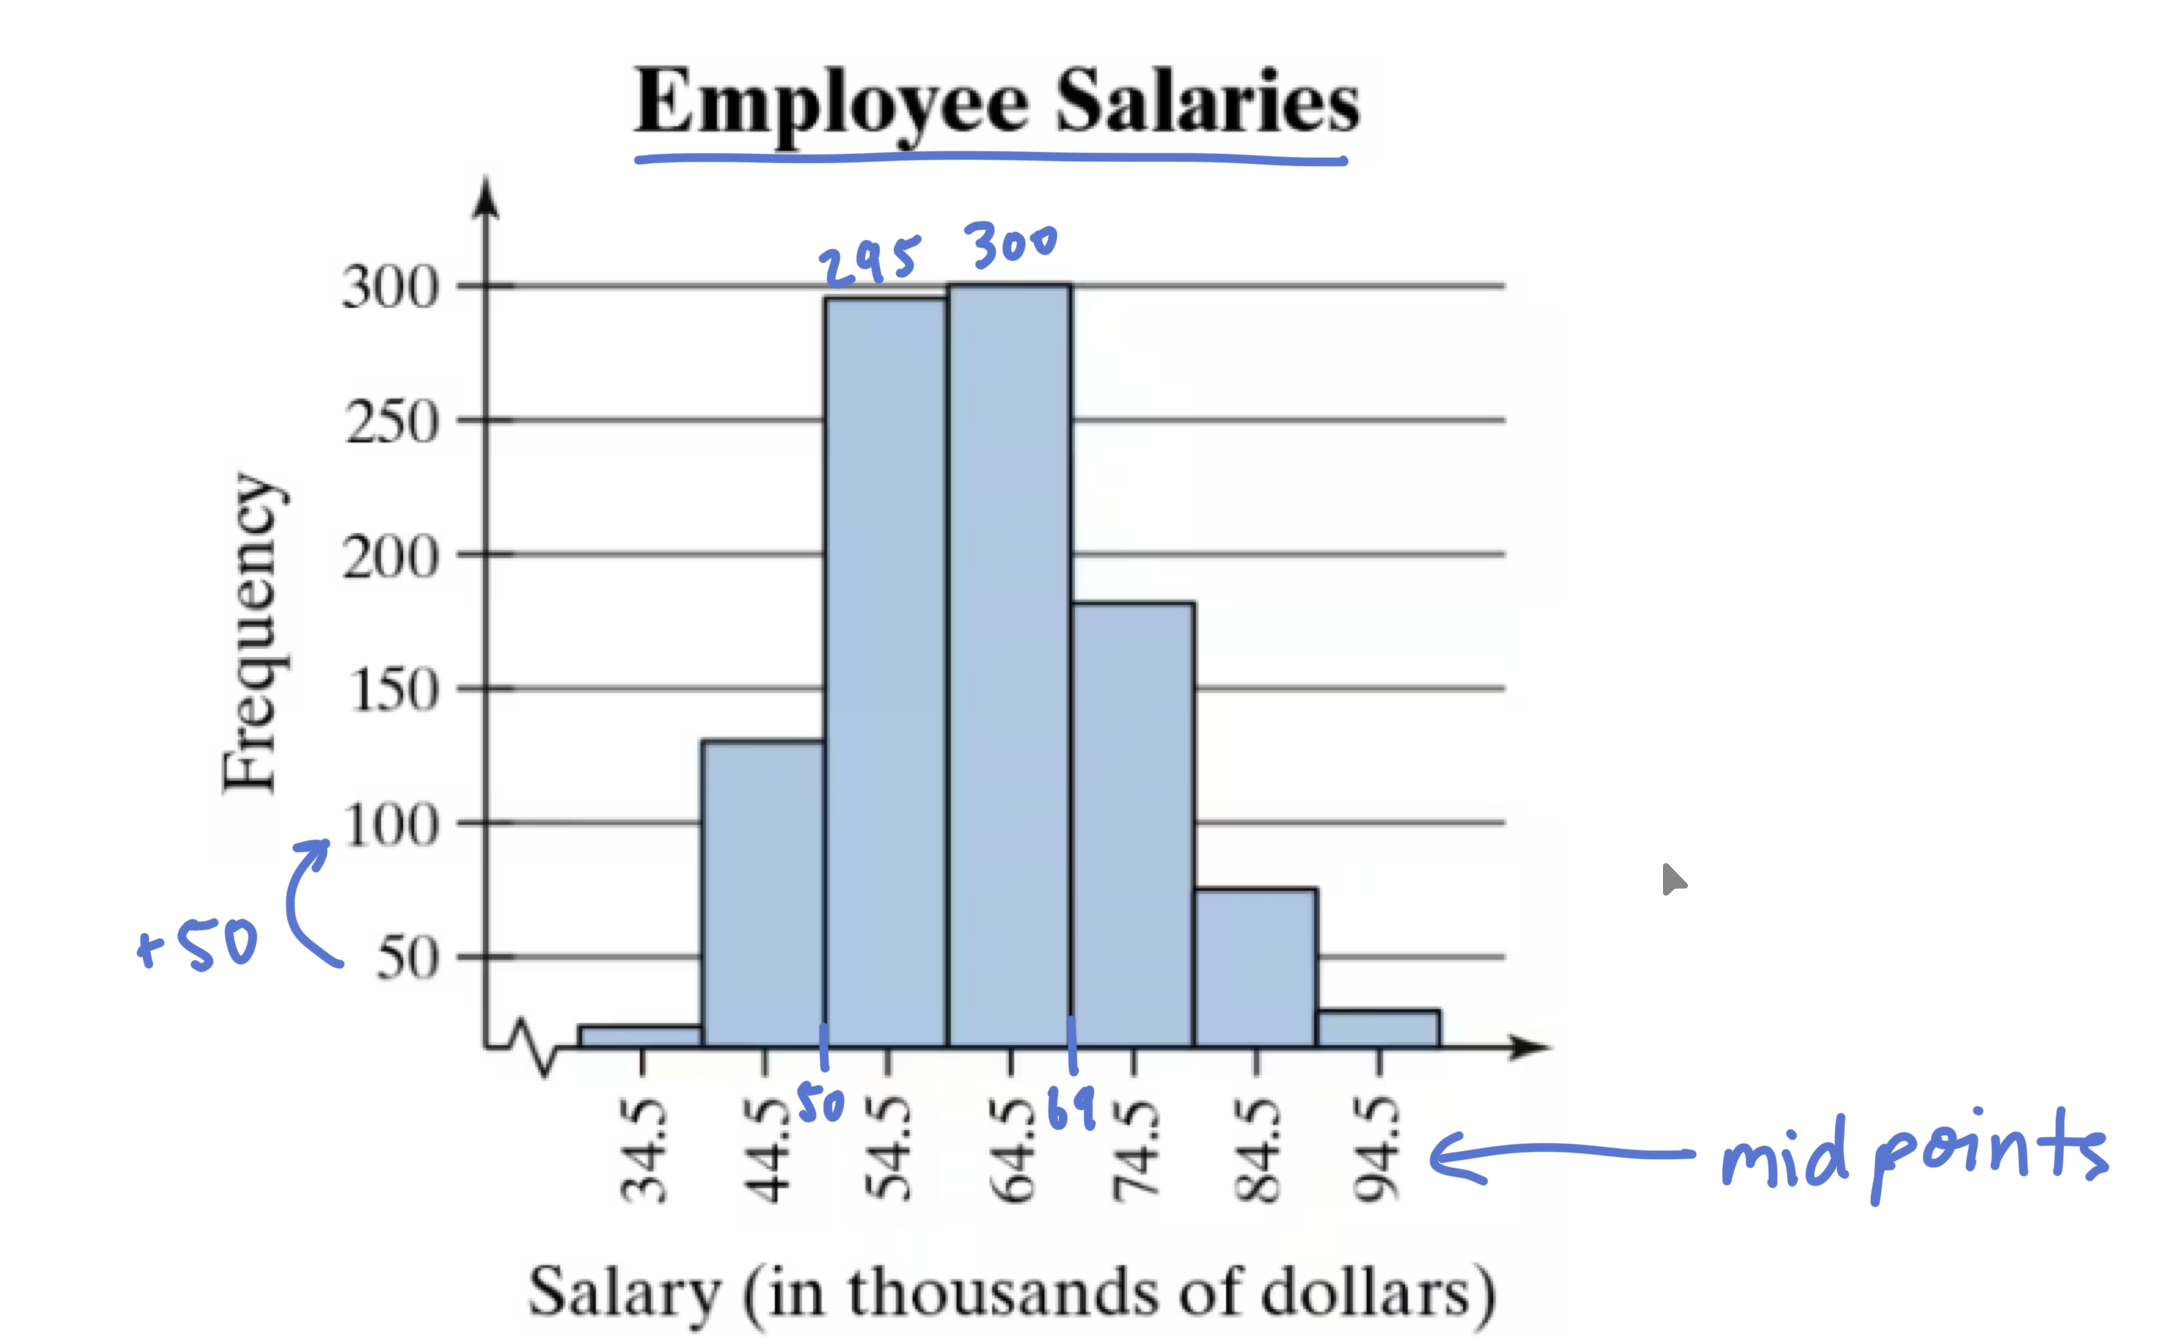
frequency histogram
graph that uses bars to represent frequency distribution of a data set w/ properties:
horizontal scale (quantitative) = class boundaries OR midpoints
vertical scale = frequencies
consecutive bars MUST touch
Graph
relative frequency histogram
frequency histogram BUT w/ vertical scale = relative frequencies
Graph
ogive (cumulative frequency graph)
line graph that displays cumulative frequency of each class at its UCB

Graph
Guidelines for Constructing Ogive
construct frequency distribution w/ cumulative frequencies
specify horizontal & vertical scales
horizontal = UCB
vertical = cumulative frequencies
plot points that represent UCB & corresponding cumulative frequencies
connect points in order from left → right w/ line segments
graph should start at LCB of first class (cumulative frequency = 0) & end at UCB of last class (cumulative frequency = n)