CMA FORMULAS
1/74
There's no tags or description
Looks like no tags are added yet.
Name | Mastery | Learn | Test | Matching | Spaced |
|---|
No study sessions yet.
75 Terms
Liquidity
Short term, pay current liabilities
Net working capital
Current assets - current liabilities
Current ratio
Current assets / current liabilities
Low —> solvency problem
Quick ratio
Cash + marketable Securities + net receivables / current liabilities
No inventories
Cash ratio
Cash + marketable securities / current liabilities
Cash flow ratio
Cashflow from operations / current liabilities
Net working capital ratio
current assets - current liabilities / total assets
Solvency
Long term obligations
Capital structure (equity and debt)
Total debt to total capital ratio
Total debt / total capital
Low ratio
Debt to equity ratio
Total debt / stockholders equity
Low
Long term debt to equity ratio
Long term debt / stockholders equity
Low —> easier to raise new debt
Debt ratio / debt to total asset ratio
Total liabilities / total assets
Earnings coverage ratio
Generate earnings to service debt
Times interest earned ratio
EBIT / interest expense
Ability to pay interest on debt
Earnings to fixed charges ratio
Earnings before fixed charges and taxes / fixed charges
Cash flow to fixed charges ratio
Cash flow + fixed charges + tax payments / fixed charges
Leverage
Relative amount of fixed costs in a firms overall cost structure
Operating leverage
Arises from use of long lived assets
Degree of operating Leverage (single period)
Contribution margin / operating income or EBIT
Contribution margin = net sales - variable costs
Degree of operating leverage (%)
%delta in operating income or EBIT / %delta in sales
Financial leverage
Arises from use of high level of debt
High level —> more debt
DFL (single period)
EBIT / EBT
Interest as only fixed costst
DFL (%)
% delta in net income / %delta in EBIT
Gross profit margin percentage
Net sales - COGS / net sales
Should remain constant
Income statement
Profitability
Operating profit margin percentage
Operating income / net sales
After s&a expense
Income statement
Profitability
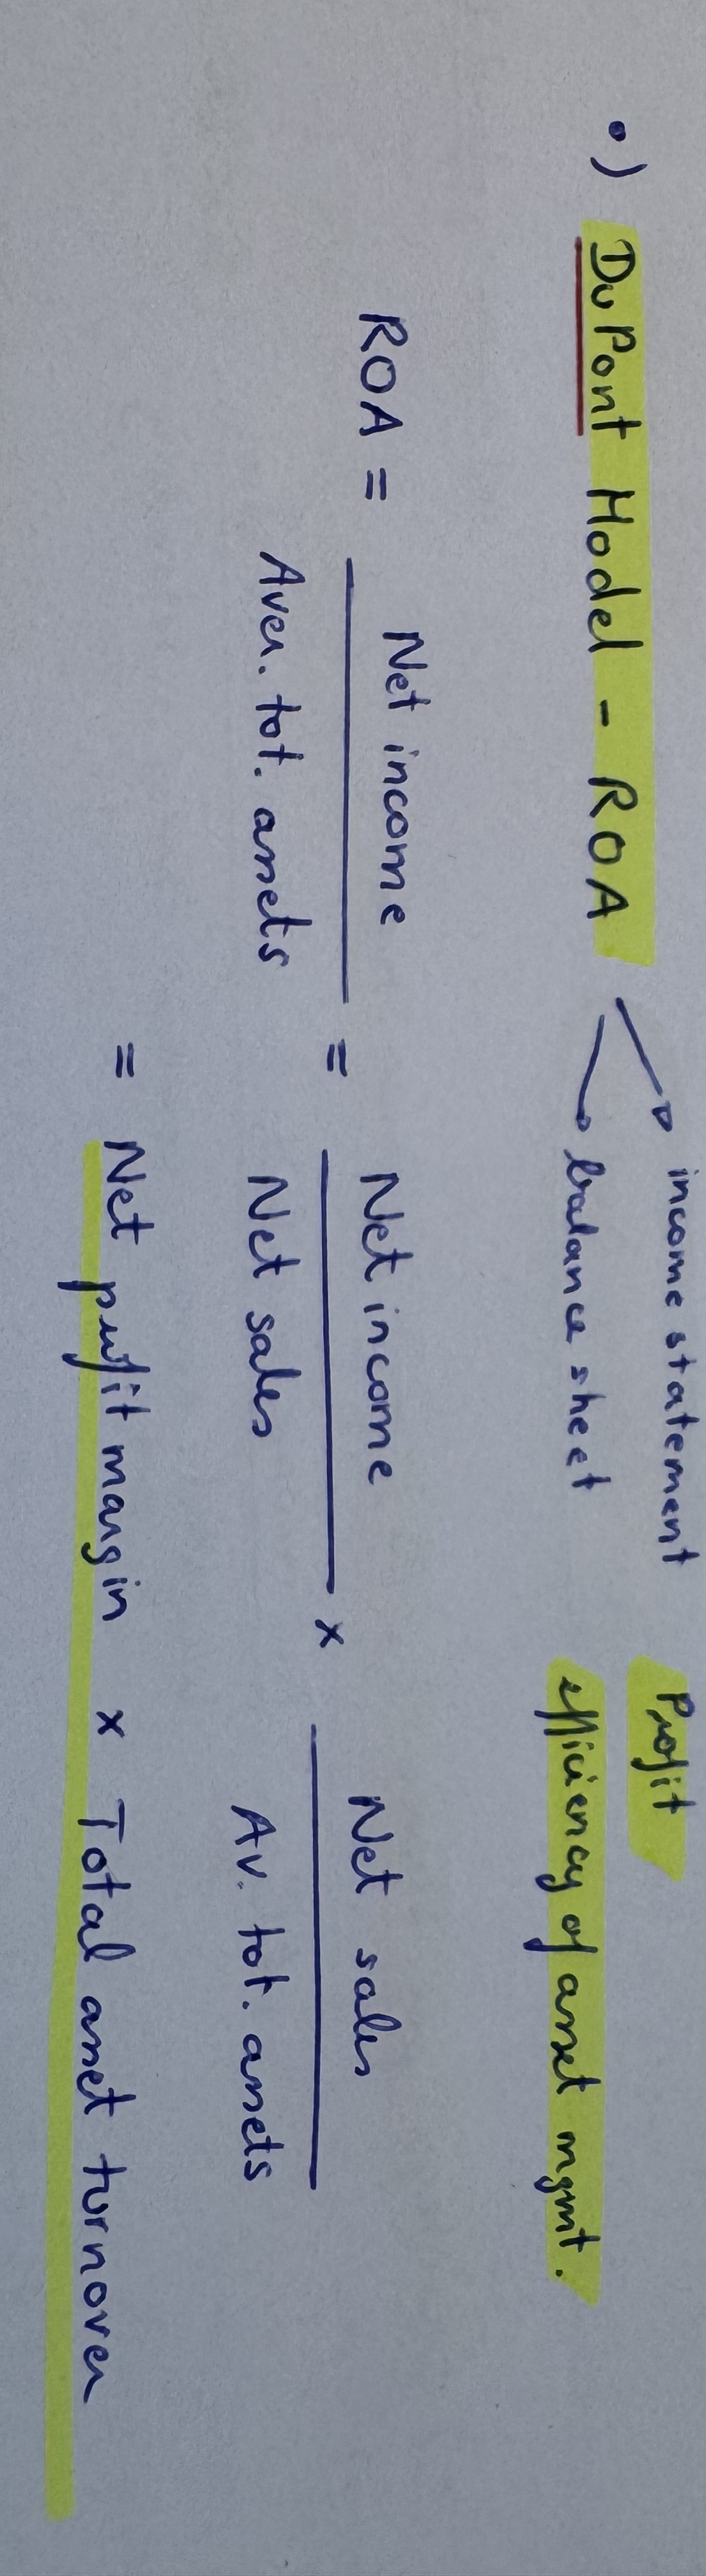
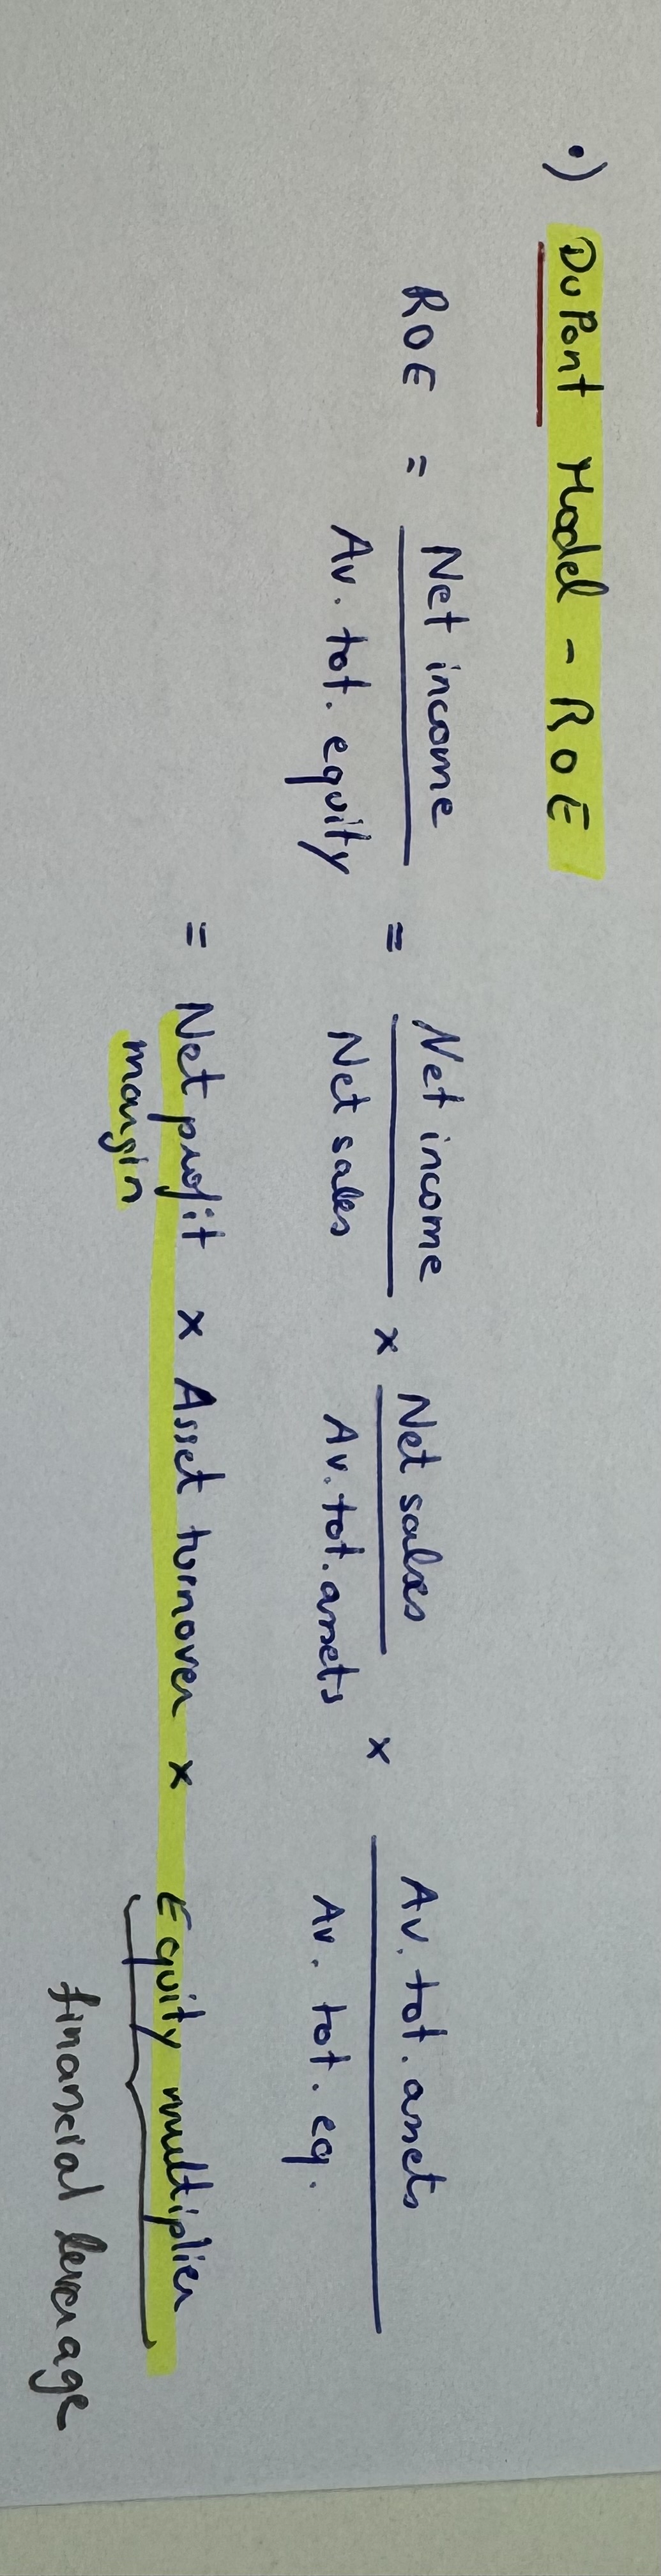
Net profit margin percentage
Net income / net sales
EBITDA margin percentage
EBITDA / net sales
Shows how company is performing if fixed costs are ignored
Overstates income
Return on assets (ROA)
Net income / average total assets
Average tot assets = current year + prior year / 2
How well management deploys assets to get profit
Return on equity
Net income / average total equity
Return per owner dollar invested
What is higher ROE OR ROA
ROE > ROA when ther are liabilities
Relationship ROE and ROA
ROA = ROE x (1- debt ratio)
Sustainable growth rate
ROE x ( 1 - dividend payout ratio)
Retention rate
Potential growth without borrowing more
Du Pont Model ROA
Du Pont ROE
Accounting changes

Earnings per Share EPS basic
Net income available to common shareholders / average number of common stock
Net income available ––> net income - preferred dividend
Book value per share
Total stockholders equity - preferred equity / number of shares
P/E ratio
Market price / EPS
Market to book ratio (price book ratio)
Market price per share / book value per share
Price sales ratio
Market price per share / sales per share
Sales least manipulation
Earnings yield
Earnings per share / market price per share
Dividend payout ratio
Dividend per share / income available to common shareholders
Dividend yield
Dividend per share / market price per share
Shareholder return
(Ending stock price - beginning stock price + dividend) / beginning stock price
Speeding up cash collections —> annual benefit
(Daily cash receipts x days of reduced float) x opportunity cost of funds
Increased investment in receivables
Incremental variable costs x (incremental average collection period / 365)
Cost of change in credit terms
Increased investment in receivables x opportunity cost
Cost of carrying safety stock
Expected stockout cost + carrying cost
Activity ratios
How quickly acc receivables and inventory can be converted to cash
Accounts receivable turnover
Net credit sales / average acc receivable
Days sales outstanding in receivables / cash collection period
365 / acc receivable turnover
Inventory turnover
COGS / average inventory
Days sales in inventory
365 / inventory turnover
Accounts payable turnover
Purchases / average acc payable
Days purchases in acc payable
365 / acc payable turnover
Operating cycle
Days sales outstanding in receivables + days sales in inventory
Cash cycle
Operating cycle - days purchase in acc payable
Fixed asset turnover ratio
Net sales / average PPE
Total asset turnover ratio
Net sales / average total asset
Valuation of bonds

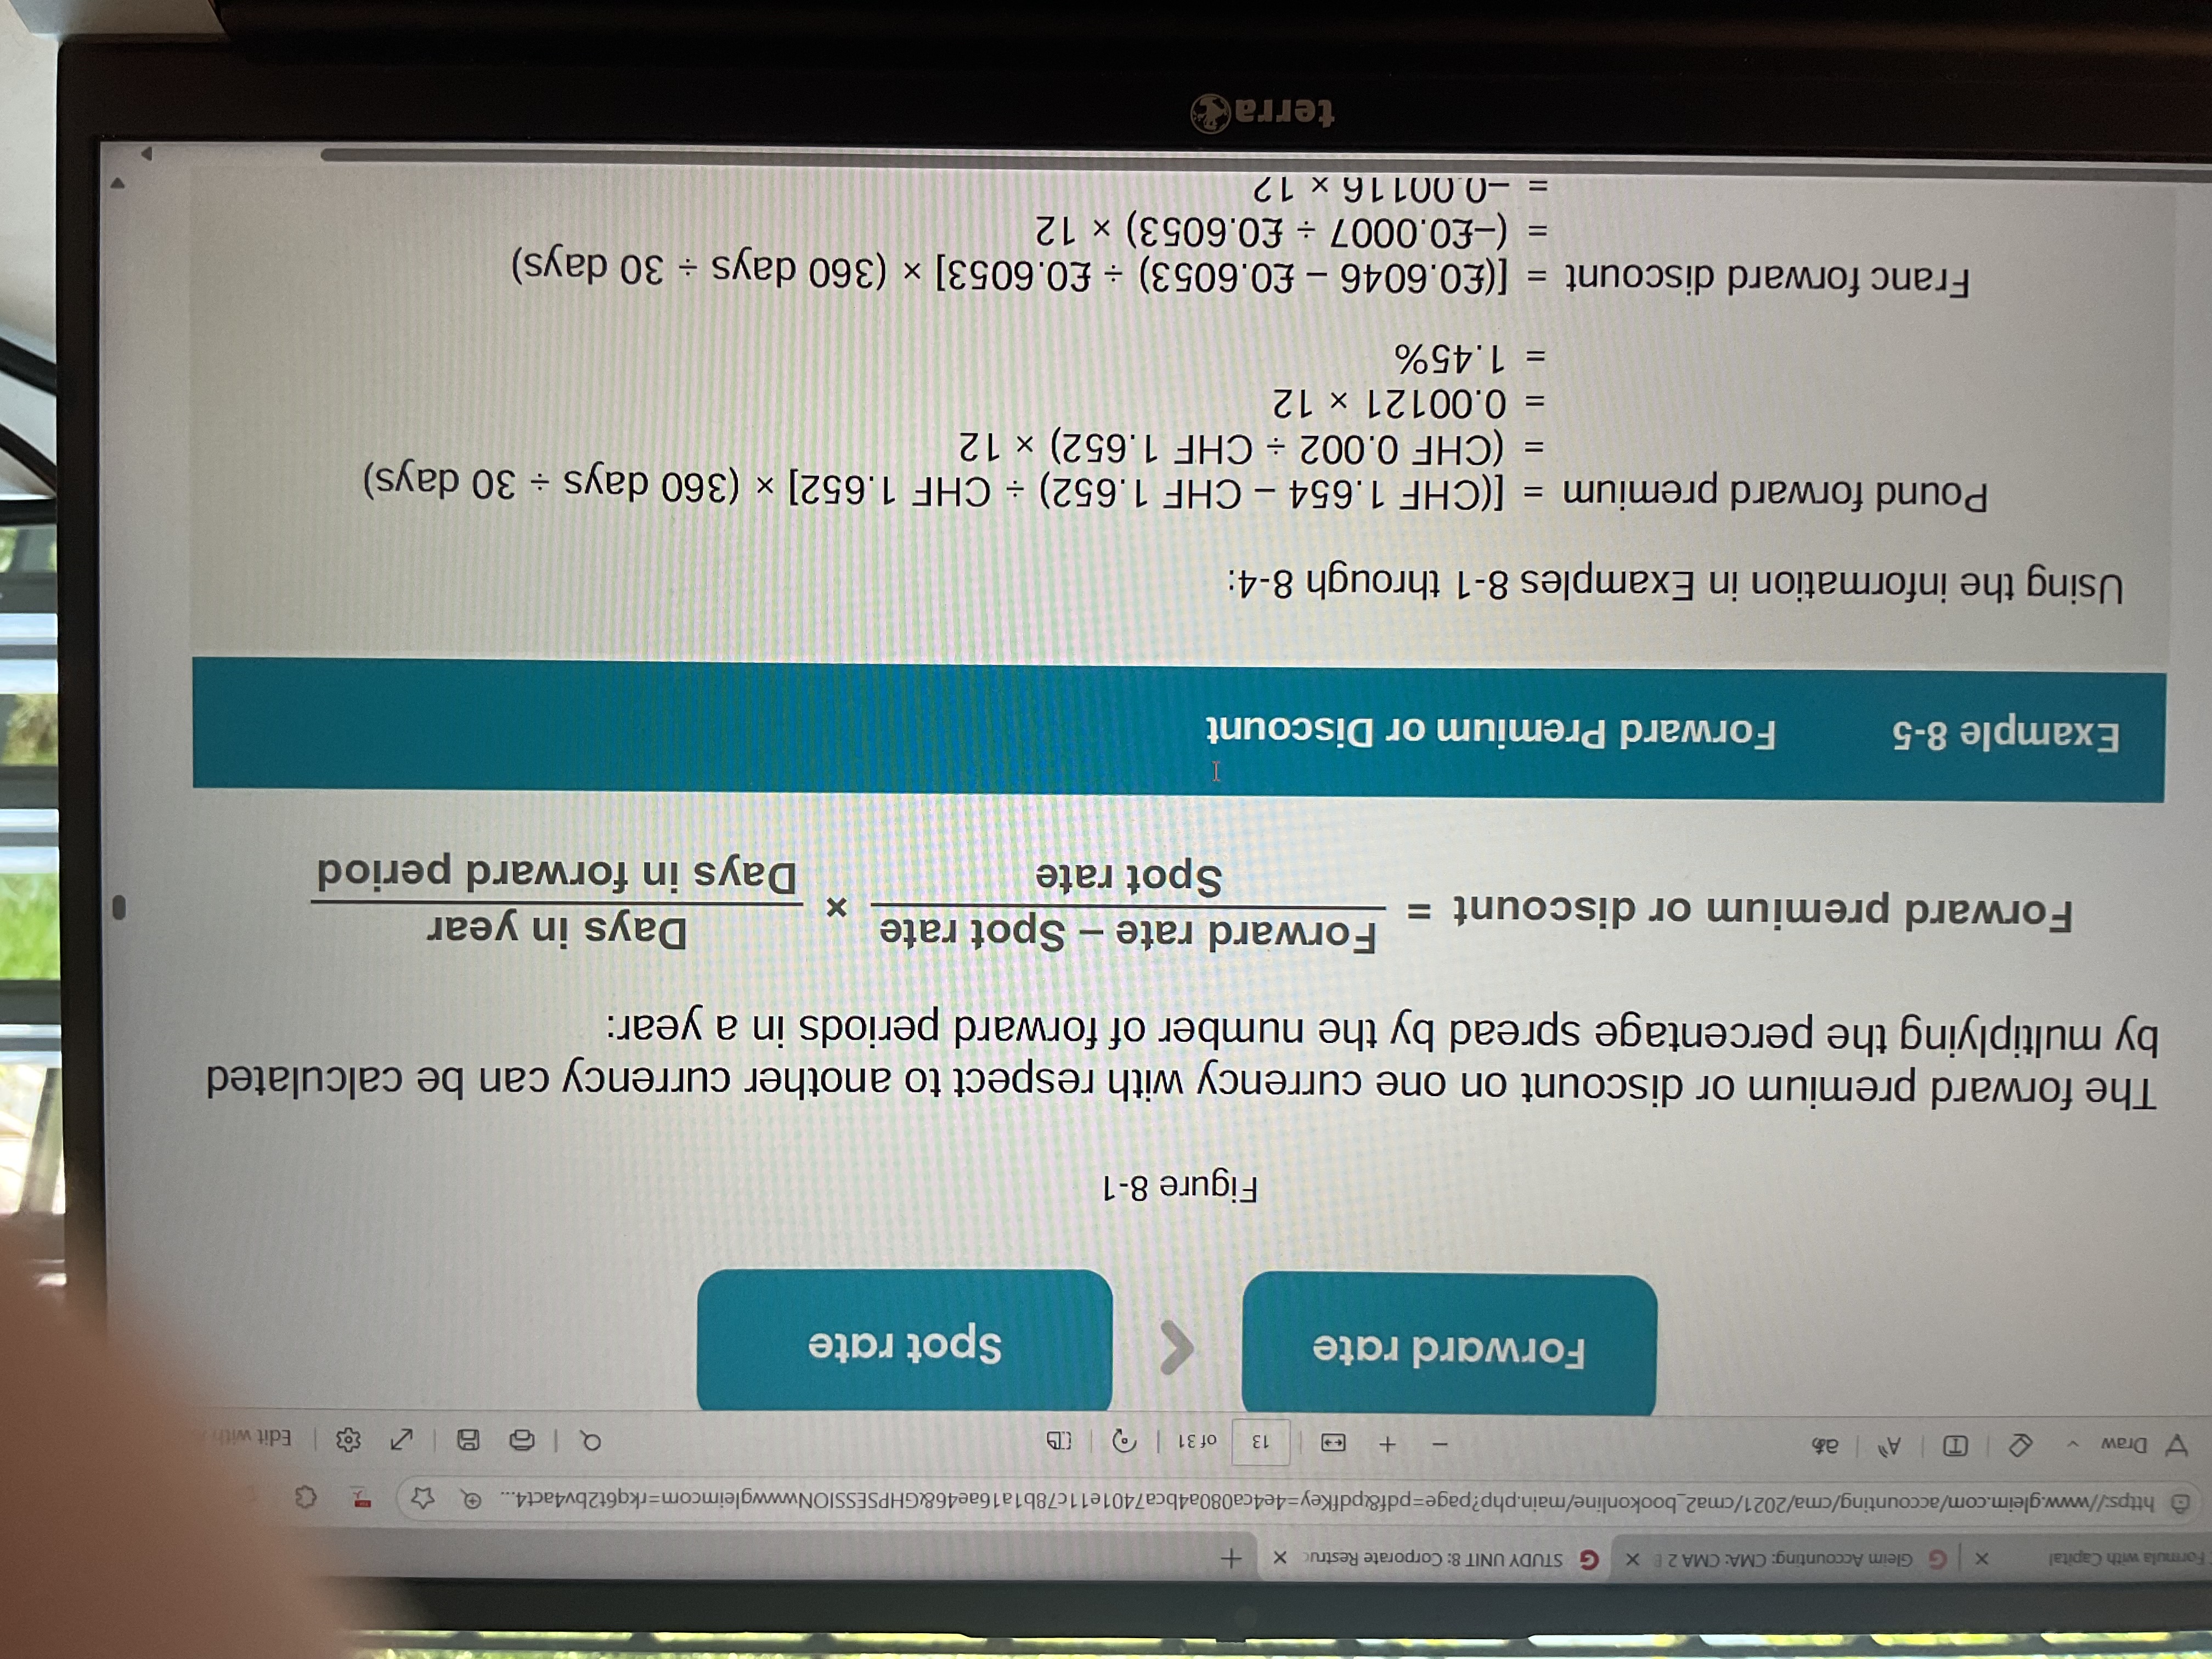
Forward premium or discount
Cross rate
DC per USD / FC per USD
Breakeven point
Revenue = expenses
BEP in units = fixed costs / unit contribution margin
BEP in dollar = fixed costs / contribution margin ratio
Contribution margin ratio
Total contribution margin / total sales
Unit contribution margin / sales per unit
Margin of safety
Excess of budgeted sales over breakeven sales
Margin of safety = planned sales - breakeven sales
Margin of safety ratio = margin of safety / planned sales
Target income in units
Fixed costs + target income / unit contribution margin
Multi product breakeven point
Total fixed costs / weighted average selling price - weighted average variable cost (cm)
weighetd average CMR for multi product
weighetd average CMR = weighted average UCM / weighted average unit selling price
Profit maximization
Marginal revenue = marginal cost
Keep or drop
Lost contribution margin vs fixed cost savings
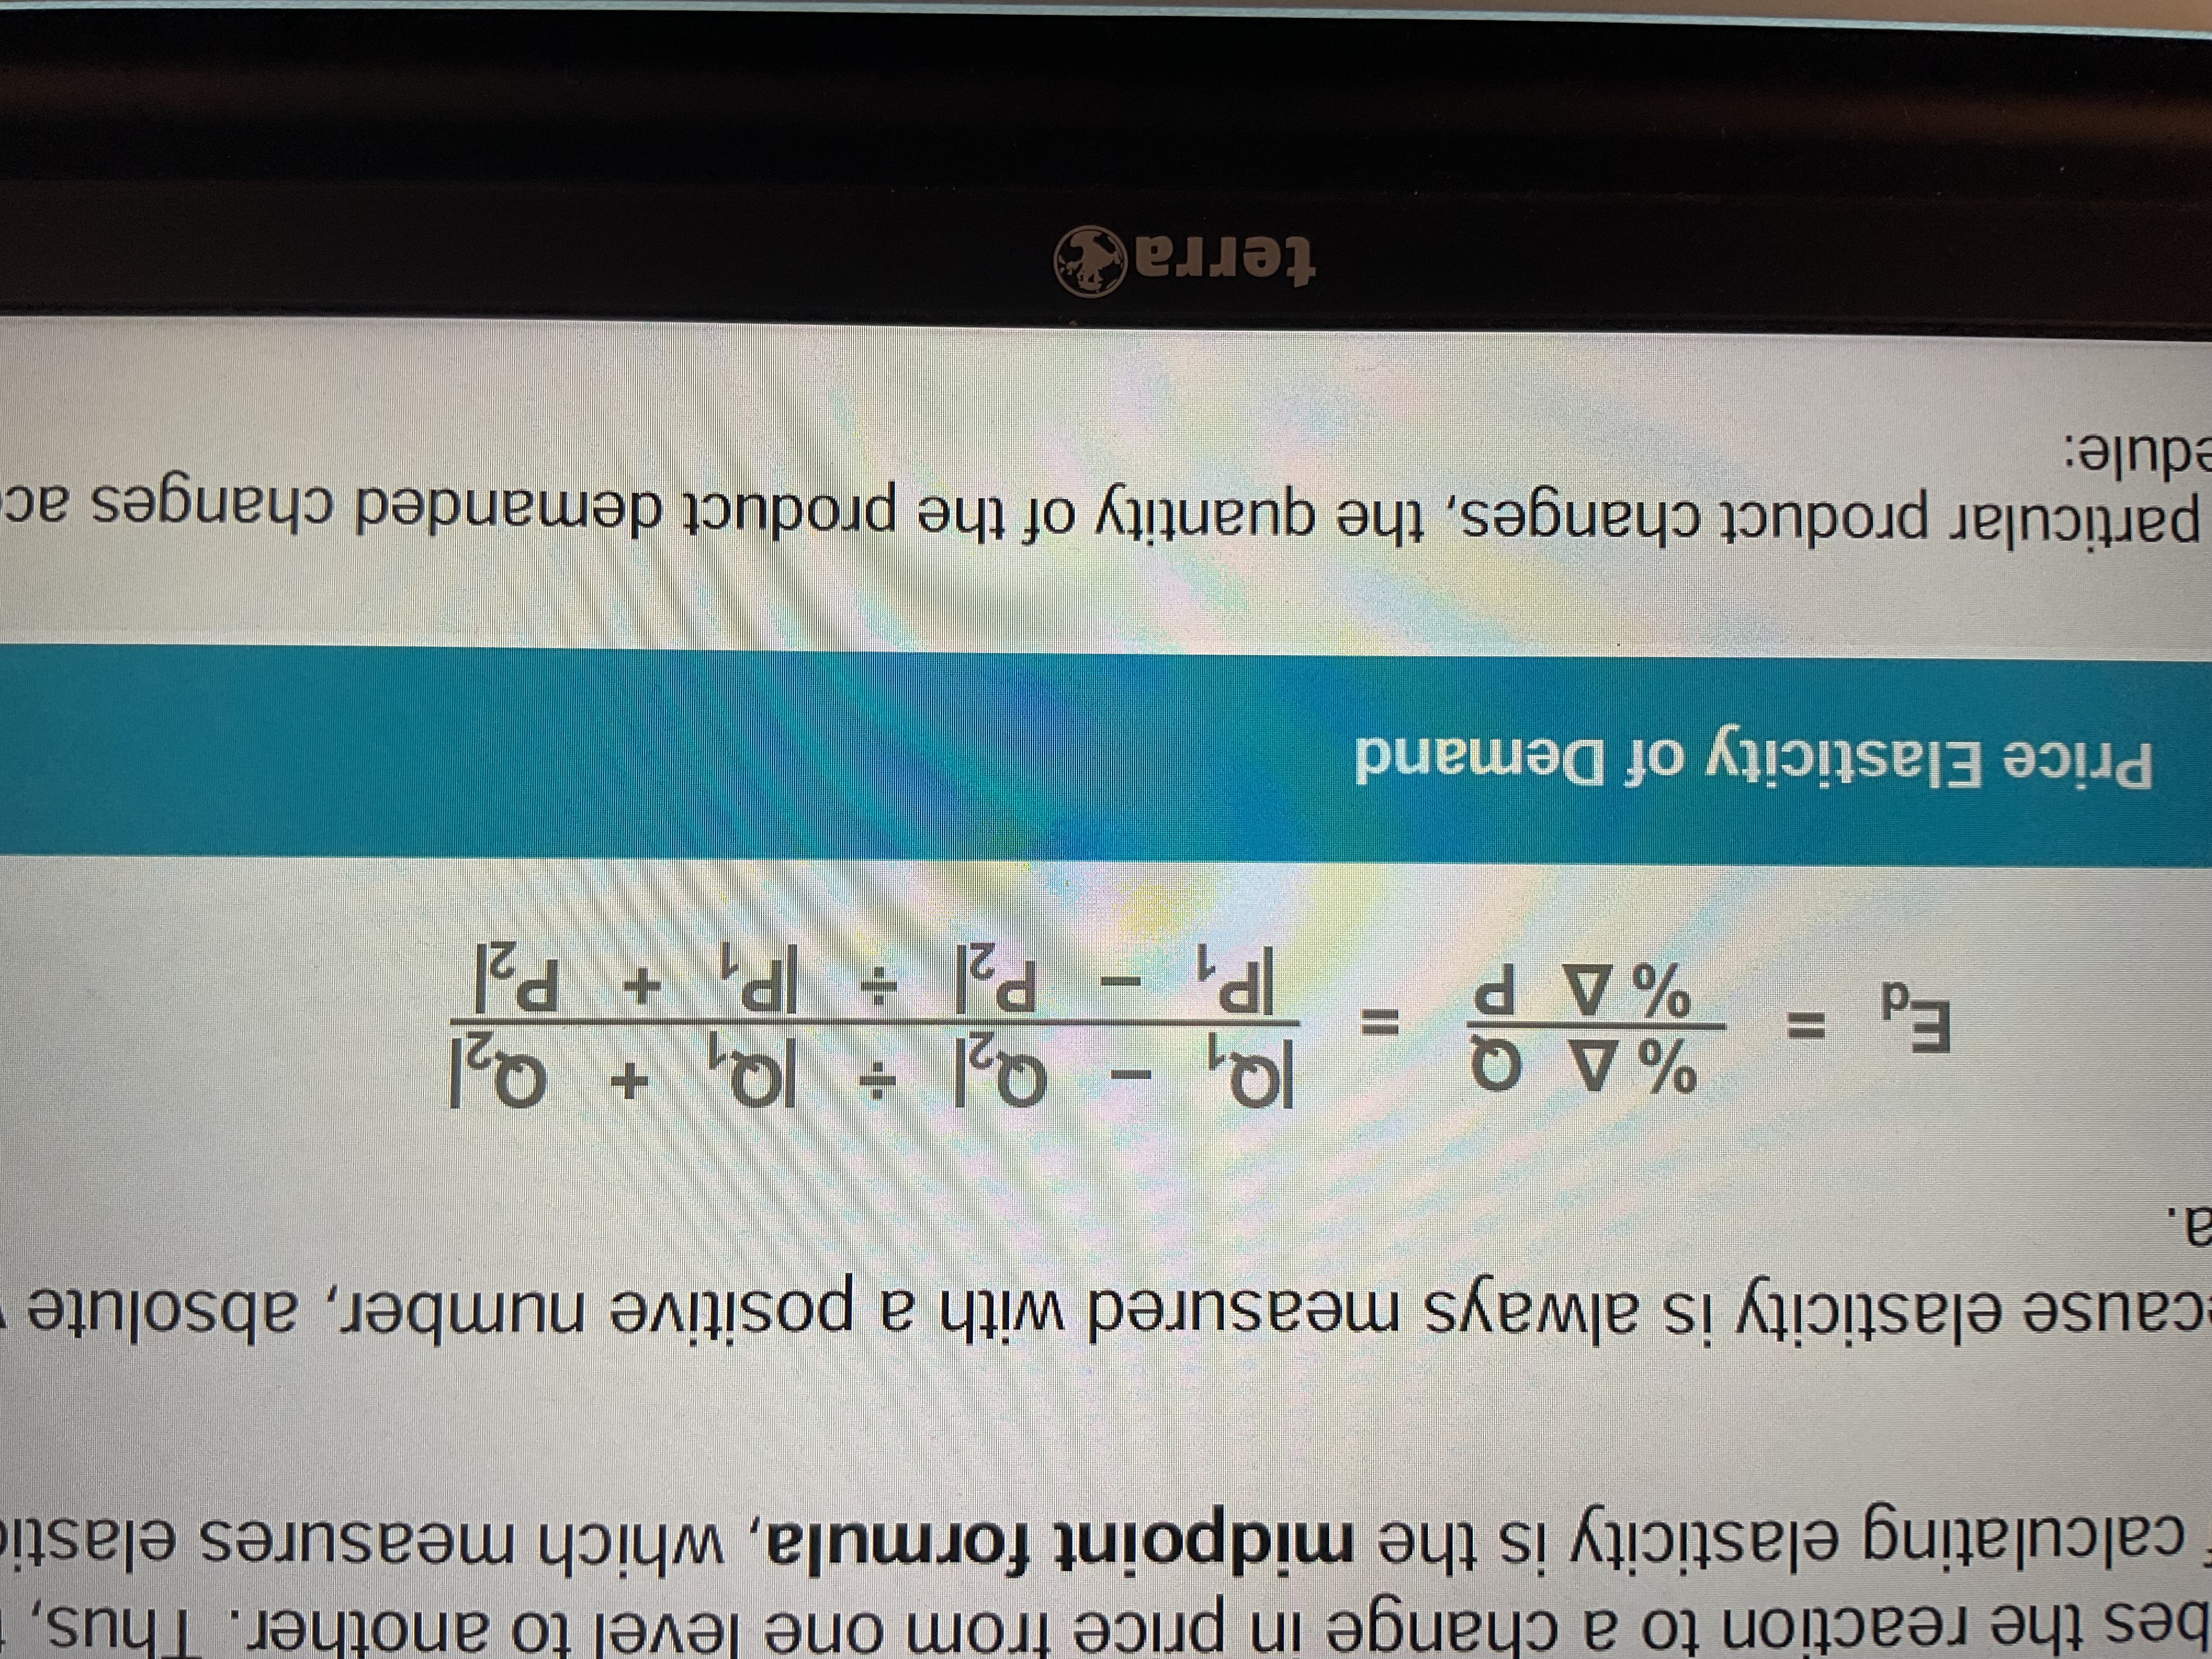
Price elasticity of demand
Ed = percentage change in quantity demanded / percentage change in price
Midpoint formula
Payback period