Div I Exam #1
 Call Kai
 Learn
Learn Practice Test
 Spaced Repetition
 Match
Match Flashcards
 Knowt Play
1/76

Name | Mastery | Learn | Test | Matching | Spaced | Call with Kai | Chat |
|---|
No analytics yet
Send a link to your students to track their progress
77 Terms
Biodiversity
variation at all levels of biological organization
Taxonomy
the science of naming, describing, and classifying living things; one aspect of systematics
Systematics
the study of the diversification of living forms, both past and present, and the relationships among living things through time.
cladogram
A cladogram is a simplified visualization of a taxon’s
evolutionary history, where character states are used to group related organisms. Typically shows a progression from ancestral to most
evolutionarily derived
Synapomorphy
a newly derived character state shared by all members of a
taxon

clade
a group containing a common ancestor and all taxa descending from it
Monophyletic
includes the most recent common ancestor and all of its descendants (aka “clade”)
Paraphyletic
includes the most recent common ancestor but not all of its descendants
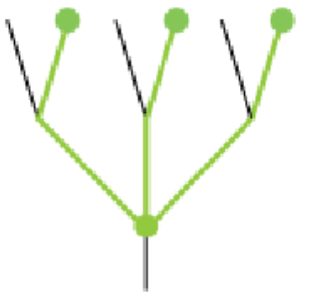
Polyphyletic
grouping derived from more than one ancestor
Outgroup
Lineage that diverged prior to the clade of interest, used to anchor the tree.
Conservation
a careful preservation and protection of something
Use values for Conservation
Direct or indirect economic benefits derived from biological resources.
Non-use values for Conservation
Intrinsic value, existence value, or legacy for future
generations.
In Situ Conservation
Protecting species directly within their natural ecosystem
habitats.
Ex Situ
Preserving components of biological diversity outside natural
habitats.
Endemism
Species naturally restricted to a specific geographic region.
United Nations definition of biodiversity
The variability among living organisms from all sources… and the ecological
complexes of which they are part; this includes diversity within species,
between species, and of ecosystems.
Genetic Diversity
variation in the genetic make-up between individuals within a population and between populations
Organismal Diversity
the variation in a particular level of the taxonomic hierarchy (species, genera, and beyond)
Ecological (Ecosystem) Diversity:
ecological differences between habitats and biomes
Alpha Diversity
diversity within a particular area or ecosystem
Beta Diversity
differences in alpha diversity between ecosystems
Gamma Diversity
overall diversity for the different ecosystems in a broad region
Percentage of described, extant Vertebrates
3%
Percentage of described, extant Plants
16%
Percentage of described, extant Fungi
4%
Percentage of described, extant Invertebrates
66%
Percentage of described, extant viruses and prokaryotes
<0.01%
Percentage of described, extant protists
11%
Levels of taxonomy
Kingdom, Phylum, Class, Order, Family, Genus, Species
Holotype
organism on which species description is based
Isotype
Collected at the same place and time as holotype
Paratype
Collected at a different place or time than holotype
Species Richness
The number of species within a given sampling area
Species Evenness
How abundant each species is relative to the total number of individuals
Species-Area Relationships (Curves)
Empirical mathematical
relationship showing species richness increases predictably
with sampling area:
Phylogeny
the evolutionary history of a taxon
Phylogenetic Trees
Show inferred evolutionary relationships hypothesized by particular investigators
Species Richness
Raw count of number of species
Species Evenness
A measure of the relative abundance of the different species within a given area
Aristotle
Early classification via Scala Naturae (linear ladder of life
complexity)
Carolus Linnaeus
Father of modern taxonomy; established binomial
nomenclature (Genus + species).
Steps to Describe a Species:
Collect specimen → Detailed diagnosis &
description → Assign binomial Latin name & designate holotype → Peer-
reviewed publication.
Geological Hierarchy
Eons → Eras → Periods → Epochs
Origin of life and cyanobacterial
oxygenation of atmosphere
3.8–2.5 Ga
Origin of eukaryotic cells and early
fungal lineages
1.5–1.0 Ga
First land plants (Bryophytes) and
vascular plant radiation
470–420 Ma
Dominance of Seed Ferns,
Gymnosperms, & Angiosperm origin.
350–100 Ma
Origin of Earth
~4.5 Billion years ago
Precambrian Archaean Eon
first life arises - chemoautotrophic prokaryotes (3.8 billion years ago)
cyanobacteria begin photosynthesizing
Precambrian Proterozoic Eon
2.5bya- 570mya, Great Oxygenation Event, eukaryotes evolve (2bya), life dominated by small, soft-bodied eukaryotes until Cambrian Explosion
Cryogenian Period
720mya to 635mya, massive ice ages
Ediacaran/Vendian Period
635mya to 541mya
Proliferation of multicellular, soft-bodied organisms
Phanerozoic Eon
542mya to present
Paleozoic Era
542-251mya, life moves to land, almost all invertebrate phyla appear
Cambrian Period
542-488 mya, ‘explosion’ brings diversification of form and algae, most major animal phyla appear, origin of general body plan for metazoans (animals), marine life still dominant
Ordovician Period
488-423mya
shallow seas with abundant marine invertebrates
first vertebrates with true bones (fish)
first life on land, mass extinction
Silurian Period
423-416mya
life on land progresses slowly
first appearance of vascular plants
major diversification of fish
Devonian Period
416-359mya
significant diversification of life on land
first stomata and cuticle like covering
rhizoids
tetrapods and arthropods colonize land
mass extinction
Carboniferous Period
359-299mya, warm & humid climate, extensive forests generating massive coal reserves, high levels of oxygen in atmosphere (35%), reptiles appear (with amniotic egg)
Permian Period
299-251mya, supercontinent pangaea, starts with ice age, ends with mass extinction, drier climate, modern conifers appear
Mesozoic Era
251-65.5mya, dinosaurs, fragmentation of Pangaea leads to speciation
Triassic Period
251-200mya
warm and dry climate
recovery from permian extinction
mammals and dinosaurs evolve
Jurassic Period
200-145mya, first birds appear, largest land animals of all time, cycads dominate plant world
Cretaceous Period
145-65.5mya, sea levels reach highest point, flowering plants (angiosperms) appear, age of reptiles, mass extinction event
Cenozoic Era
65.5mya-present
mammals dominant on land
Pleistocene Epoch (Last major ice age)
Holocene Epoch (Post ice age, species radiation)
Reasons for maintaining biodiversity
Ecosystem services
economic & agricultural resilience
ethical responsibility
Reasons for opposition of biodiversity
Economic opportunity costs, short-term vs long-term priorities, property rights & regulations
Beetles (Coleoptera)
Make up over 25% of all described animal species on Earth. Described by JBS Haldane.
End Ordovician Extinction
85%, 2my ice age
Late Devonian Extinction
80%
not well understood - mass depletion?
Permian Extinction
95%
Largest mass extinction
occurred in pulses
probably due to massive volcanism (Siberian Traps) that rapidly increased CO2
End Triassic Extinction
80%, volcanism
Cretaceous-Tertiary Extinction
75%
K-T Event
dinosaur extinction
asteroid impact
lowered sea levels
intense volcanic activity
Anthropocene/Holocene Extinction
potential human-caused mass extinction
rates up to 100x higher than background rates
timing corresponds with industrialization
Mass Extinction Events
relatively short events resulting in massive species loss, indiscriminate, opens niches for adaptive radiation and greater diversity
Described, Extant Species
1.9M out of ~8.7M estimated