Chapter 6: Comparing two means (Independent Samples)
1/20
There's no tags or description
Looks like no tags are added yet.
Name | Mastery | Learn | Test | Matching | Spaced | Call with Kai |
|---|
No analytics yet
Send a link to your students to track their progress
21 Terms
Q: What are we typically comparing in two-sample quantitative problems?
A: The means of two independent populations or groups.
What are quartiles?
For any set of 𝑛 measurements, the 𝒑𝒕𝒉 percentile is a number such that 𝑝% of the measurements fall below the 𝑝𝑡ℎ percentile and (100 – 𝑝)% of the measurements fall above it.
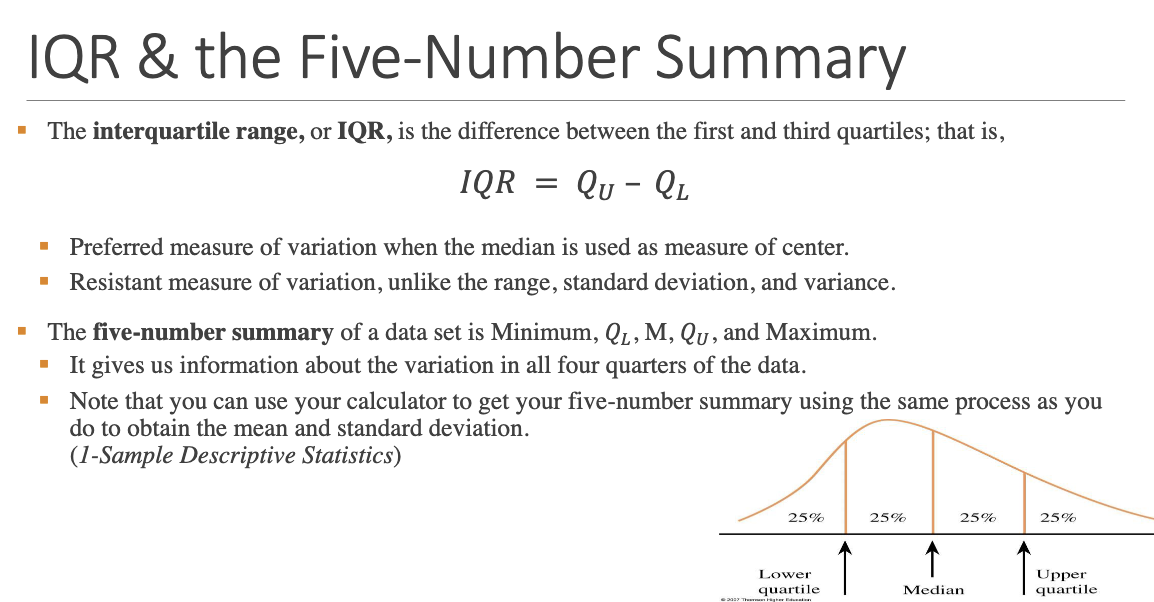
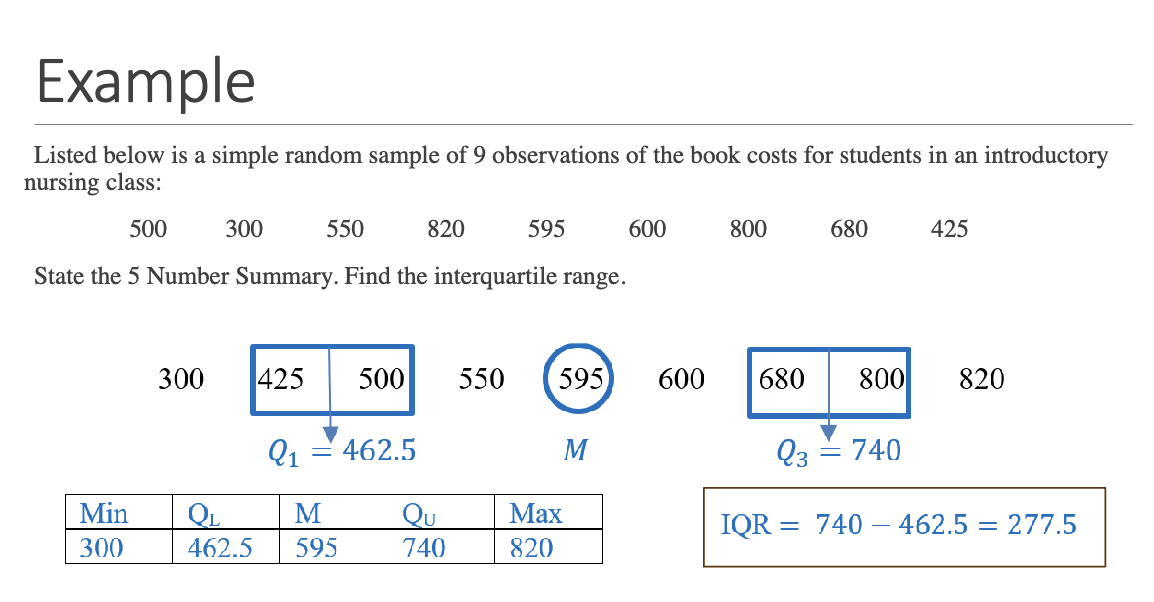
What are the five-number summary components?
Minimum, Q1 (first quartile), Median (Q2), Q3 (third quartile), Maximum. This summary gives an overview of the distribution’s spread and center.
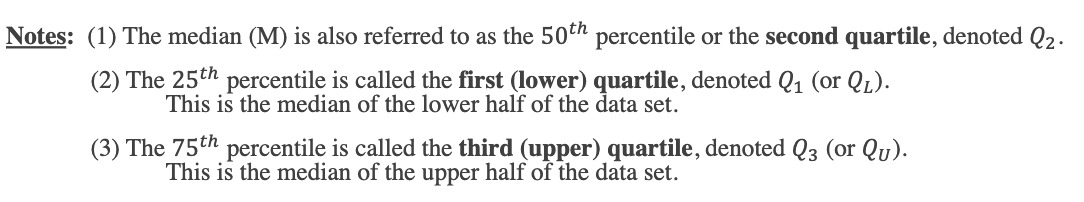
What are quartiles, and how are they defined?
• Q1 (25th percentile): Median of the lower half of the data
• Q2 (50th percentile): The median of the data set
• Q3 (75th percentile): Median of the upper half of the data
They divide the data into four equal parts.
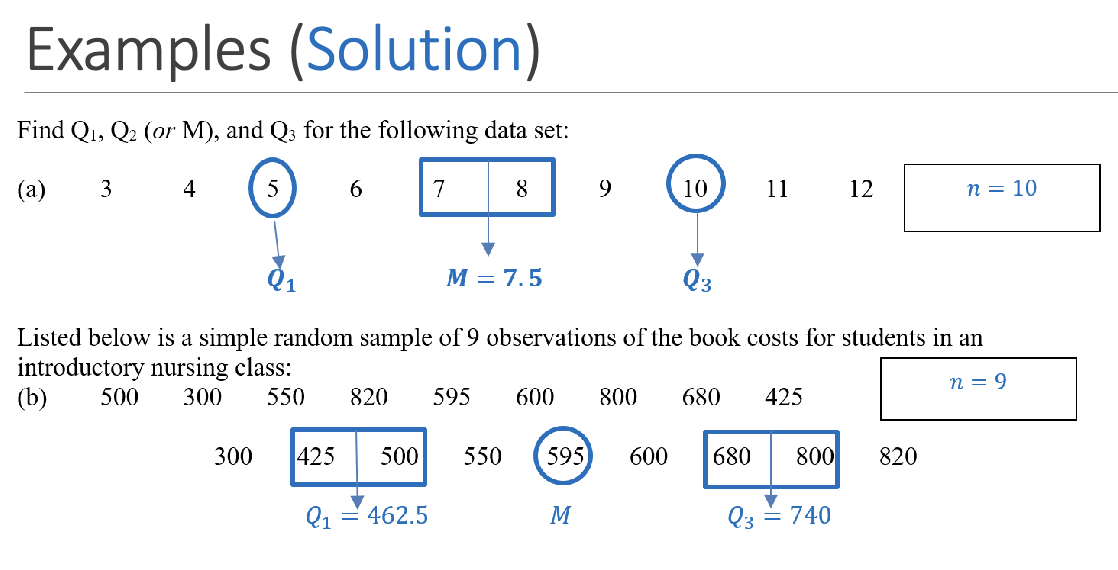
How do you calculate quartiles when the number of observations is odd vs. even?
• Odd: Omit the middle value (median) when calculating Q1 and Q3
• Even: Include all values when locating the first and third quartiles
What is the Interquartile Range (IQR) and why is it important?
IQR = Q3 − Q1. It measures the spread of the middle 50% of the data and is a resistant measure, meaning it is not affected by outliers.
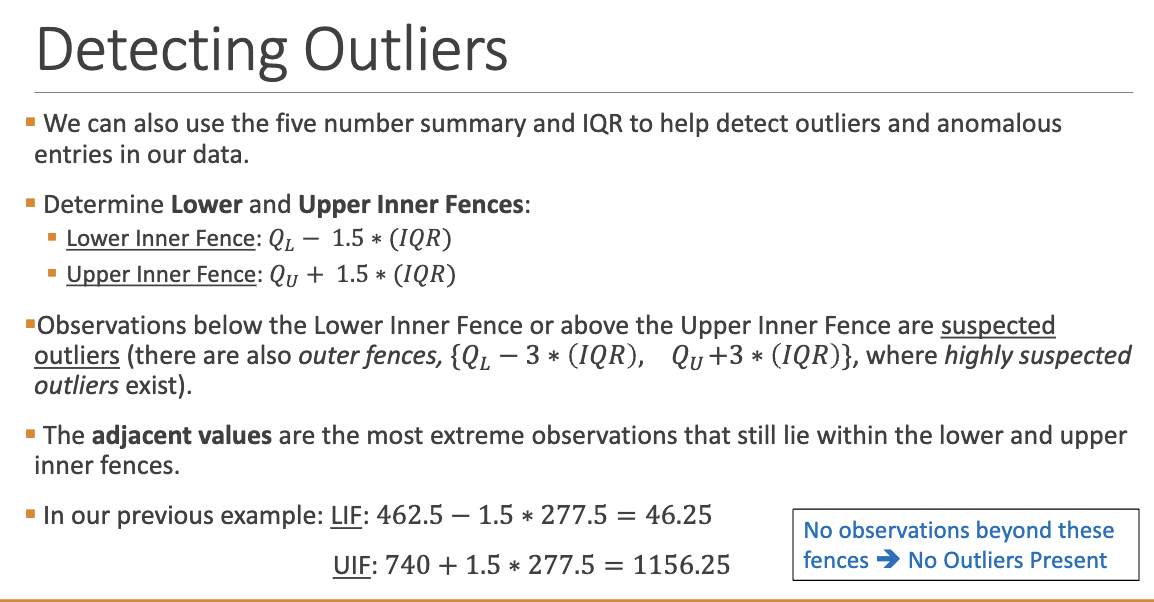
How are outliers detected using the IQR method?
• Lower Fence: Q1 − 1.5 × IQR
• Upper Fence: Q3 + 1.5 × IQR
Values outside these fences are considered potential outliers.
What is a boxplot and what does it visualize?
• Longer whiskers indicate skewness
• Dots outside whiskers are potential outliers
• Symmetry or skewness can be visually assessed
What are the limitations of boxplots?
They do not show frequency, multimodality, or clustering. Best used with dotplots or histograms for a fuller picture.
How do you assess normality using standard deviation intervals?
• 68% of data within x̄ ± s
• 95% within x̄ ± 2s
• 100% within x̄ ± 3s
Applies when data is approximately normal.
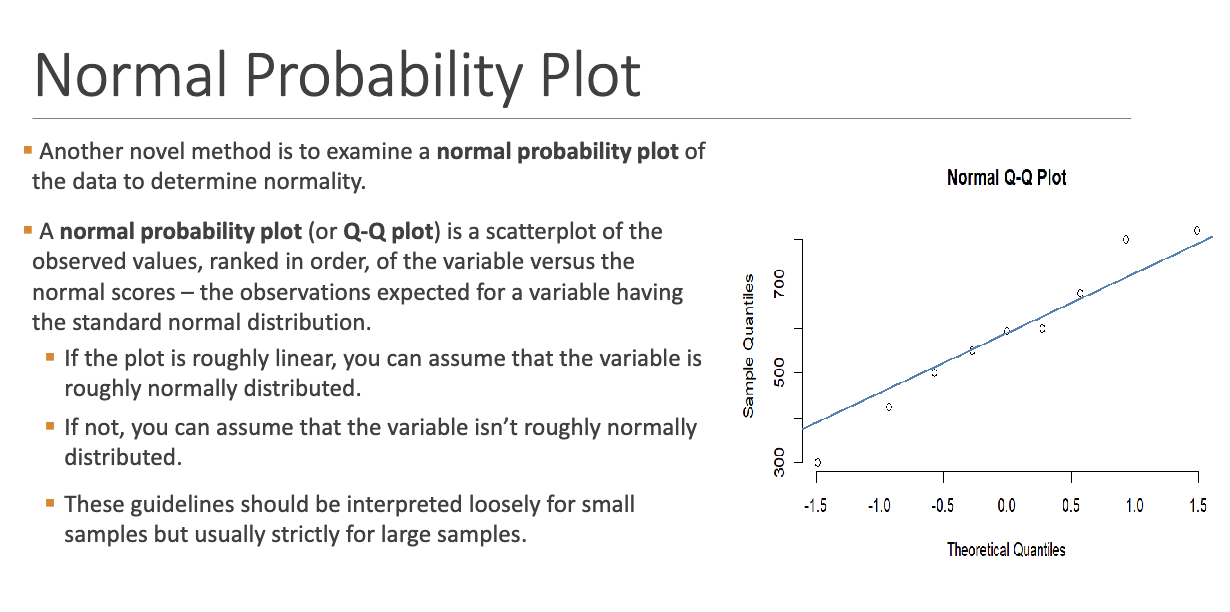
What is a normal probability plot (Q-Q plot) and how do you interpret it?
A scatterplot comparing sorted data values with expected normal values. If points fall close to a straight line → data is likely normal.
What is the simulation-based approach for comparing two means?
Randomly shuffle group labels to simulate the null hypothesis that there’s no difference between groups.
What are the hypotheses used in a simulation comparison?
• H₀: μ₁ = μ₂ (no difference)
• Hₐ: μ₁ ≠ μ₂ or μ₁ > μ₂ or μ₁ < μ₂ (depending on the scenario)
How is the p-value interpreted in simulation?
It represents the proportion of simulated differences as extreme or more extreme than the observed difference.
What is the 2SD method for confidence intervals?
Estimate = observed statistic ± 2 × (SD from simulation)
E.g., 0.714 ± 2(0.302) → (0.110, 1.138)
Comparing two means: Theoretical approach
What are the three validity conditions for two-sample t-procedures?
1. n ≥ 30 in both samples (CLT applies)
2. Populations are approximately normal
3. Robust condition: n ≥ 20 and not strongly skewed
When variances are equal, what procedure is used?
Use the pooled t-test with pooled variance and degrees of freedom: df = n₁ + n₂ − 2
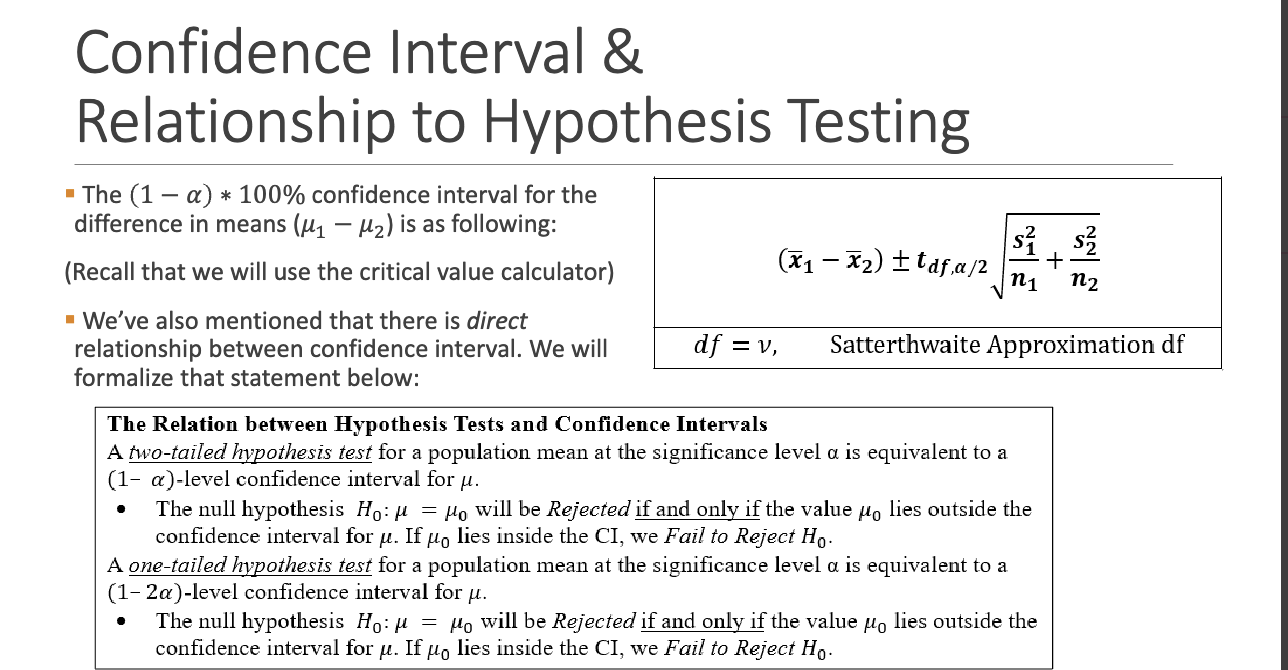
What is the Welch’s t-test and when is it used?
Used when variances are unequal. It uses the Satterthwaite approximation for degrees of freedom.
What does it mean if 0 is not in the confidence interval for μ₁ − μ₂?
There’s significant evidence of a difference between the two means → Reject H₀.
What non-parametric tests can be used instead of t-tests?
• Wilcoxon Rank Sum Test: compares ranked medians
• Kolmogorov–Smirnov Test (KS): compares entire distributions
Connection Between CI & Hypothesis Testing