PSYC2203 - W7 - effect sizes - repeated measures t-test - one-tailed vs two-tailed - 95% confidence intervals
0.0(0)
Card Sorting
1/16
There's no tags or description
Looks like no tags are added yet.
Last updated 12:30 PM on 4/30/23
Name | Mastery | Learn | Test | Matching | Spaced | Call with Kai |
|---|
No analytics yet
Send a link to your students to track their progress
17 Terms
1
New cards
What are effect sizes
Estimates the proportion of variability in scores on a dependent variable explainable BY variations in the level of independent variable.
\
Can help determine if a significant result is ‘meaningful’ - i.e., if effect size is small but difference is significant the finding is kinda useless…..
Useful for performing meta-analysis of data across similar studies.
\
The effect size number is denoted by *d* .
\
Can help determine if a significant result is ‘meaningful’ - i.e., if effect size is small but difference is significant the finding is kinda useless…..
Useful for performing meta-analysis of data across similar studies.
\
The effect size number is denoted by *d* .
2
New cards
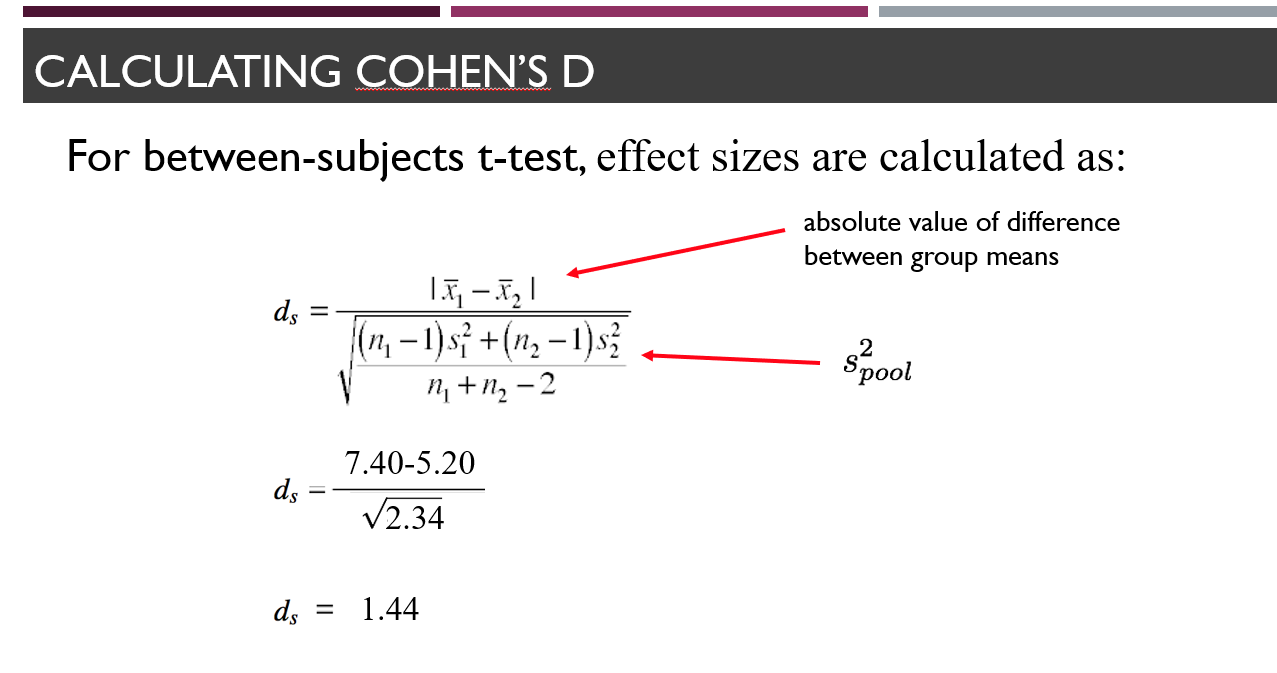
How to calculate effect size for between-subjects t test - can refer to formula sheet
d = absolute value of difference between group means divided by pooled variance.
\
\
Absolute value means positive no matter what. So if difference between means is negative just turn it positive. (dont need to remember this point)
\
\
\
Absolute value means positive no matter what. So if difference between means is negative just turn it positive. (dont need to remember this point)
\
3
New cards
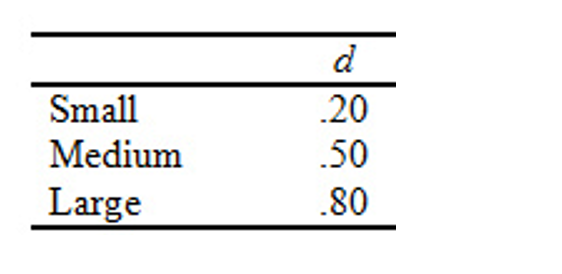
Guidelines for interpreting Cohen’s d
Look at attached image.
\
It is subjective and not concrete. I.e., 0.19 effect size is still considered small.
\
And 0.36 is medium as its closer to medium than to small.
\
It is subjective and not concrete. I.e., 0.19 effect size is still considered small.
\
And 0.36 is medium as its closer to medium than to small.
4
New cards
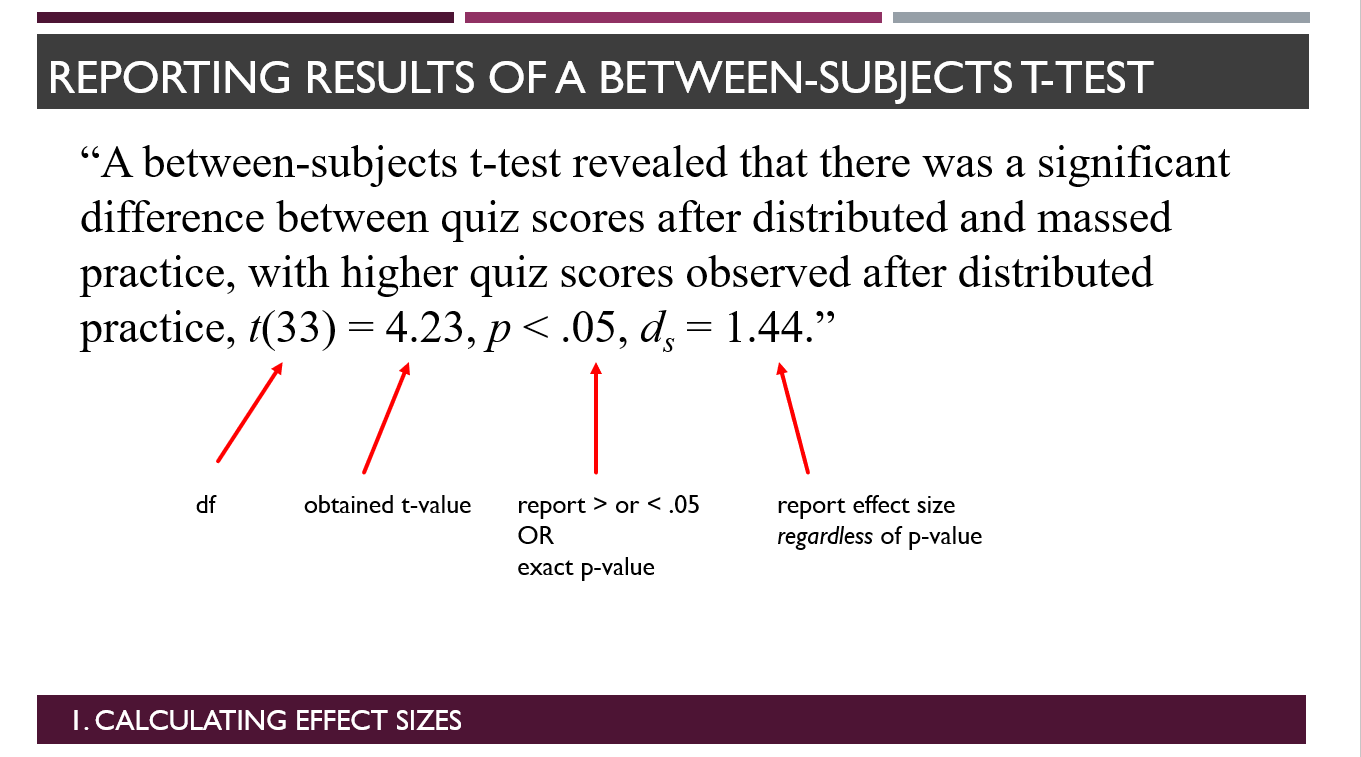
Reporting results of a between-subjects t-test - (just filler card, no need to memorise this AT ALL).
5
New cards
Repeated measures t-test - when to use it, has an advantage over between-subject - what is it?
Use it when each participant is exposed to both conditions of the independent variable.
\
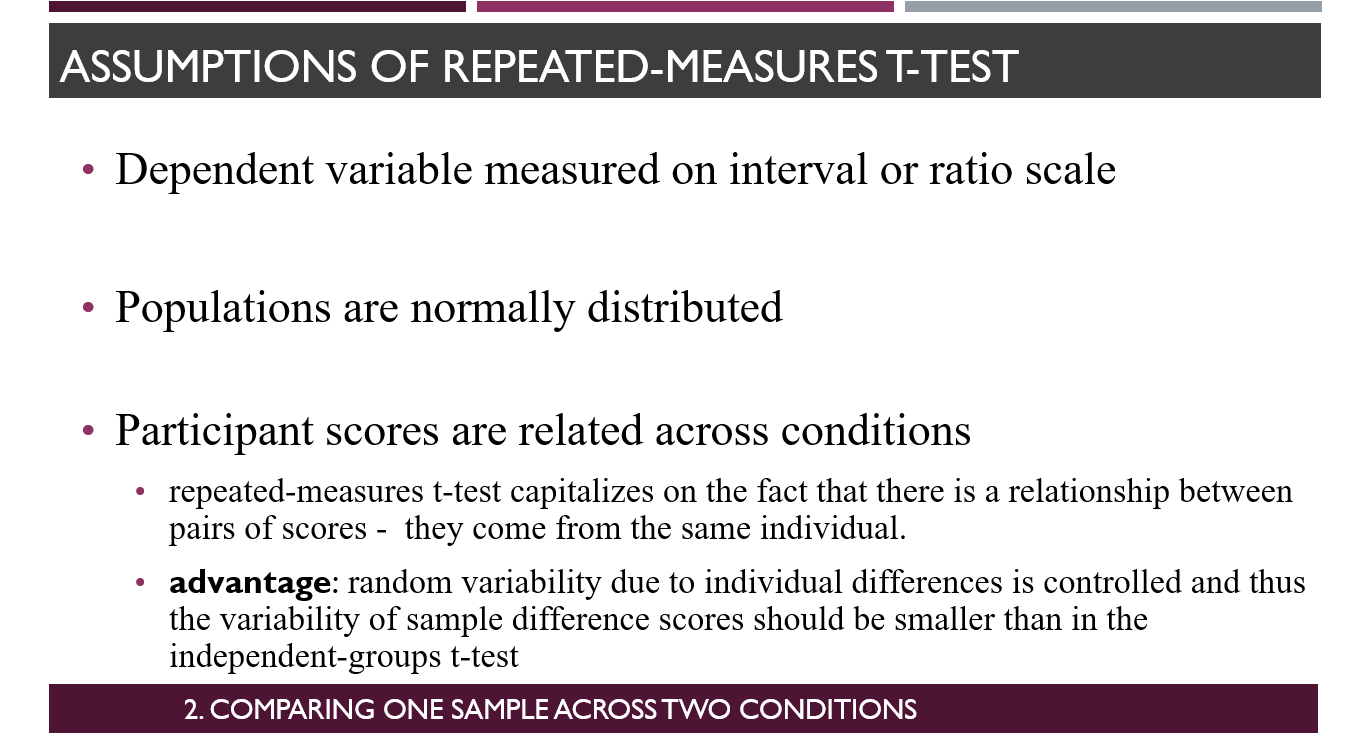
Advantage is that random variability due to individual differences is controlled and thus the variability of sample difference scores should be smaller than in the independent-groups t-test.
\
Advantage is that random variability due to individual differences is controlled and thus the variability of sample difference scores should be smaller than in the independent-groups t-test.
6
New cards
difference scores
Each participant is exposed to two different conditions. (Independent variables).
This means we get two dependent variables for each participant.
When we subtract these two dependent variables we obtain a singular difference score for one participant.
\
In repeated measures design we calculate difference score for each of the participant - this is our data that we analyse.
This means we get two dependent variables for each participant.
When we subtract these two dependent variables we obtain a singular difference score for one participant.
\
In repeated measures design we calculate difference score for each of the participant - this is our data that we analyse.
7
New cards
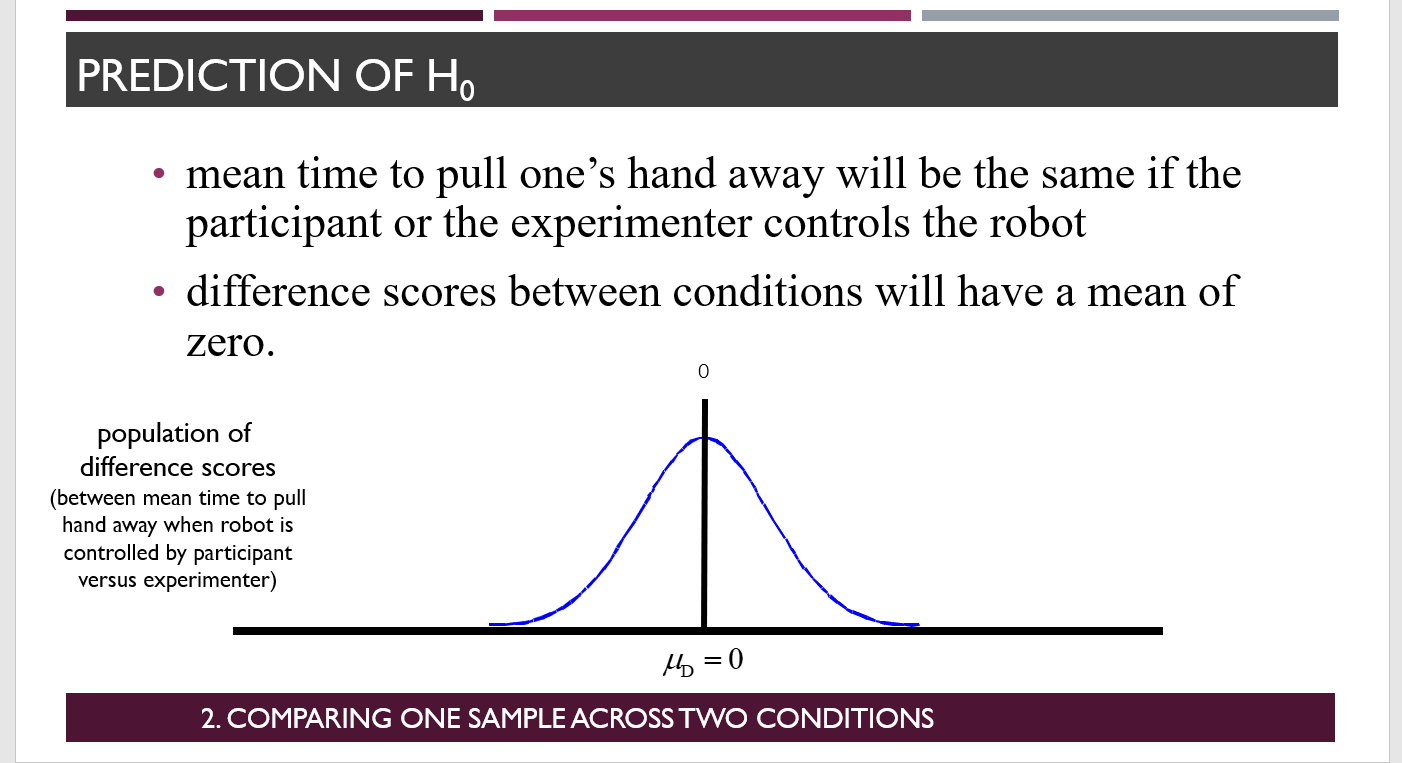
what does null hypothesis states for repeated measures
That the population mean of difference scores is 0.
In other words, the independent variable had no effect, did not influence mean in any way.
\
In other words, the independent variable had no effect, did not influence mean in any way.
\
8
New cards
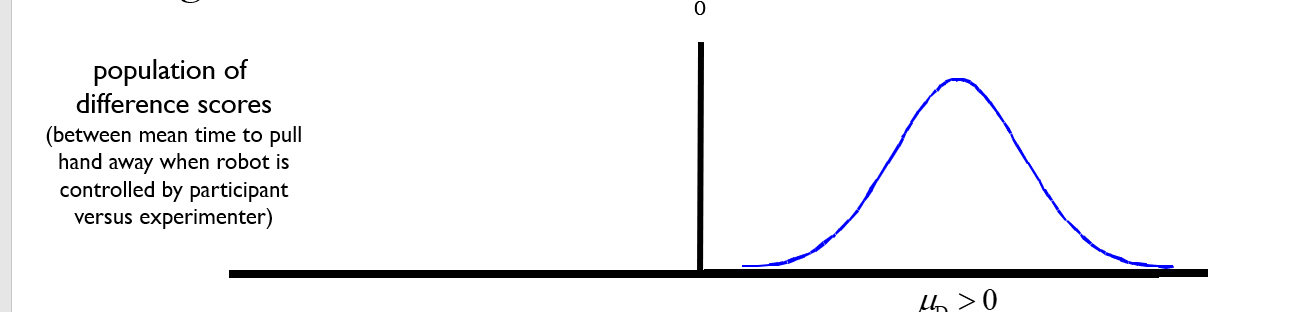
what does alternative hypothesis states for repeated measures
Two hypotheses.
That the population mean of difference scores is above 0 or below 0. (two statements).
\
Example of one of the statements is attached.
That the population mean of difference scores is above 0 or below 0. (two statements).
\
Example of one of the statements is attached.
9
New cards
Assumptions of repeated measures t-test
Dependent variable measured on interval or ratio scale
\
Populations are normally distributed
\
Participant scores are related across conditions
\
Populations are normally distributed
\
Participant scores are related across conditions
10
New cards
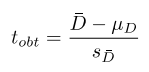
What numbers do we need to calculate a t number using repeated measures - can look at formula sheet
We need ESTIMATED variance/sd of DIFFERENCE SCORES (recall to previous card) - this is one number.
We need sample size to calculate estimated population standard deviation of DIFFERENCE SCORES.
And finally mean in difference scores.
Population mean of difference scores is in the formula but typically it is always 0.
\
Difference scores in the formula sheet is denoted by d.
D bar is mean of difference scores.
11
New cards
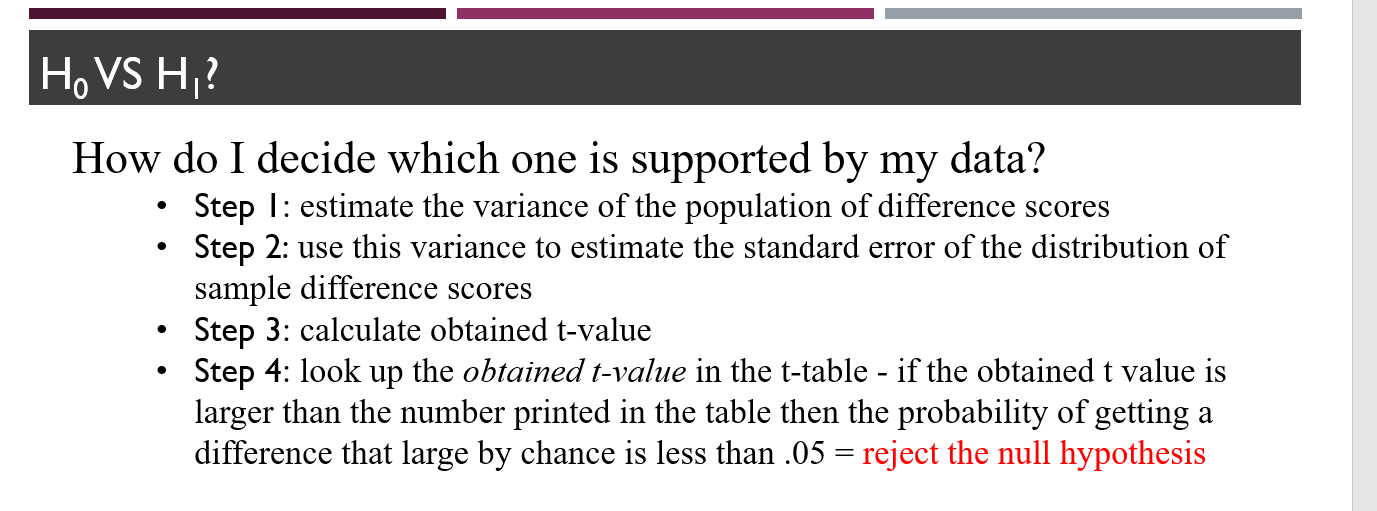
Steps to accomplish repeated measures t-test
1. estimate variance of the population of difference scores.
2. use this variance to estimate the standard error of the distribution of sample difference scores.
3. Calculate obtianed t-value
4. look up the obtained t-value in the t-table - if obtained t value is larger than the number printed in the table then the probability of getting a difference that alrge by chance is less than .05 = reject the hypothesis
12
New cards
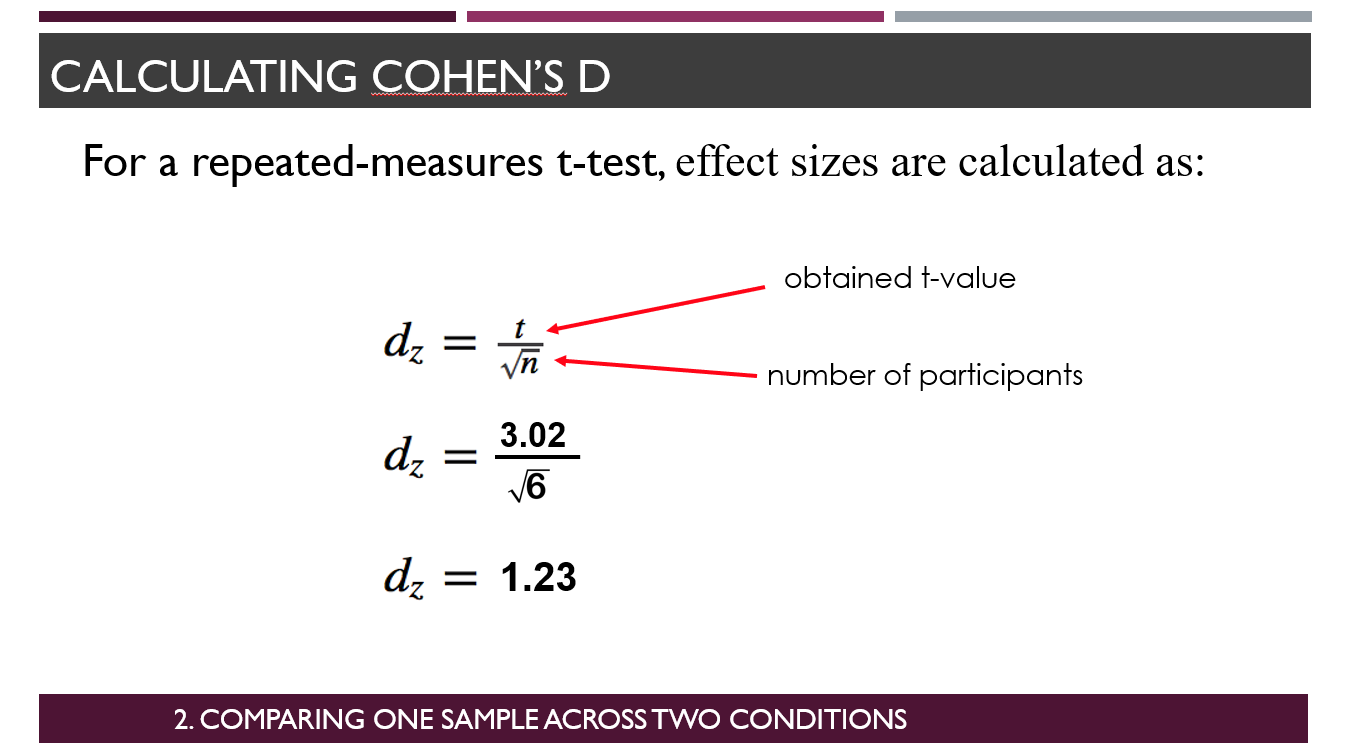
How to calculate cohen’s D for repeated measures
Follows same guidelines as well for interpreting cohen’s d as between subjects
13
New cards
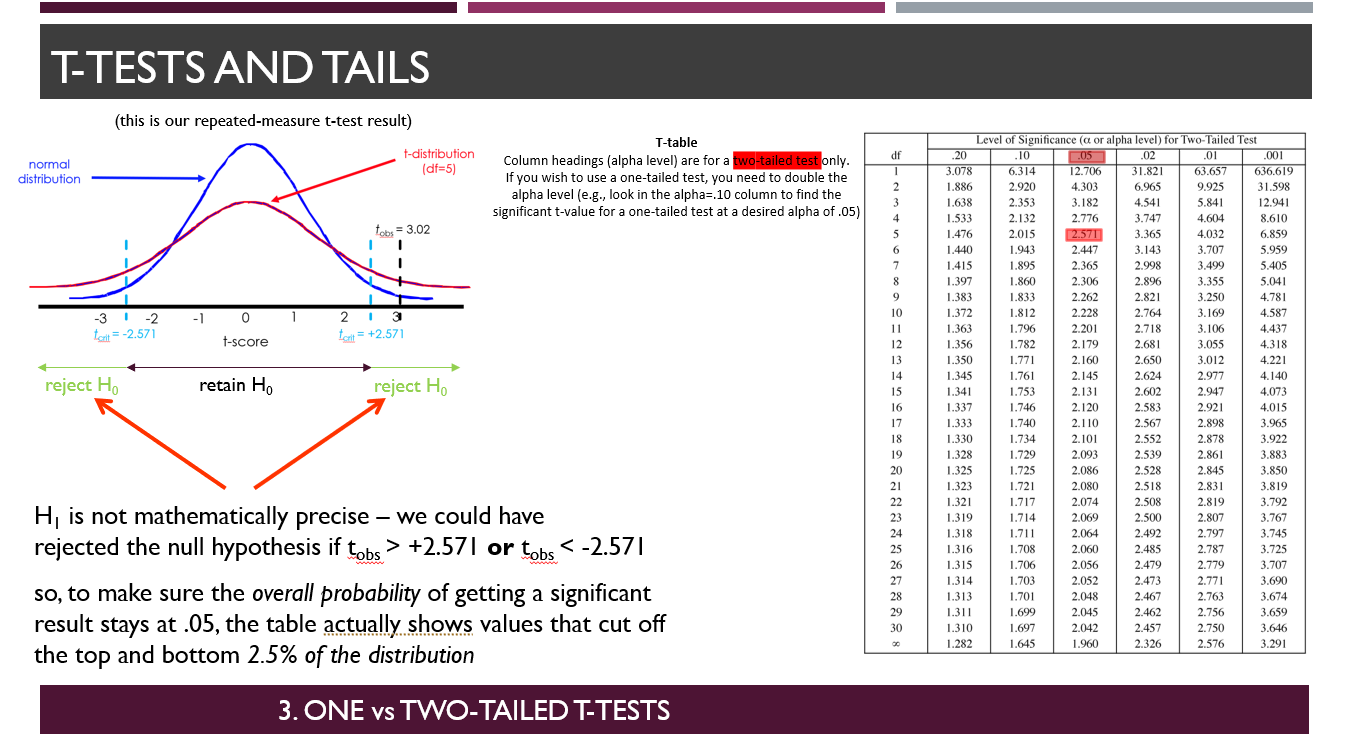
t-tests and tails - when do we use one tailed or two tailed tests.
We use a two-tailed test when we can’t predict which group (between subjects design) or experiment condition (repeateed measures design) will have a larger mean.
In other words, if you can remember the previous t-test graphs we used, they had boundaries on both sides of the graph.
\
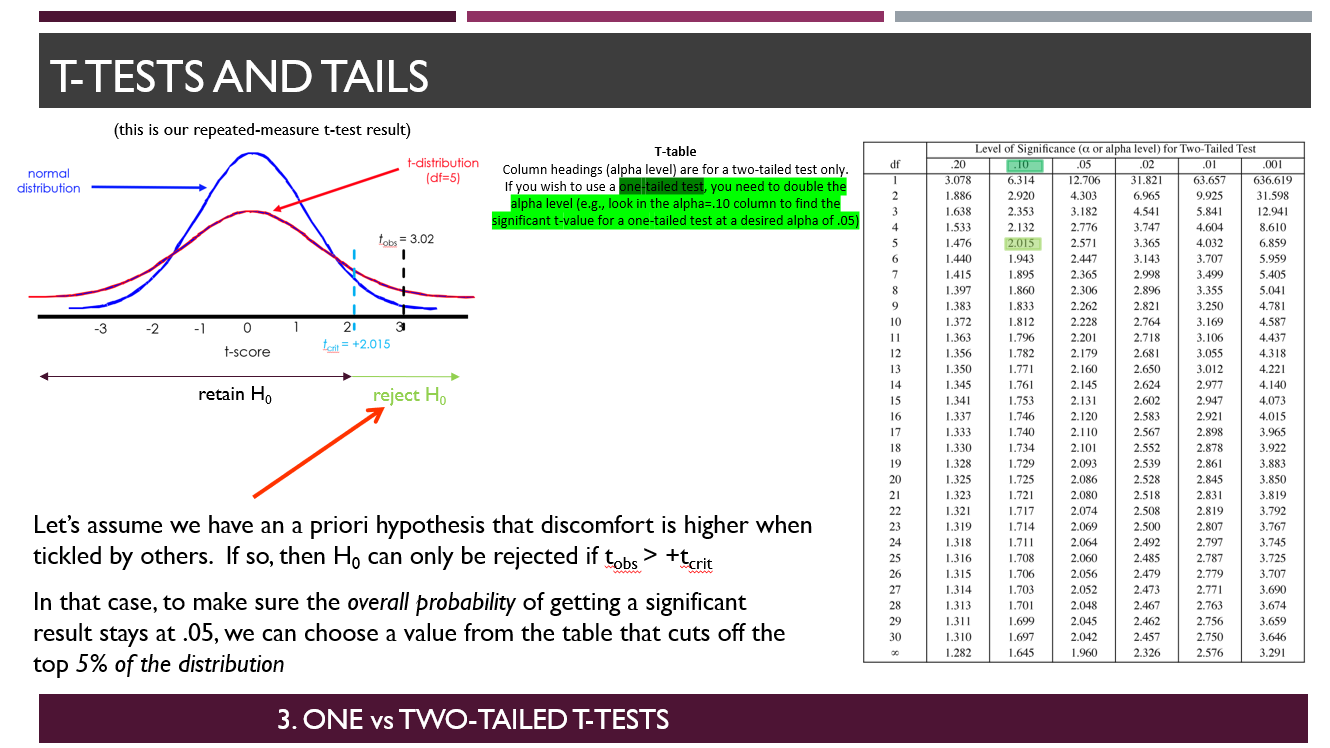
We use a one-tailed test when we do know this (based on a priori hypothesis or theory).
Priori hypothesis refers to use intuitively guessing which one is higher than the other.
\
One-tailed tests require a lower t-statistic (which means easier to obtain as a researcher) given that you can correctly guess which sample mean is higher.
\
In other words, if you can remember the previous t-test graphs we used, they had boundaries on both sides of the graph.
\
We use a one-tailed test when we do know this (based on a priori hypothesis or theory).
Priori hypothesis refers to use intuitively guessing which one is higher than the other.
\
One-tailed tests require a lower t-statistic (which means easier to obtain as a researcher) given that you can correctly guess which sample mean is higher.
\
14
New cards
How to use two tailed test - (This is basically the same thing we have been doing the whole time in t-tests, im not asking for anything new). Refer to t-table
Note, no need to remember but to understand, read the attached image. Look at graph and t-table heading.
15
New cards
How to do a one-tailed t-test - this is new concept.
If you wanna test at significance level 0.05 and do a one tailed test, you double the number and look at the t-table.
16
New cards
Confidence intervals - this is another way of testing representativeness of sample to population (we’ve been using rejection of null hypothesis route the whole time).
We tested null hypothesis by asking:
what probability that a sample difference came from a population of difference scores with a mean of zero (alpha = 0.05)
\
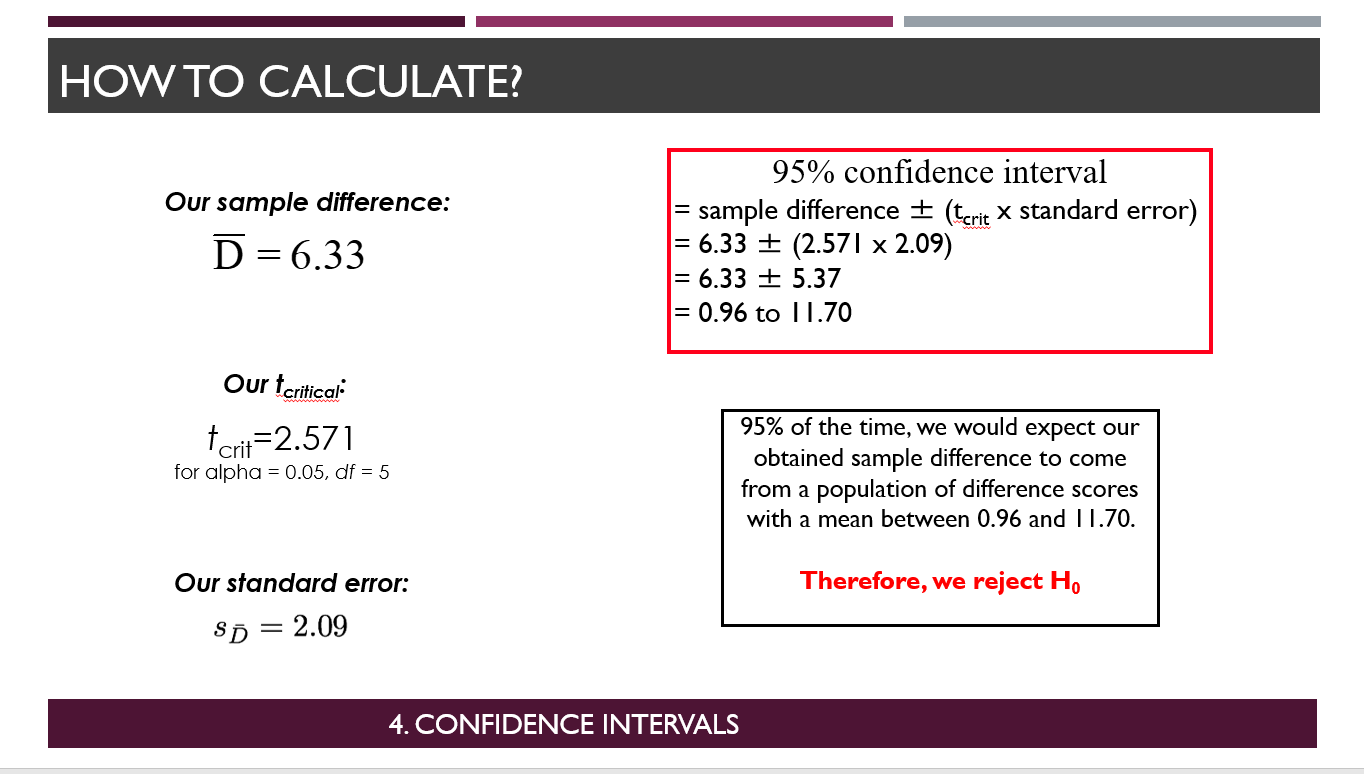
An equivalent approach would be:
to estimate the range of population difference scores that yield a sample difference of 6.33 95% of the time.
If this range (confidence interval) doesnt include zero, then there is a 95% probability that our sample difference did not come from a population of difference scores with a mean of zero (assumed by null hypothesis)
what probability that a sample difference came from a population of difference scores with a mean of zero (alpha = 0.05)
\
An equivalent approach would be:
to estimate the range of population difference scores that yield a sample difference of 6.33 95% of the time.
If this range (confidence interval) doesnt include zero, then there is a 95% probability that our sample difference did not come from a population of difference scores with a mean of zero (assumed by null hypothesis)
17
New cards
How to calculate confidence interval? - can look at formula sheet
need sample difference.
Need critical t value (0.05 level with df) - obtain from t-table formula sheet.
Need standard error - calculate using formula sheet.
\
Above case holds for repeated measures.
Need critical t value (0.05 level with df) - obtain from t-table formula sheet.
Need standard error - calculate using formula sheet.
\
Above case holds for repeated measures.