2. Descriptive Statistics
1/21
There's no tags or description
Looks like no tags are added yet.
Name | Mastery | Learn | Test | Matching | Spaced | Call with Kai | Chat |
|---|
No analytics yet
Send a link to your students to track their progress
22 Terms
Categorical variables
Measured in groups/ categories (nominal & ordinal)
Continuous variables
Measured on a continuous scale (interval & ratio)
Nominal
Values used to represent categories, but with no order
Ordinal
Values have an order/ hierarchy
Interval
Equal difference in value = equal difference in property, but 0 does not indicate abscence of property
Ratio
Equal difference in value = equal difference in property, but there is an absolute 0
Bar chart
Representation for nominal data (uses mode, frequencies, percentages)
Absolute frequency
Number of times a value is observed
Relative frequency (percentage)
Number of times a value is observed, relative to total number
Cumulative frequency
Add relative frequencies of a group to percentages of prev group
Mode
The value that occurs the most in categ. data
Histogram
Representation for interval/ratio data (uses mean, spread, standard deviation)
Spread
How much data values differ from each other and how much they differ from the measure of center
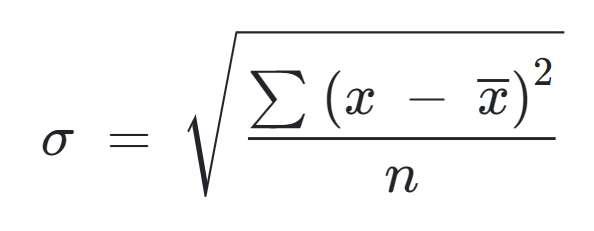
Standard deviation (sigma)
Measure of spread around the mean (square root of variance)
Standard deviation formula
Square root of (Sum of Squares devided by n)
Box plot
Representation for interval/ratio data (uses median, range, quartiles, IQR)
Median
The middle value when ordering values
Range
Maximum value - minimum value
Quartiles
Order values, find median (Q2), find medians of those halves (Q1, Q3)
Interquartile range (IQR)
Middle 50% of data, between Q1 and Q3
Scatterplot
Representation for interval/ratio data (useful for correlation coefficient)
Pearson’s r
Correlation coefficient, showing how closely points on scatterplot resemble a straight line