3 M-Mode & Echo Doppler
1/27
There's no tags or description
Looks like no tags are added yet.
Name | Mastery | Learn | Test | Matching | Spaced | Call with Kai |
|---|
No analytics yet
Send a link to your students to track their progress
28 Terms
m-mode echocardiography
fast (1800 frames/sec)
ID moving structures (valves)
accurate & reproducible
may skew measurement bc nonperpendicular orientation
timing of rapid cardiac motion (valves)
precise measurements (chambers)
prove what is seen on 2D
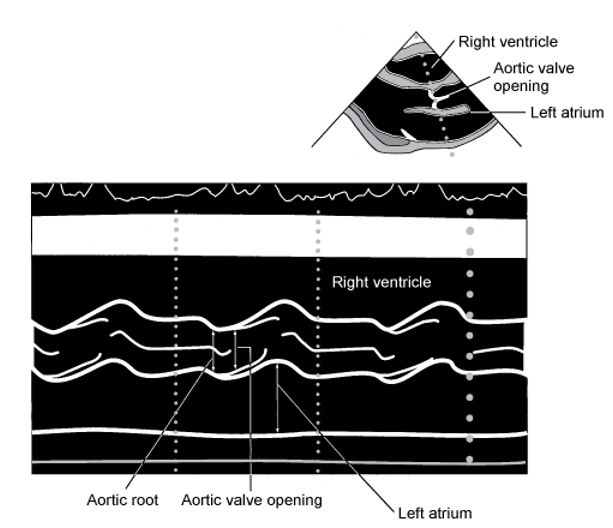
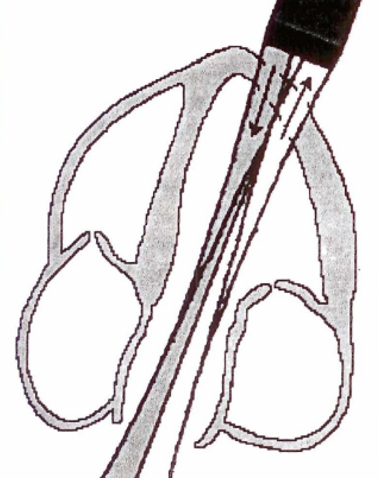
m-mode echo ex.
measure distance [dots] / time
![<p>measure distance [dots] / time</p>](https://knowt-user-attachments.s3.amazonaws.com/6d831e53-41f4-4ebd-8168-86d474838381.png)
AV & LA
PLAX
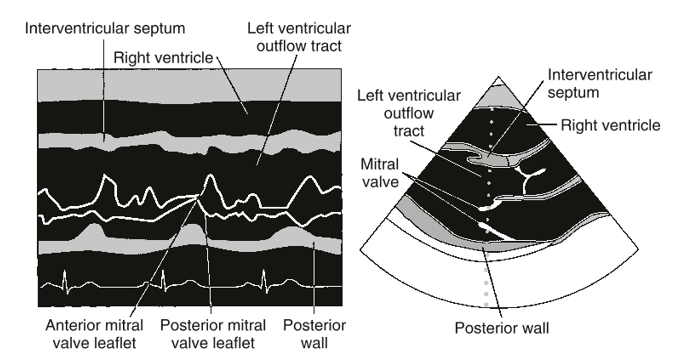
MV
PLAX or PSAX
SV
stroke volume
SV=EDV-ESV
echo doppler
uses hemodynamics (blood moving thru vessels)
SV
CO
intracardiac P
P gradient
vascular resistance
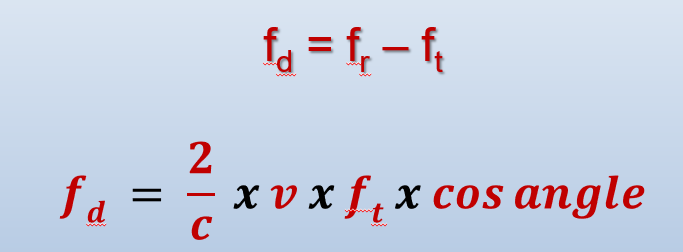
doppler equation
determine V based on doppler shift
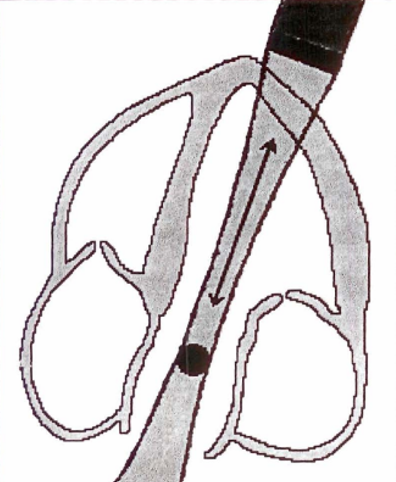
doppler angle MUST be parallel to flow
c: propagation speed
bernoulli equation
in stenosis…↑V & ↓P

invert??
do NOT invert color doppler
do NOT invert baseline
PW doppler
single crystal sent & received
time gating device (sample volume) selects depth where returning signal originated
sample volume is parallel to direction of flow
CW doppler
two crystals…1 emits & 1 receives
allows for max V measurement
NO depth; records all shifts along beam
audio signals & spectral doppler
best doppler when beam is parallel to flow
V of flow determines pitch/frequency of audio
↑V=↑ pitch (hiss/whistle)
↓V=↓ pitch
normal flow:
narrow V range & smooth, even audio
disturbed flow (distal to stenosis):
harsh tone
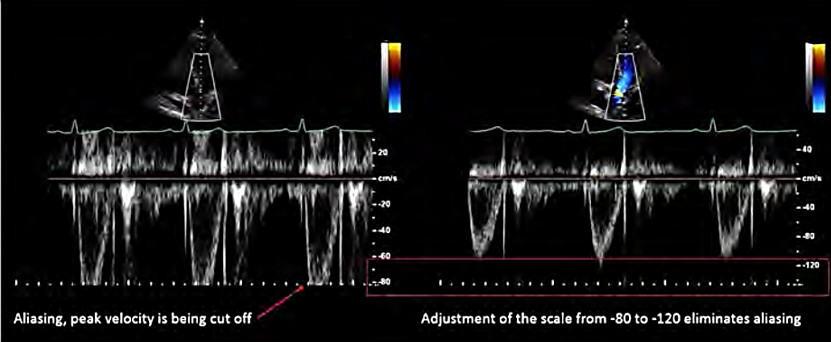
V scale
range of V displayed
maximize waveform w/out aliasing
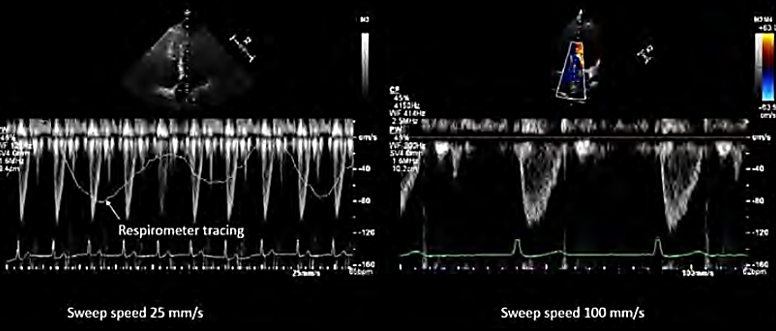
sweep speed
# of cardiac cycles shown
(100mm/sec)
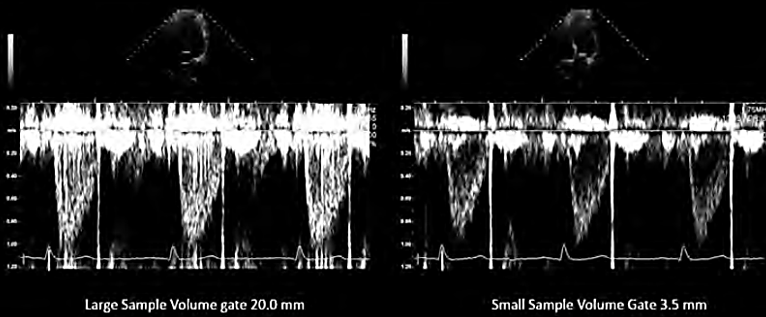
sample volume size
width of sample volume (gate width)
receive adequate signals & reduce noise
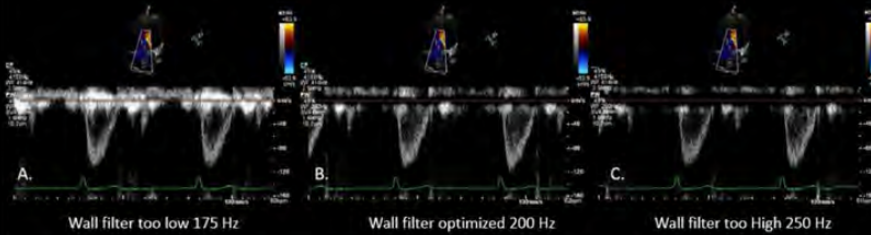
wall filter
eliminate low V signals near baseline
remove unwanted noise w/out erasing flow info
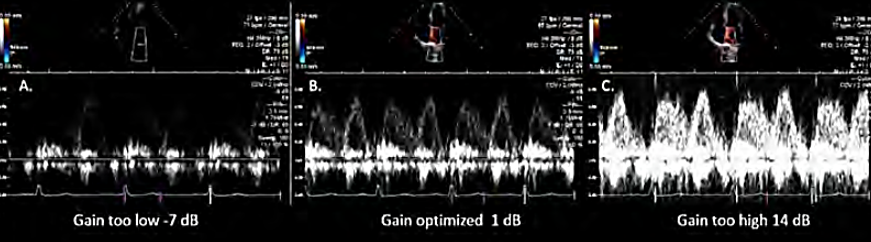
spectral doppler gain
amplifies doppler signals
to help measure accurately
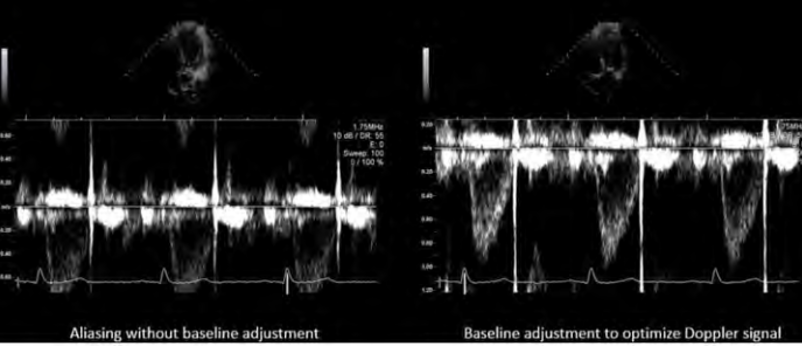
baseline
show as large as possible
eliminate aliasing
NO invert
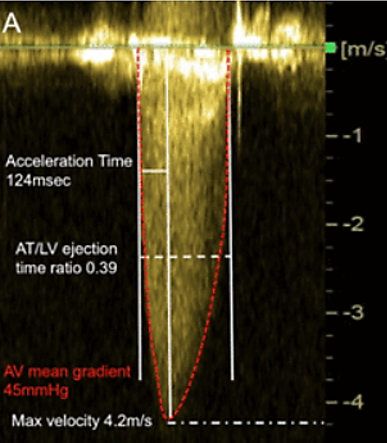
peak V & P gradient
caliper to measure peak V
P gradient using peak V (△P=4V2)

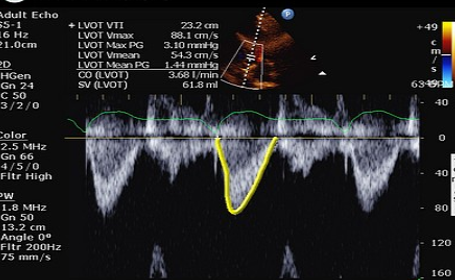
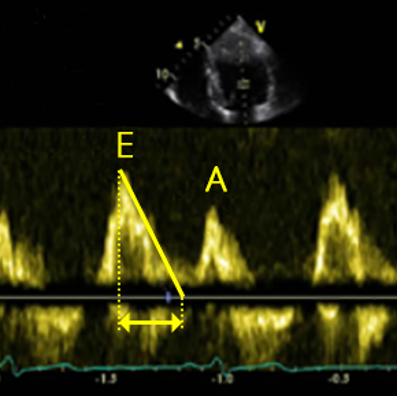
velocity time integral (VTI)
distance traveled by blood cells in one cardiac cycle
used to calculate SV, CO, AO valve area
trace flow profile
VTI, peak V, mean V, peak P gradient, mean P gradient
acceleration time
time from flow onset to peak V
deceleration time
time from flow peak to end of flow
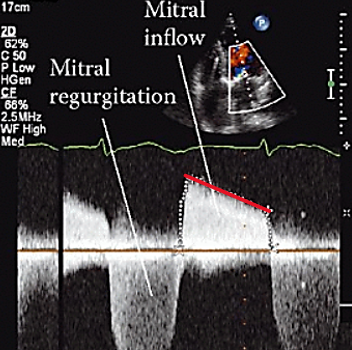
pressure half time
time it takes for peak P to drop to half og P
stenosis or regurgitation
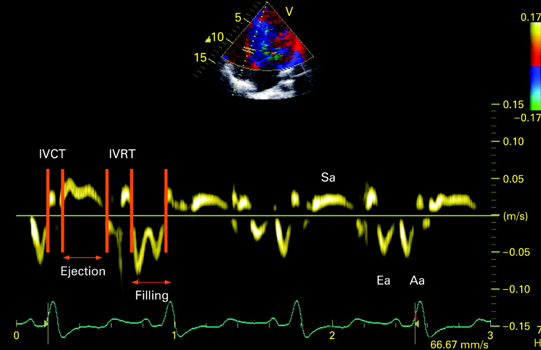
TDI
time doppler imaging
to measure V of moving tissue (myocardium)
color doppler
color M-mode
PW spectral doppler
spectral TDI
place sample box anywhere on myocardium
shows phases of cardiac cycle & tissue V
E: LV rapid filling
A: “atrial kick” late filling
E’ or A’ (prime): mirror image of LV inflow
color TDI
ensures all wall segments are moving in correct location & at same V
may identify wall motion abnormalities
m-mode TDI
shows differences in:
wall movement direction
thickening
V
TDI application & limitations
application: diastolic dysfunction
PW TDI to asses LV diastolic function
limitations: myocardial tethering
unable to tell btwn myocardial contraction & passive myocardial motion from near structures
& angle dependent
must be parallel to myocardial motion direction