AP Econ Unit 1
1/29
There's no tags or description
Looks like no tags are added yet.
Name | Mastery | Learn | Test | Matching | Spaced |
|---|
No study sessions yet.
30 Terms
Define scarcity
the limited nature of society's resources
what are sources of production?
land, labor, capital, entrepreneurship
Define capital goods
created for indirect consumption (ex. oven)
Define human capital
the skills and knowledge of workers through experience
what is the difference between trade-offs and opportunity cost?
trade-off = alternatives given up when a decision is made
opportunity cost = most desirable alternative that is given up
how does the PPC illustrate the ideas of scarcity and trade-offs?
PPC shows the alternate ways an economy can use its scarce resources
Why might producing two similar products result in a constant opportunity cost?
resources are easily adaptable
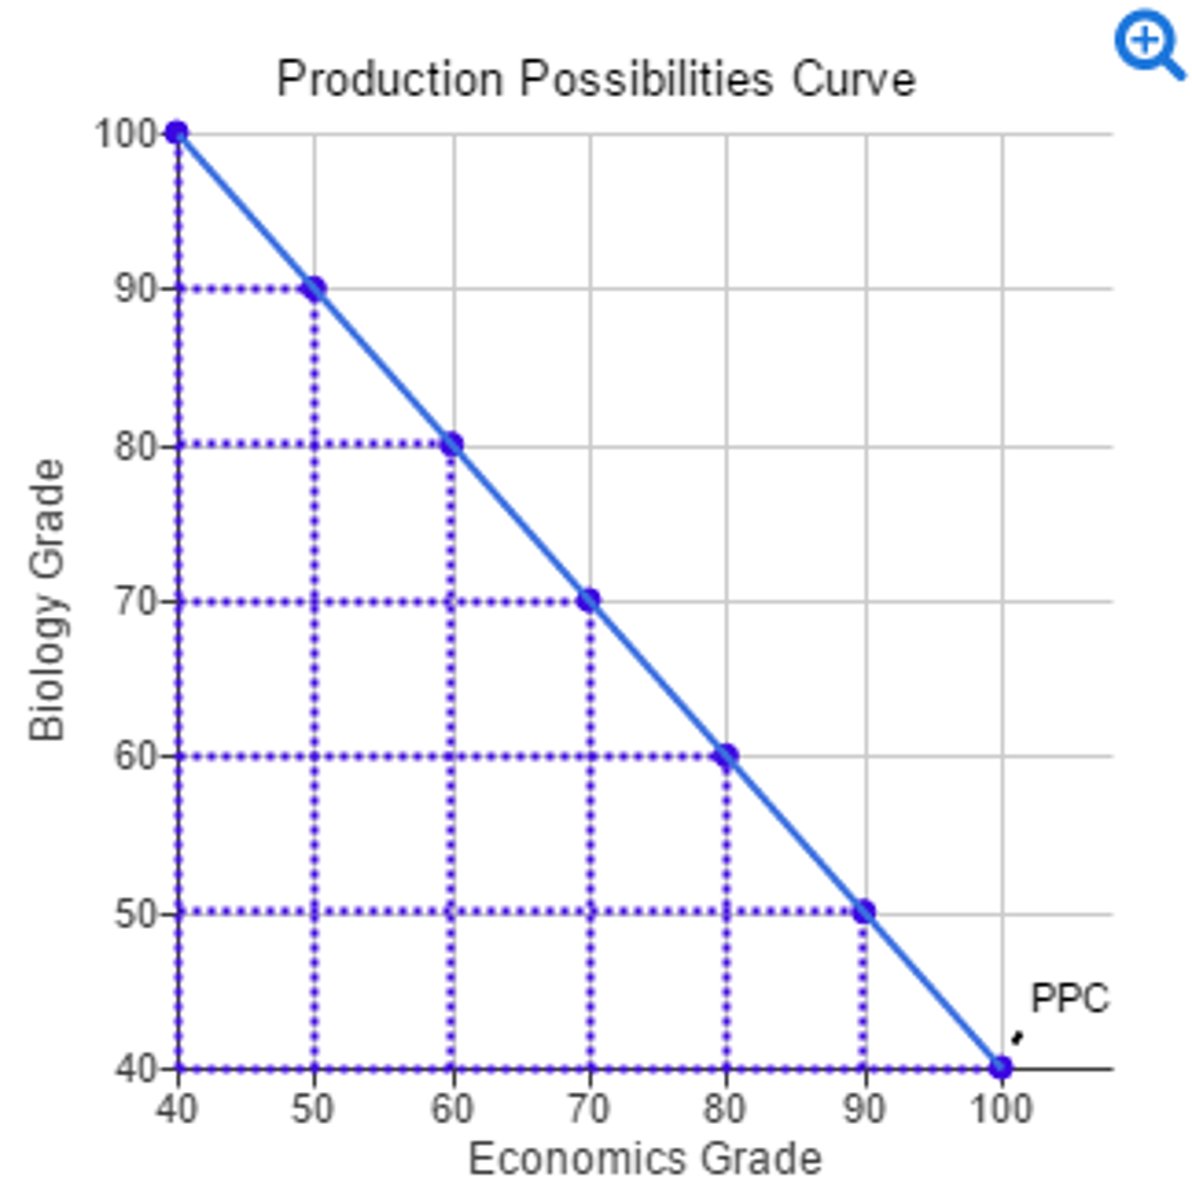
draw a PPC with constant opportunity cost
straight line
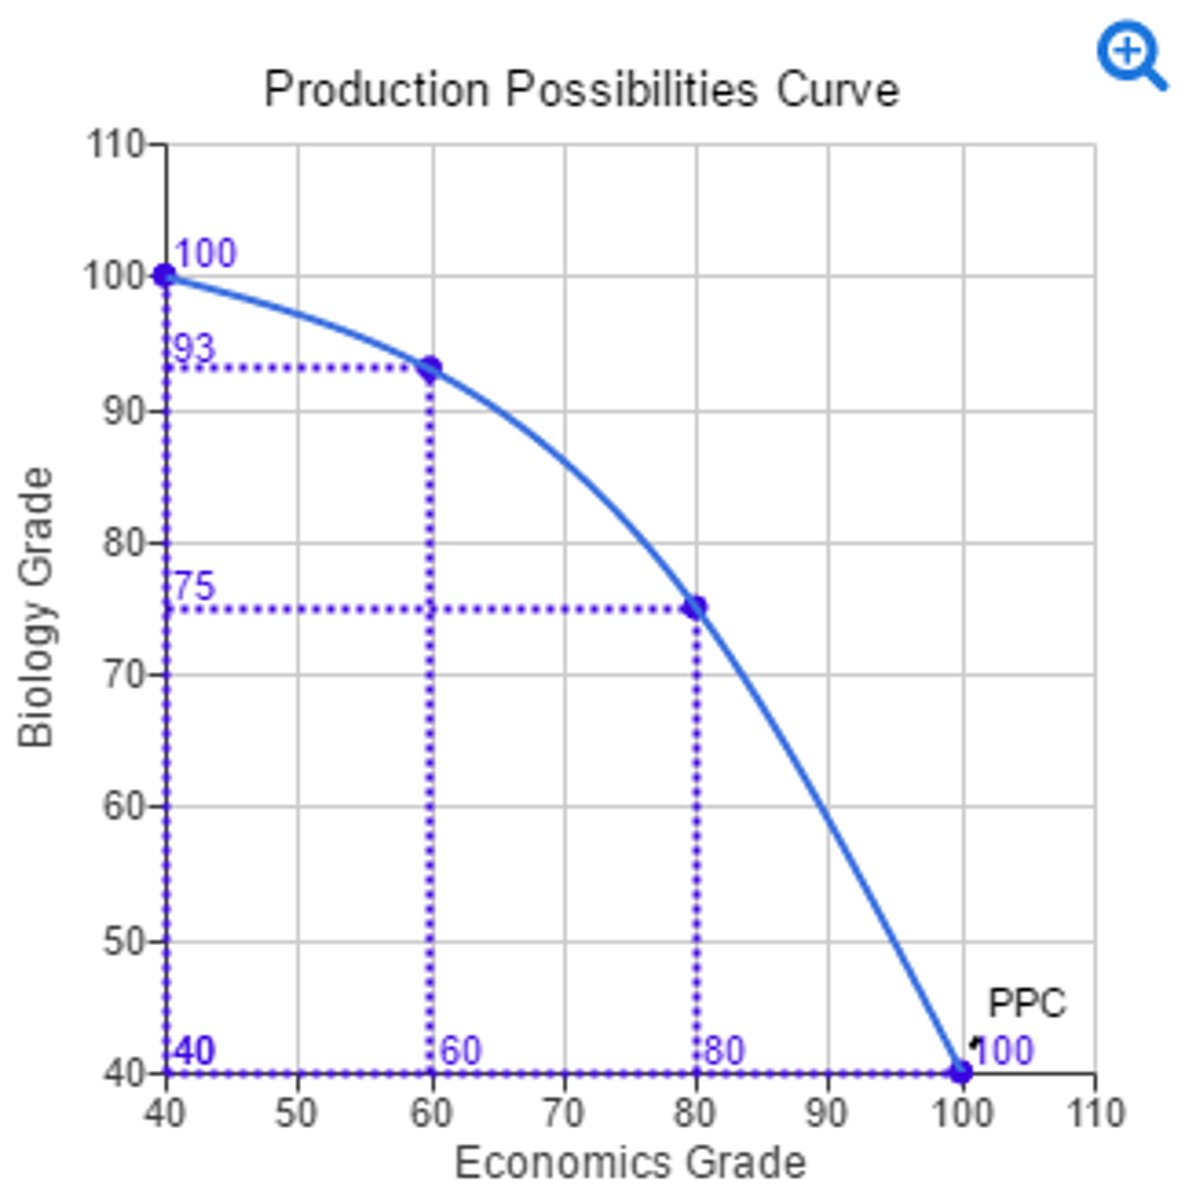
why might producing two different products result in an increasing opportunity cost?
Resources are not easily adaptable
draw a PPC with increasing opportunity cost
curved line
Shifters of the production possibilities curve (PPC)
1. resource quantity/quality
2. technology
3. trade
How does the PPC change when workers lose their jobs due to a recession
(Point B = equilibrium) Point D
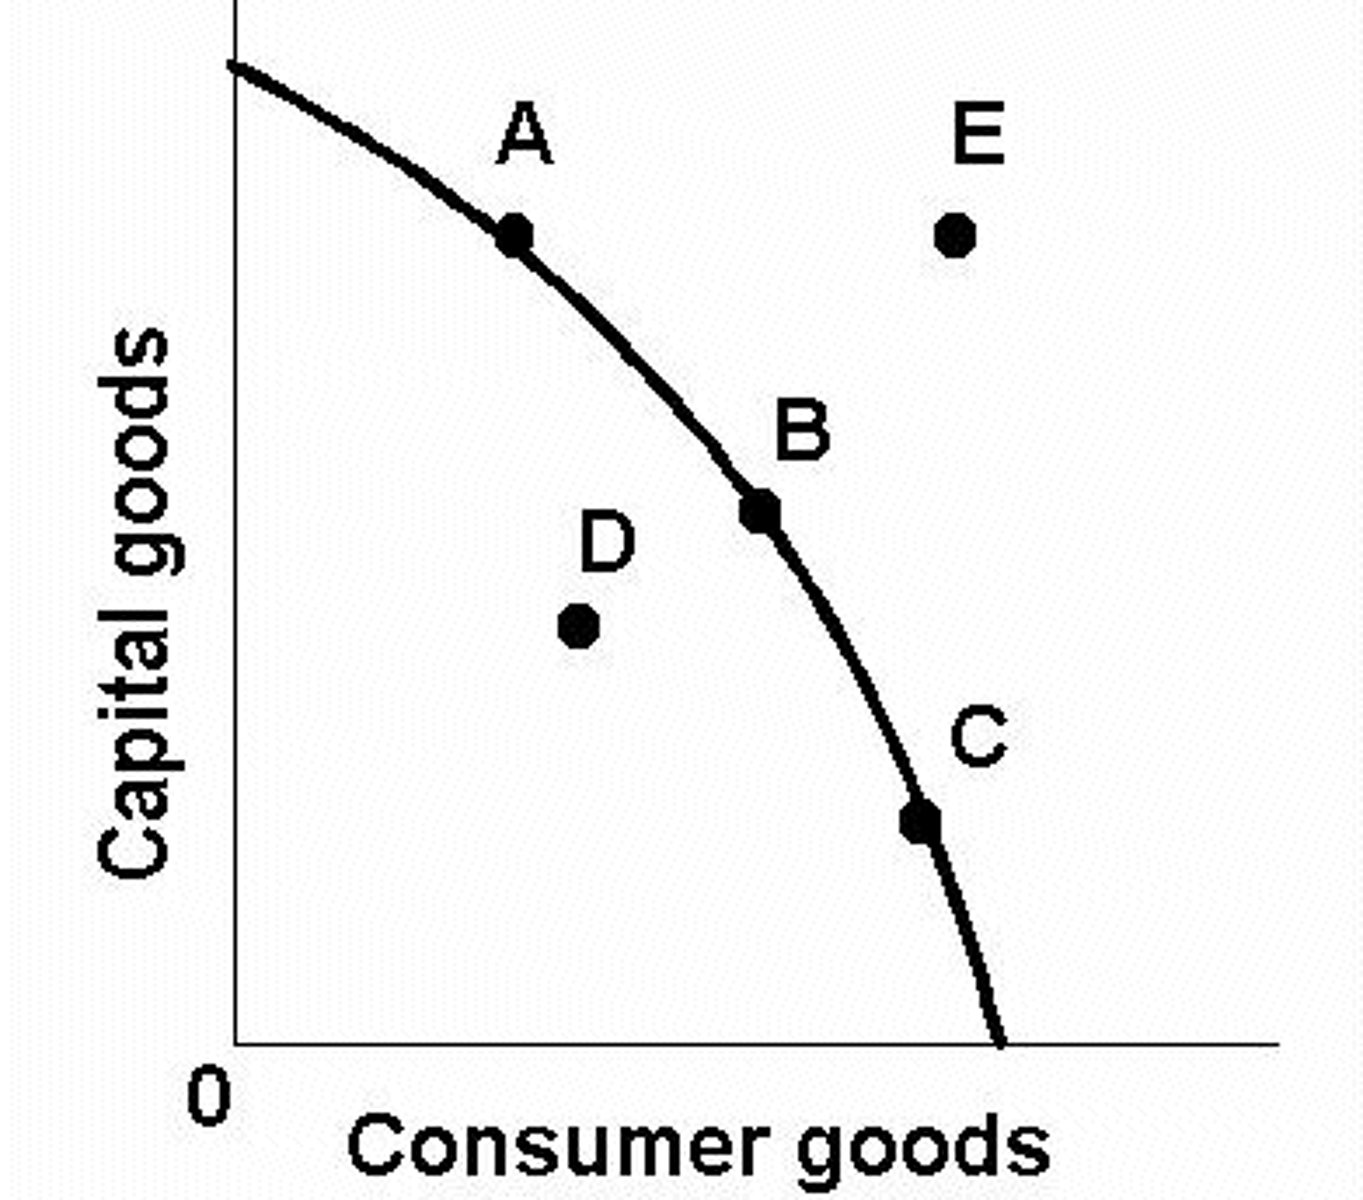
How does the PPC change when there's an increase in consumer demand for pizza
(Point B = equilibrium) Point A

How does the PPC change when there are more resources to produce cars
curve shifts to the right on the x-axis
(amount) OOO = Output: Other goes Over
Sugar (first number) / Cars (second number)
Cuba: 40 (1S = 1/4C) / 10 (1C = 4S)
Mexico: 50 (1S = 2C) / 100 (1C = 1/2S)
----------------
1.) Which country has an absolute advantage in sugar? How about cars?
2.) What is Cuba's opportunity cost for producing one car?
3.) Which country has a comparative advantage in cars? How about sugar?
4.) For both countries to benefit, how much sugar can be traded for each car? 1 car for ___________ sugar
1.) Mexico for both
2.) 4 tons of sugar
3.) Mexico, Cuba
4.) 2.75 (any number between 1/2 and 4)
(time) IOU = Input: Other goes Under
Sausage (first number) / Computers (second number)
Canada: 2 (1S = 1/3C) / 6 (1C = 3S)
UK: 10 (1S = 1C) / 10 (1C = 1S)
----------------
1.) Which country has an absolute advantage in sausage? How about computers?
2.) What is Canada's opportunity cost for producing one computer?
3.) Which country has a comparative advantage in computers? How about sausages?
4.) For both countries to benefit, how much sausages can be traded for each computer? 1 computer for ___________ sausage
1.) Canada for both
2.) 3 sausages
3.) UK, Canada
4.) 2 (anywhere between 1 and 3)
What is the law of demand?
inverse relationship between price and quantity demanded
Why is the market demand curve downward sloping?
bc the relationship between PL and Qd is inverse
What are the five shifters of demand?
1. Taste and preferences
2. Number of consumers
3. Price of related goods
4. Income
5. Future expectations
What is the law of supply?
direct relationship between price and quantity supplied
Why is the Market Supply Curve upward sloped?
bc at an increased PL, businesses will produce more
What are the five shifters of supply?
1. Price of resources
2. Number of producers
3. Technology
4. Gov actions: taxes and subsidies
5. Expectations
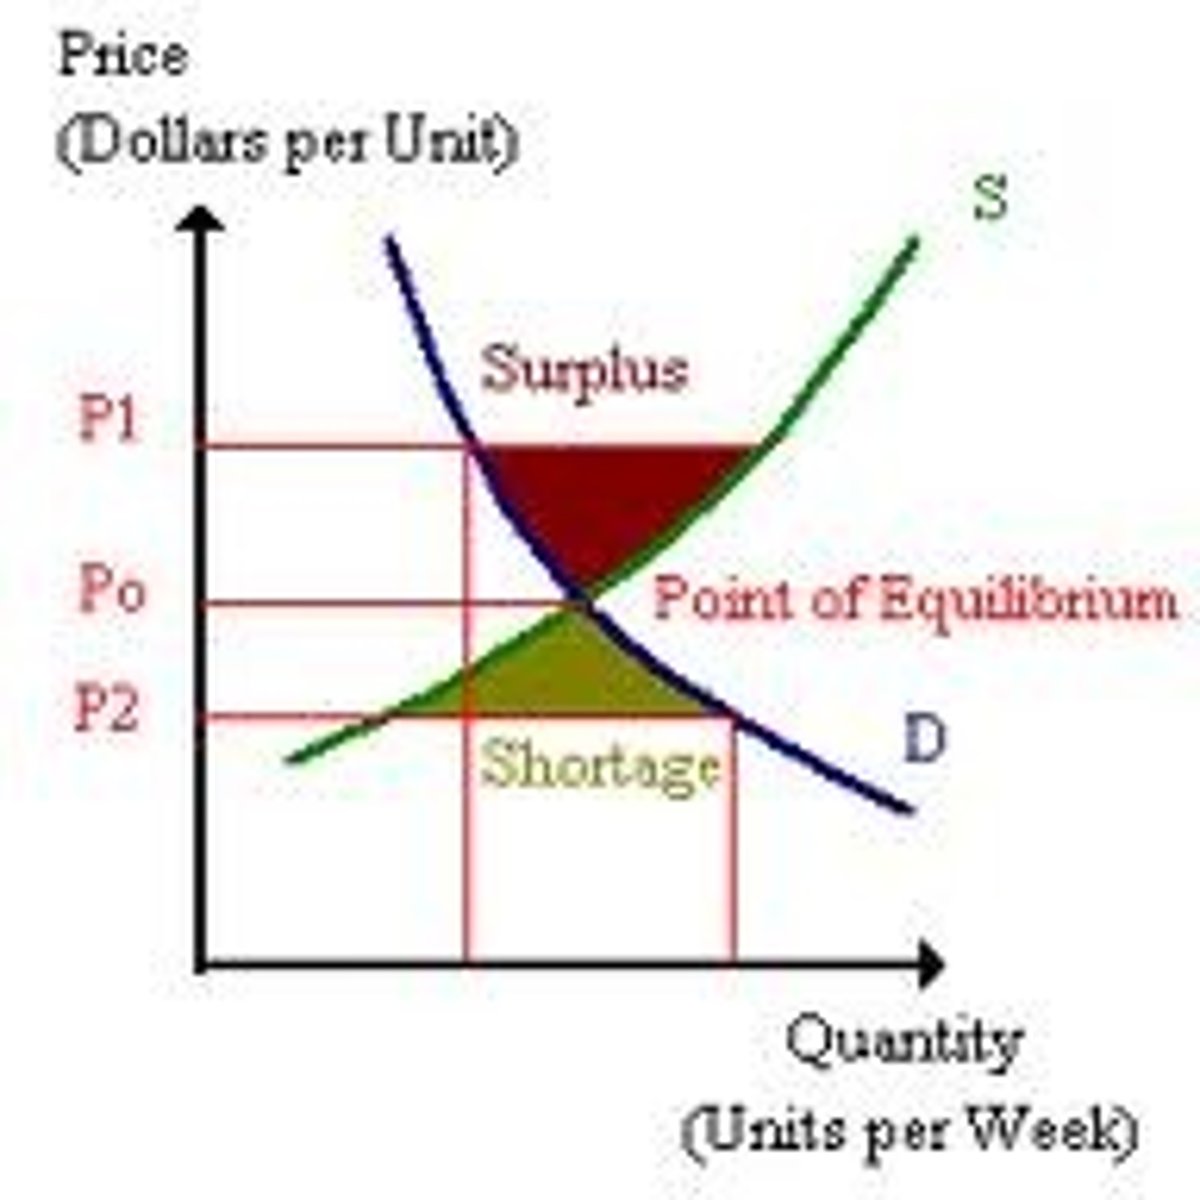
Draw a shortage & surplus
check pic
Draw a demand decrease
Price: decrease
Quantity: decrease
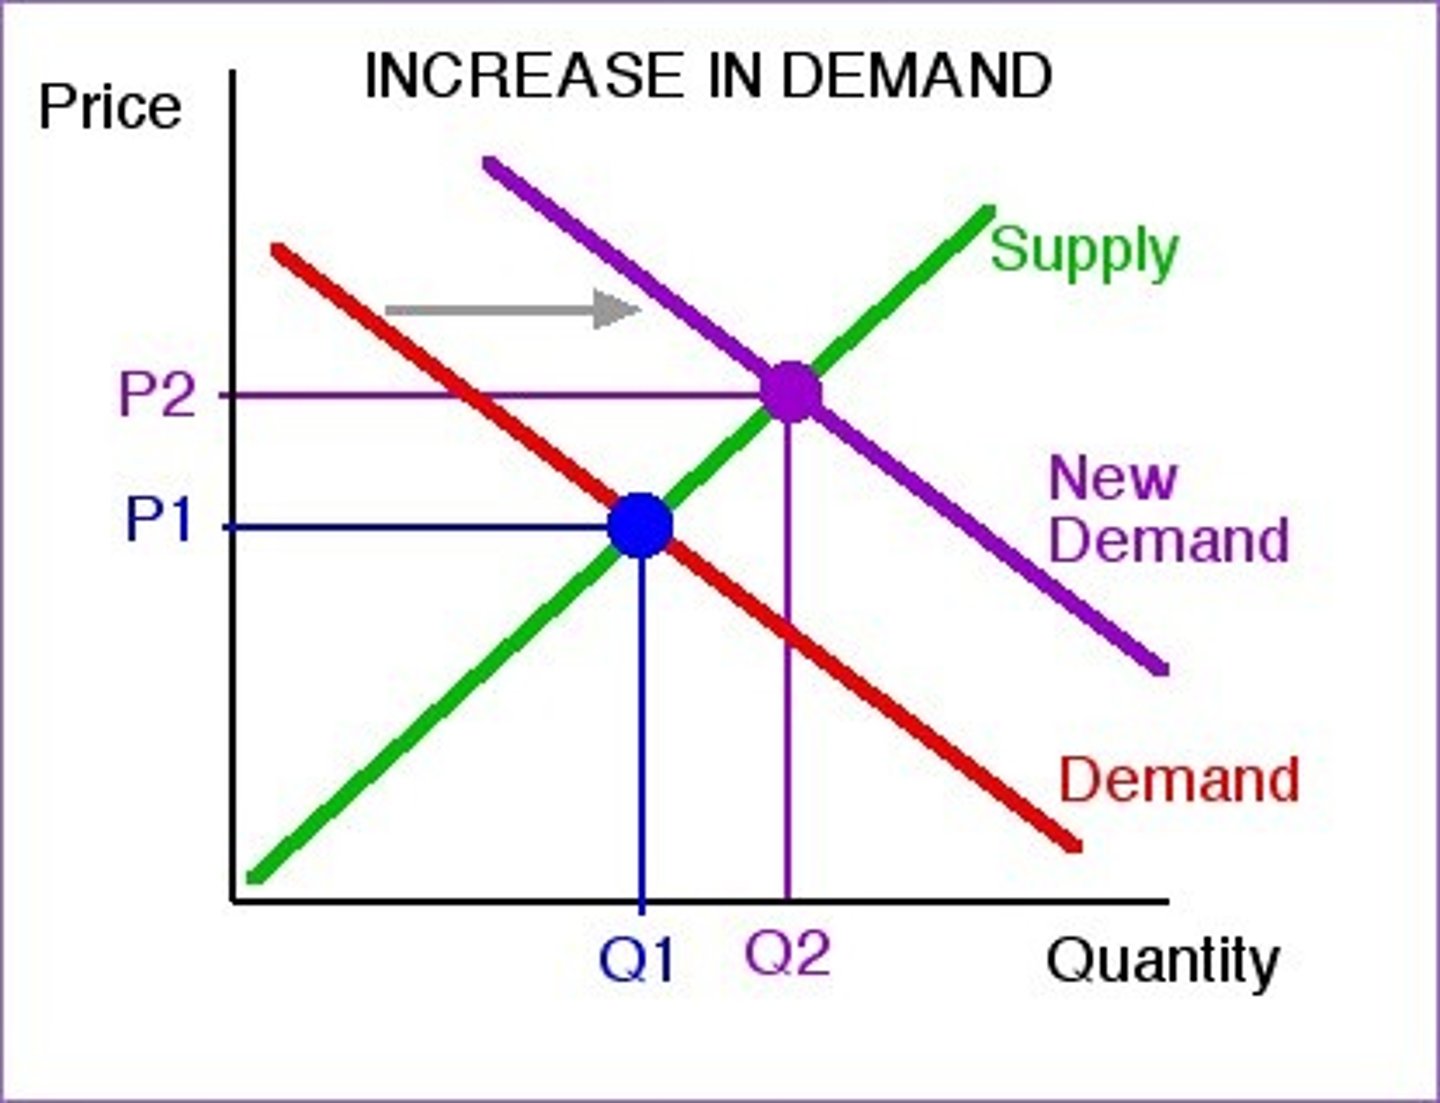
Draw a demand increase
Price: increase
Quantity: increase
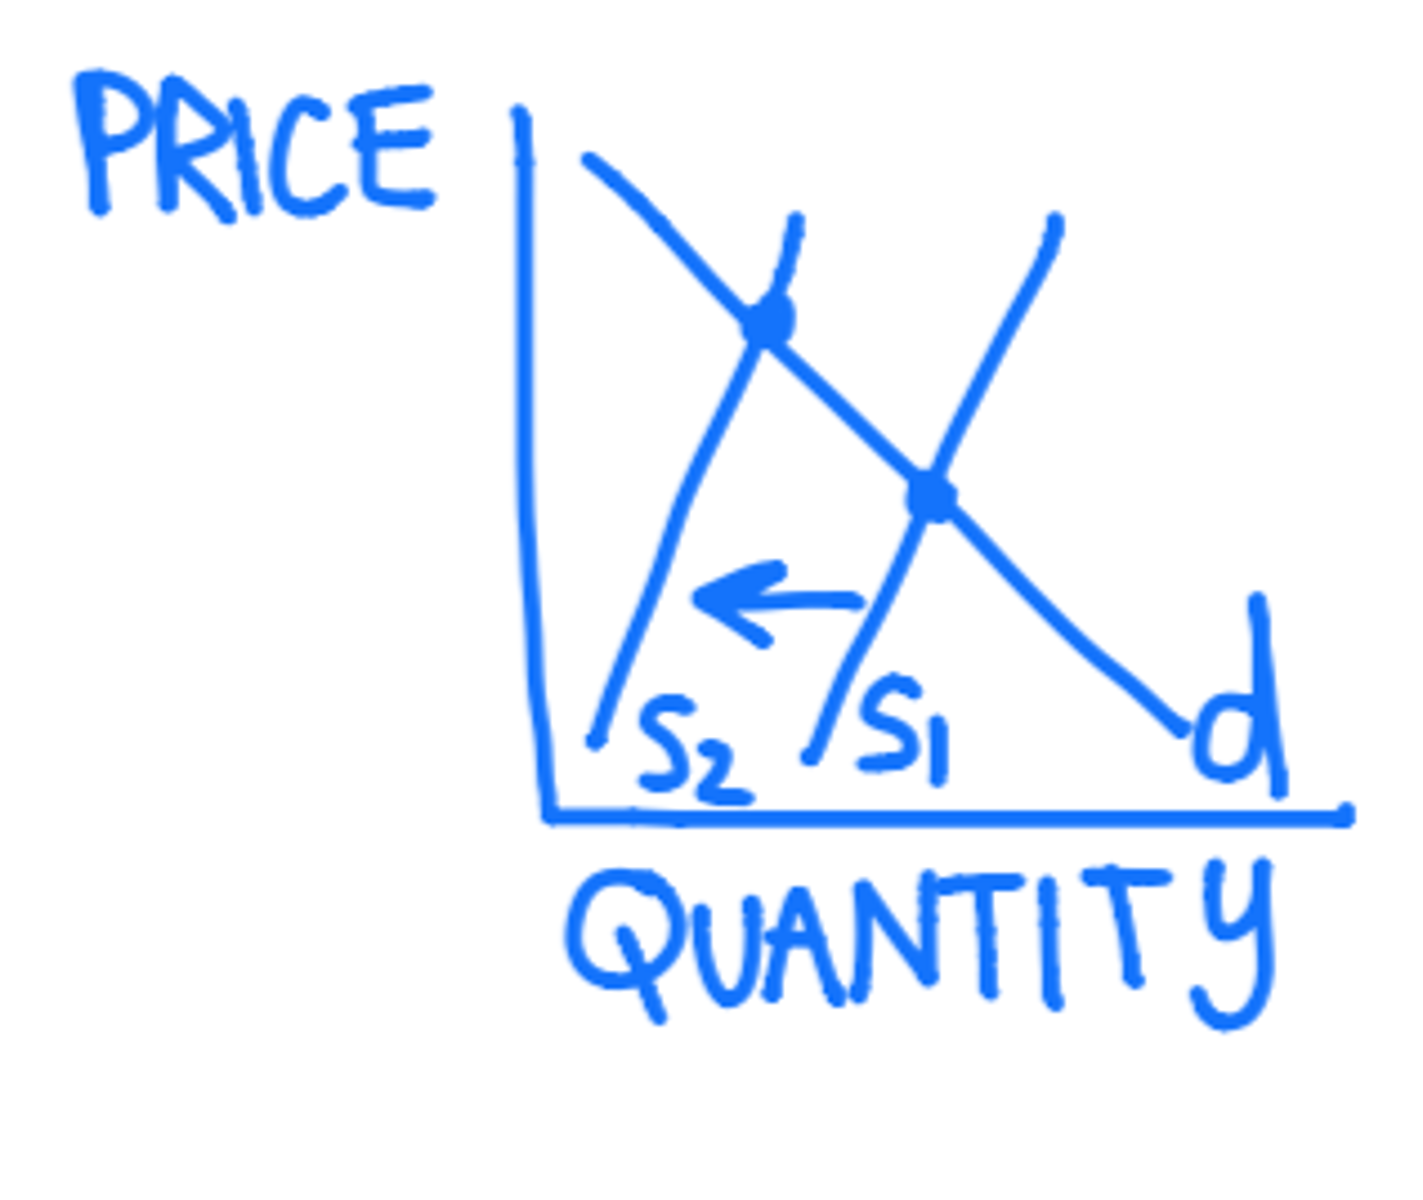
Draw a supply decrease
Price: increase
Quantity: decrease
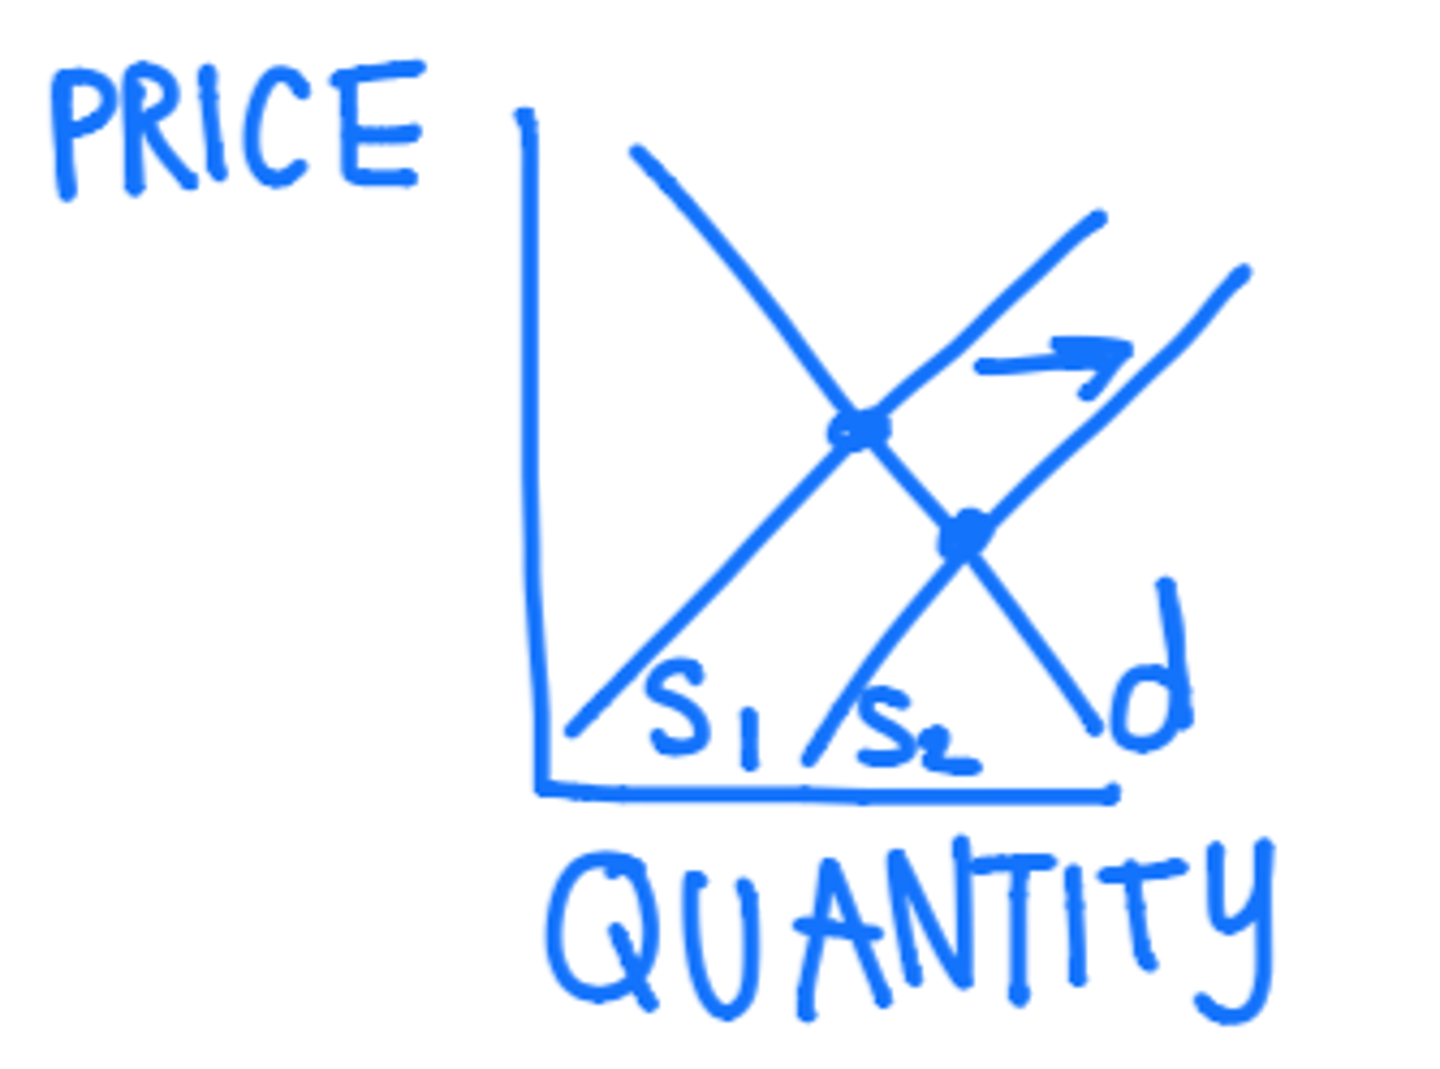
draw a supply increase
Price: decrease
Quantity: increase
what is the double-shift rule?
when 2 curves shift at the same time; either price or quantity will be indeterminable
What happens to the equilibrium price and quantity when there is an increase in demand and an increase in supply
Price: stays the same
Quantity: increase
what is the difference between a change in demand and a change in quantity demanded?
Change in demand = entire demand curve shifts
Change in Qd = movement along the demand curve