IB Microeconomics - conceptual
1/109
There's no tags or description
Looks like no tags are added yet.
Name | Mastery | Learn | Test | Matching | Spaced |
|---|
No study sessions yet.
110 Terms
The Factors of Production
Land, Labour, Capital and Enterprise
Profit
Financial gain from selling a good or service
Opportunity Cost
Cost expressed in terms of the next best alternative
What diagram can be used to represent Opportunity Cost?
PPC or PPF
PPC/PPF
A diagram which highlights the relationship between the production of good X in relation to good Y
What is a point outside of the PPC?
Unattainable
What is a point inside the PPC?
Attainable but inefficient
What is a point on the PPC?
Attainable and Efficient
How can growth of an economy be shown?
Outward shift of the PPC curve
How can you show unemployment on the PPC?
The point is closer to coordinates (0,0)
What can the PPC illustrate?
Scarcity, Choice, Efficiency, Inefficiency, Opportunity Cost, Constant Opportunity Cost, Increasing Opportunity Cost and Growth.
Market
An institution which permits interaction between buyers and sellers ALSO be considered a mechanism that determines which goods and services will be produced in an economy and so how scarce resources will be allocated
Demand
Summarizes the behaviour of buyers in a market
Law of Demand
As prices increase, demand decreases (inverse)
Substitution Effect
If the price of X increases then all other goods automatically become relatively cheaper and so consumers will tend to substitute other goods
Income Effect
If the price of X increases then purchasing power of consumers decreases and they will be able to afford less
Factors affecting demand
PIRATES: Population size, Income, Related Goods, Advertisement, Taste, Expectation, Substitutes
Also could include (direct taxes, government action, trends and fashion, season, natural disaster, special events)
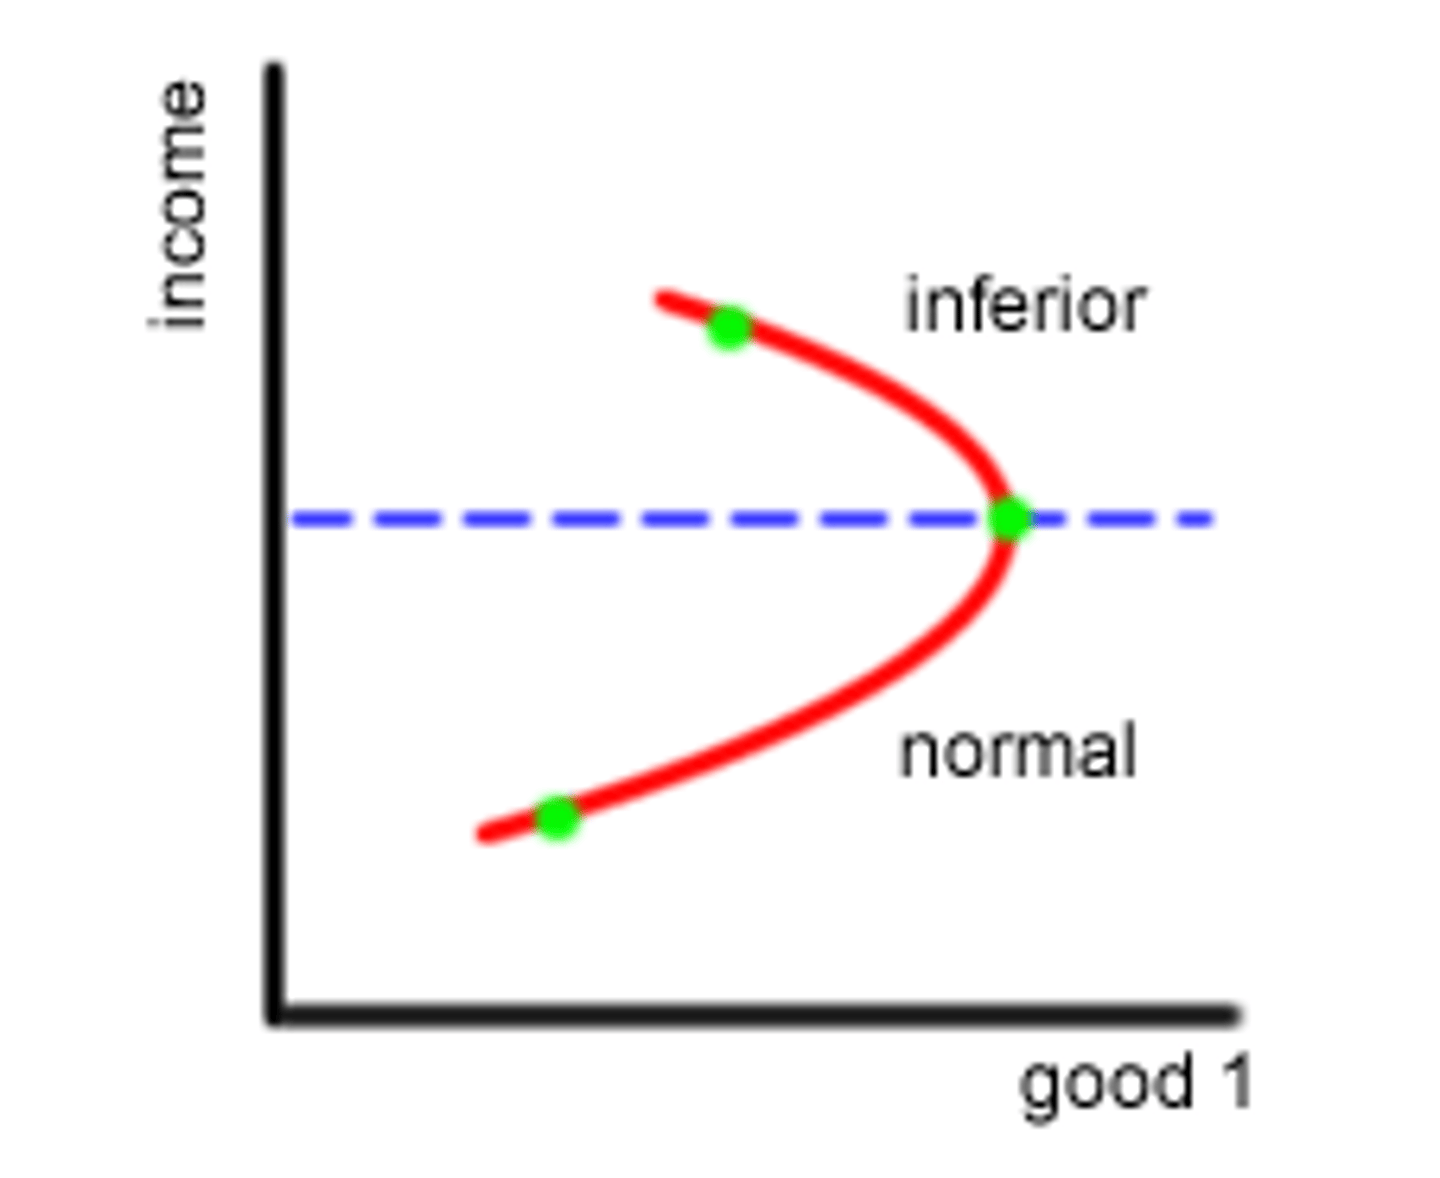
Normal Good
Increase in income leads to an increase in demand
Inferior Good
Increase income, decrease demand
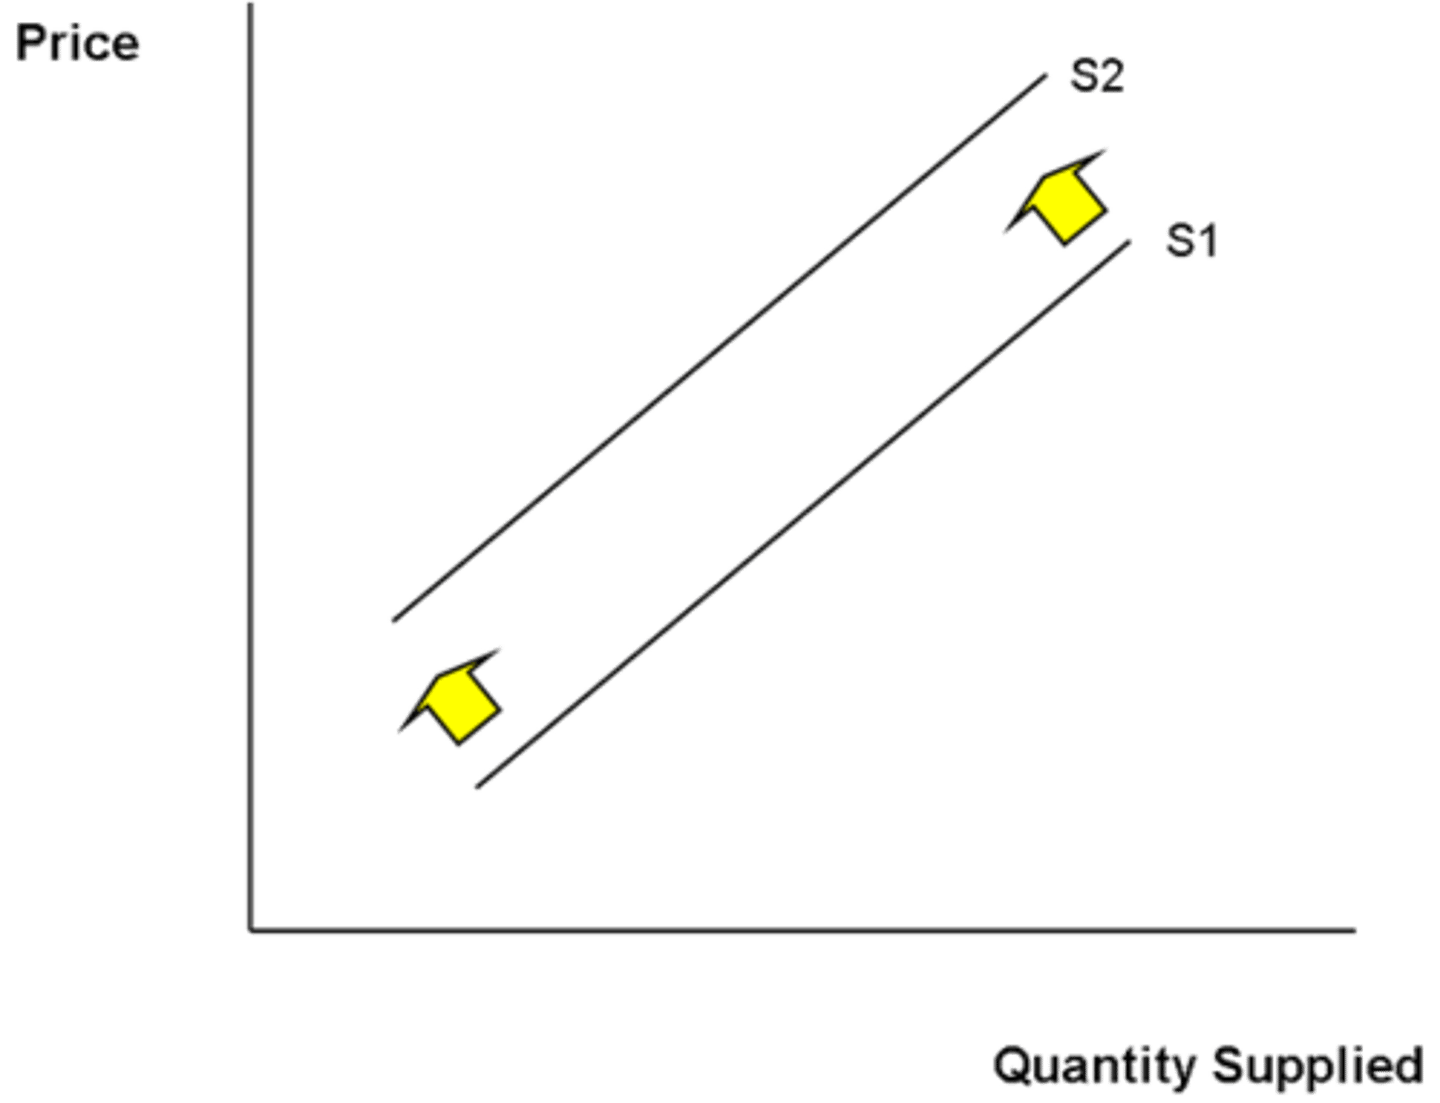
Supply
The amount that producers are willing and able to supply at any given price at any given time
Law of Supply
As prices rise, supply rises
Determinants of Supply
INSECTS: Intervention by government, # of firms in the market, supply shock, expectation, cost of production, technology, supply of goods
How will a good be sold in a competitive market?
It is determined by the interaction between consumers and producers
Equilibrium Price
Where demand and supply meet
Excess Supply
Prices drop
Excess Demand
Prices Rise
Utility
Benefits or satisfaction gained from consuming goods and services - hard to measure but we assume consumers make decisions based on maximizing utility.
What does price act as?
Signalling, incentive and rationing device & helps allocate resources
What is price mechanism?
The role price plays in incentivizing producers to act in their own self interest to a change in the demand for a particular good
Consumer Surplus
The difference between how much consumers are willing and able at the most to pay for some amount of a good, and what they actually end up paying
Producer Surplus
The difference between what firms earn from selling some amount of good and the minimum they would require to be willing to offer this amount
Where is consumer surplus on a diagram?
Area below the demand curve but above the price line for the units of the good consumed
Where is producer surplus on a diagram?
The area above the supply curve and below the price line for the units of the good produced and sold
When is allocative efficiency achieved?
Allocative efficiency has been achieved when the optimal amount is produced from society's point of view. If neither too much nor too little of a good is produced and consumer than just the right amount of labour and capital are employed in its production
Allocative Efficiency
When the MB (marginal benefit) = MC (marginal cost)
Price Elasticity of Demand (PED)
The responsiveness of quantity demanded to a change in price = % change Qd / % change P
Ranges of PED
PED > 1 = elastic
0
Increase Price of Elastic Good leads to...
Quantity falls and so does Total Revenue
Increase Price of Inelastic Good leads to ...
TR will rise
Marginal Revenue (MR)
the extra revenue from selling one more unit of output
Determinants of PED
SPLAT = Substitutes, Proportion of Income, Luxury vs Necessity, Addictiveness, Time (others may include: Advertisement and Branding, How the product is defined)
Effect of PED on TR
Elastic Demand:
Price Rise - TR fall
Price Fall - TR rise
Inelastic Demand:
Price Rise - TR rise
Price Fall - TR fall
Cross Price Elasticity of Demand (XED)
The responsiveness of demand for one good (x) to a change in price of another good (y) = % change Qx / % change Py
Ranges of XED
XED>0 two goods are substitutes
XED < 0 two goods are complementary
XED = 0 two goods are unrelated
XED > 0
Substitutes : CURVE LOOKS LIKE SUPPLY CURVE
XED < 0
Complements: CURVE LOOKS LIKE DEMAND
Uses of XED
-Policy maker
-Guide their pricing policy changes
Income Elasticity of Demand (YED)
The responsiveness of demand when consumers income changes = % change Qd / % change income
Ranges of YED
YED > 0 = normal good
YED < 0 = inferior good
YED > 1 = Luxury good
0 < YED > 1 = Necessity
YED = 0 unaffected by income
YED = 1 Same change
How to illustrate YED
Simple Demand/Supply diagram
Engel Curve
Engel Curve
A graph with income on the vertical axis and quantity demanded on the horizontal axis
Applications of YED
Help firms better plan their investments
Government may want to know in order to train displaced workers
Price Elasticity of Supply (PES)
The responsiveness of quantity supplied when the price of a good changes = % change Qs / % change Price
Ranges of PES
PES > 1 = elastic
0 < PES > 1 = inelastic
PES = 1 unitary price elastic
PES = 0 perfectly inelastic
PES to infinity = perfectly elastic
Determinants of PES
Excess capacity
Whether the firm employs mostly skilled or unskilled labor
Long or short time lags
Whether it's possible to store the good
Mobility of labour
TIME
Time for PES
short term = tends to be elastic
long term = tends to be inelastic
Tax
Can be categorised as direct or indirect tax
Direct Tax
Tax directly on the individual (on income)
Indirect Tax
Tax on goods and services
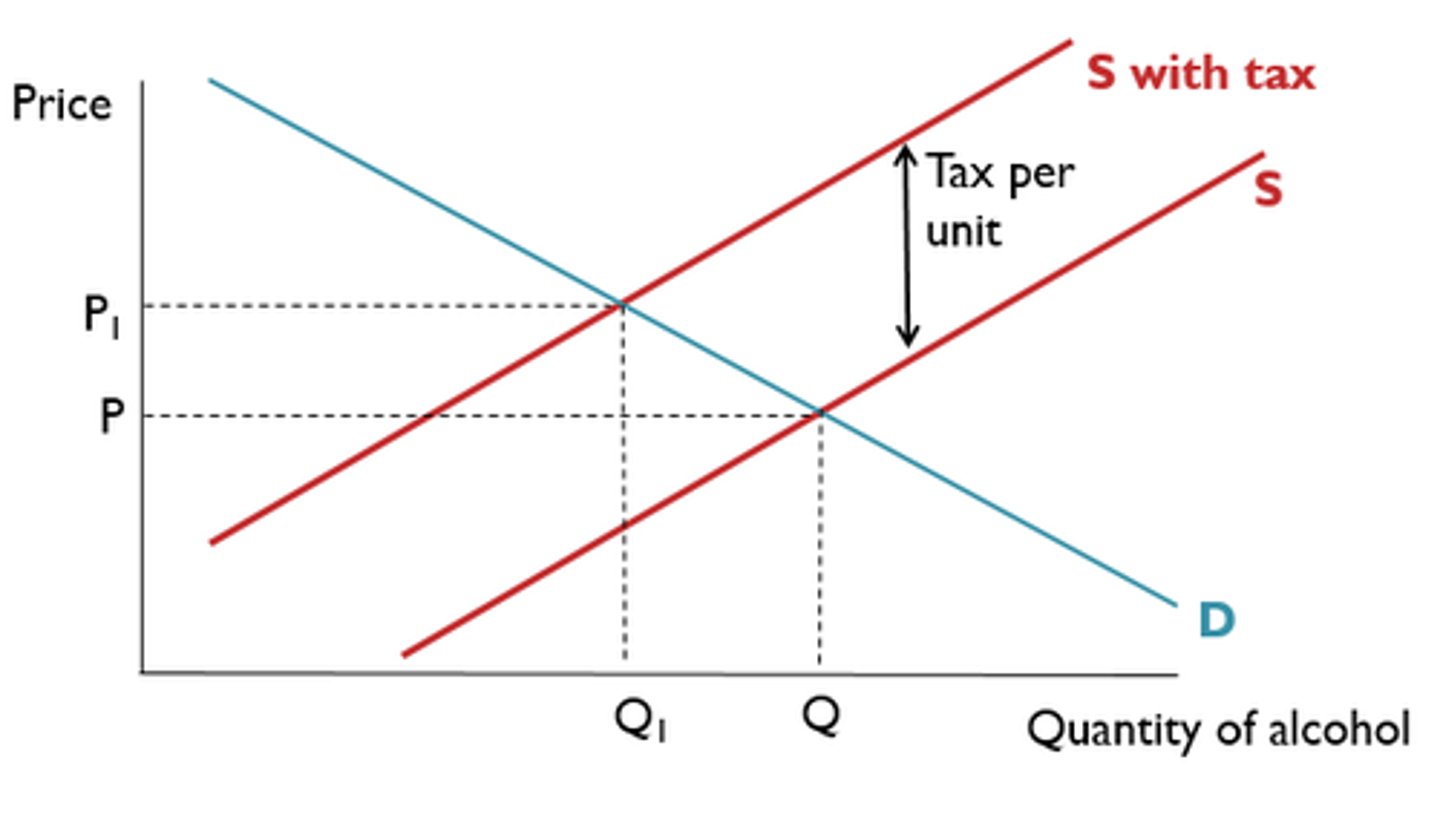
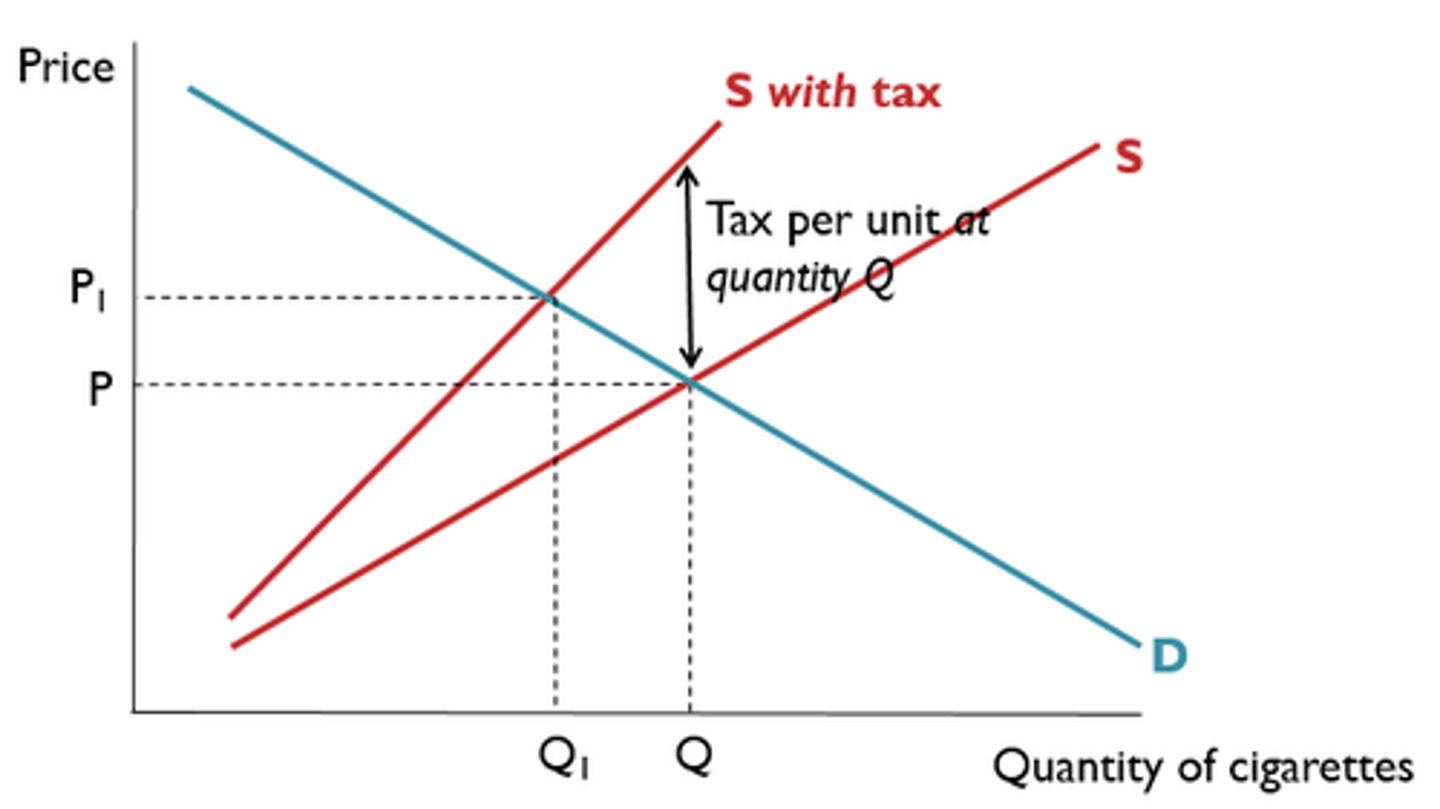
Specific Tax or Unit Tax
Fixed amount per unit of the good produced or consumed
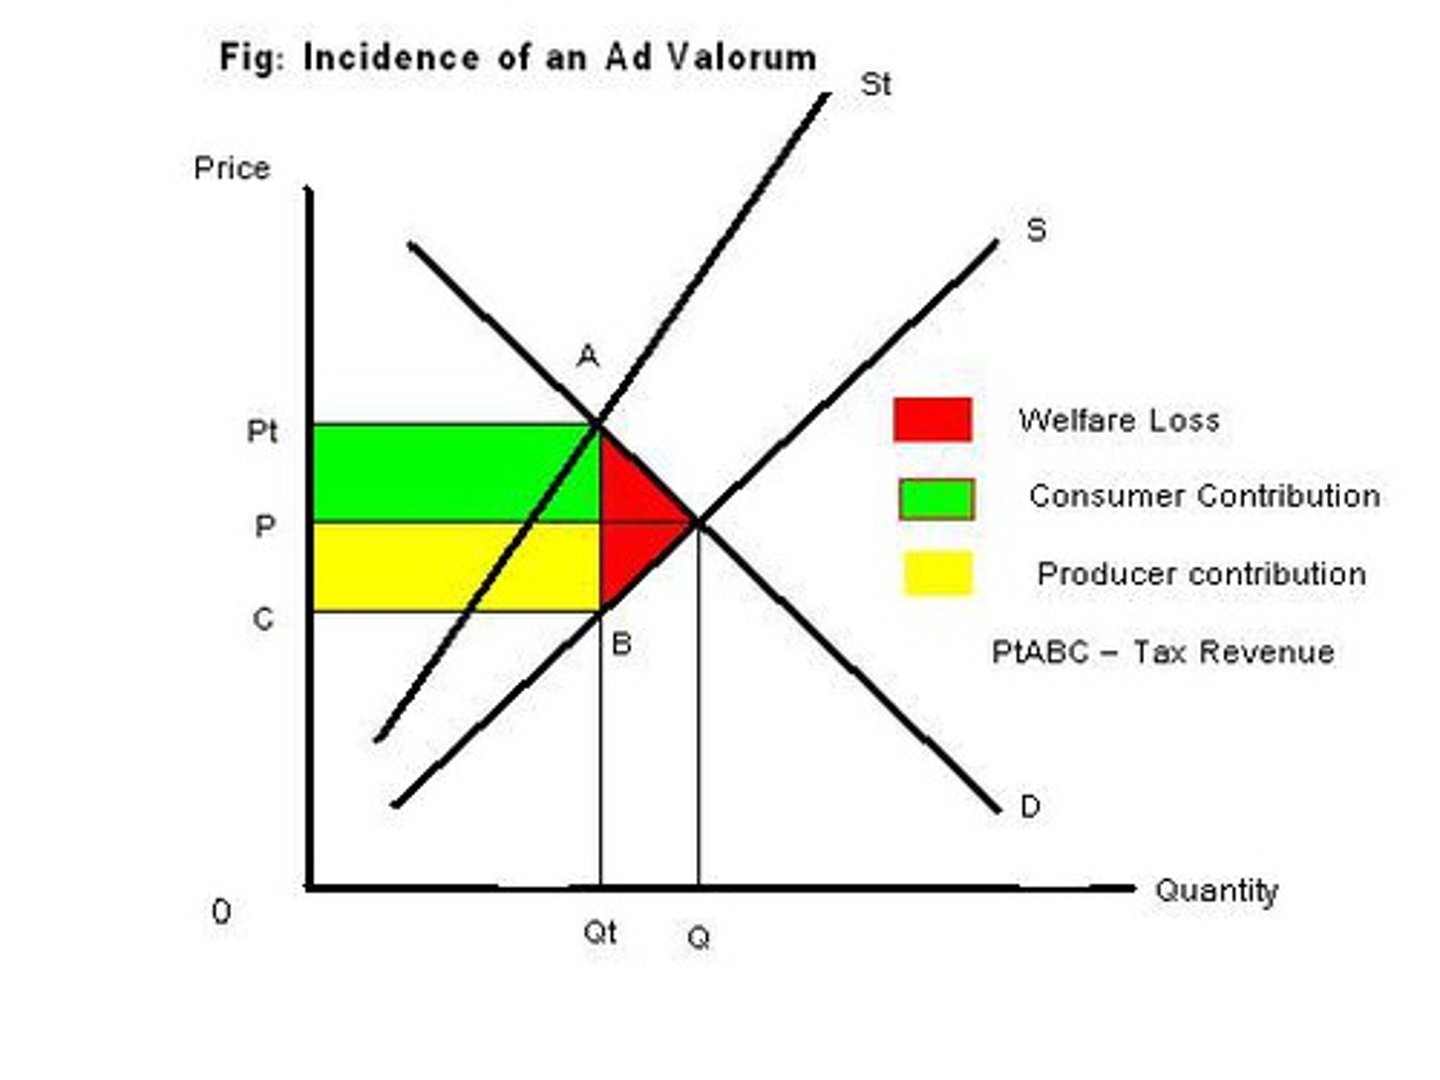
Ad Valorem Tax
Percentage tax of the price and so of consumer expenditure
Why do governments impose taxes?
Revenue Collection
Decrease Consumption of Good
Switch expenditure away from imports towards domestically produced goods
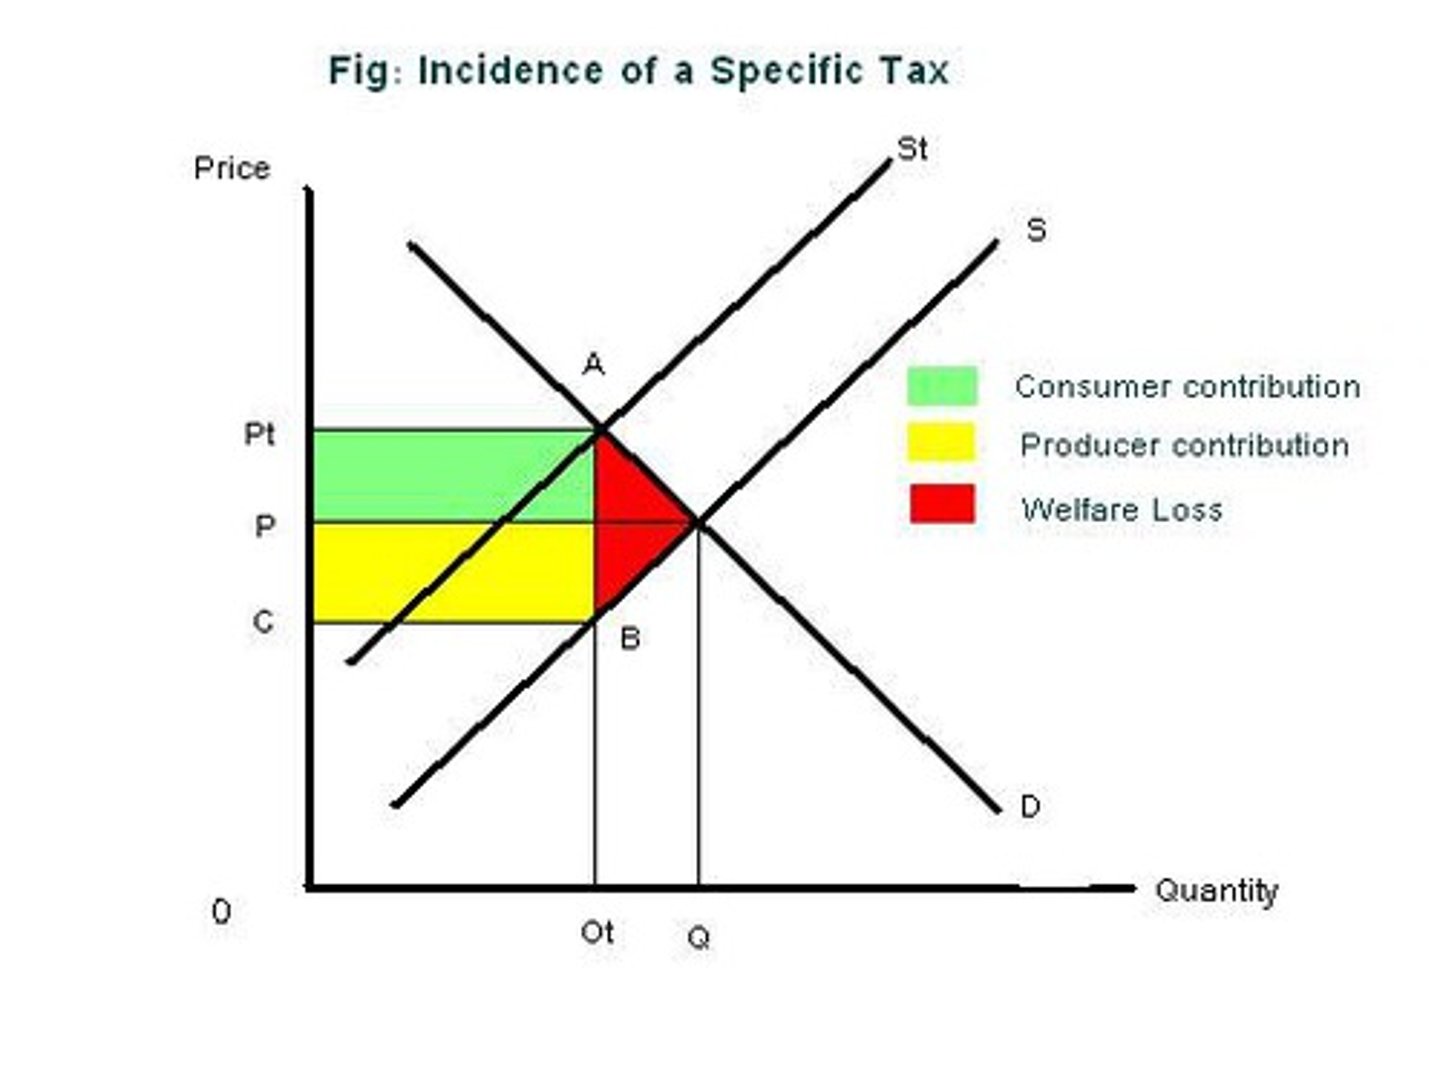
Consequences of a specific indirect tax:
Market Prices Rise
Producer average revenue is less
Government collects tax revenue
Resources are misallocated and a welfare loss
Consumers generally consume less = depends on PED
Social Welfare decreases
Tax Incidence
Refers to who pays what proportion of a tax =
% tax incidence on consumers (PES) / % of tax incidence on producers (PED)
Interpreting Tax Incidence
PES > PED = tax incidence is bigger on consumers
PES = PED tax incidence is split
PES < PED = tax incidence on producers is bigger
PES = producers are burdened by the tax only
PED = 0 consumers are burdened by the full amount of tax
Tax Incidence Diagram
Who the tax most largely affects
Ad Valorem Tax Diagram
Subsidy
Per unit payment by the government aimed at lowering their costs and the market price increasing production
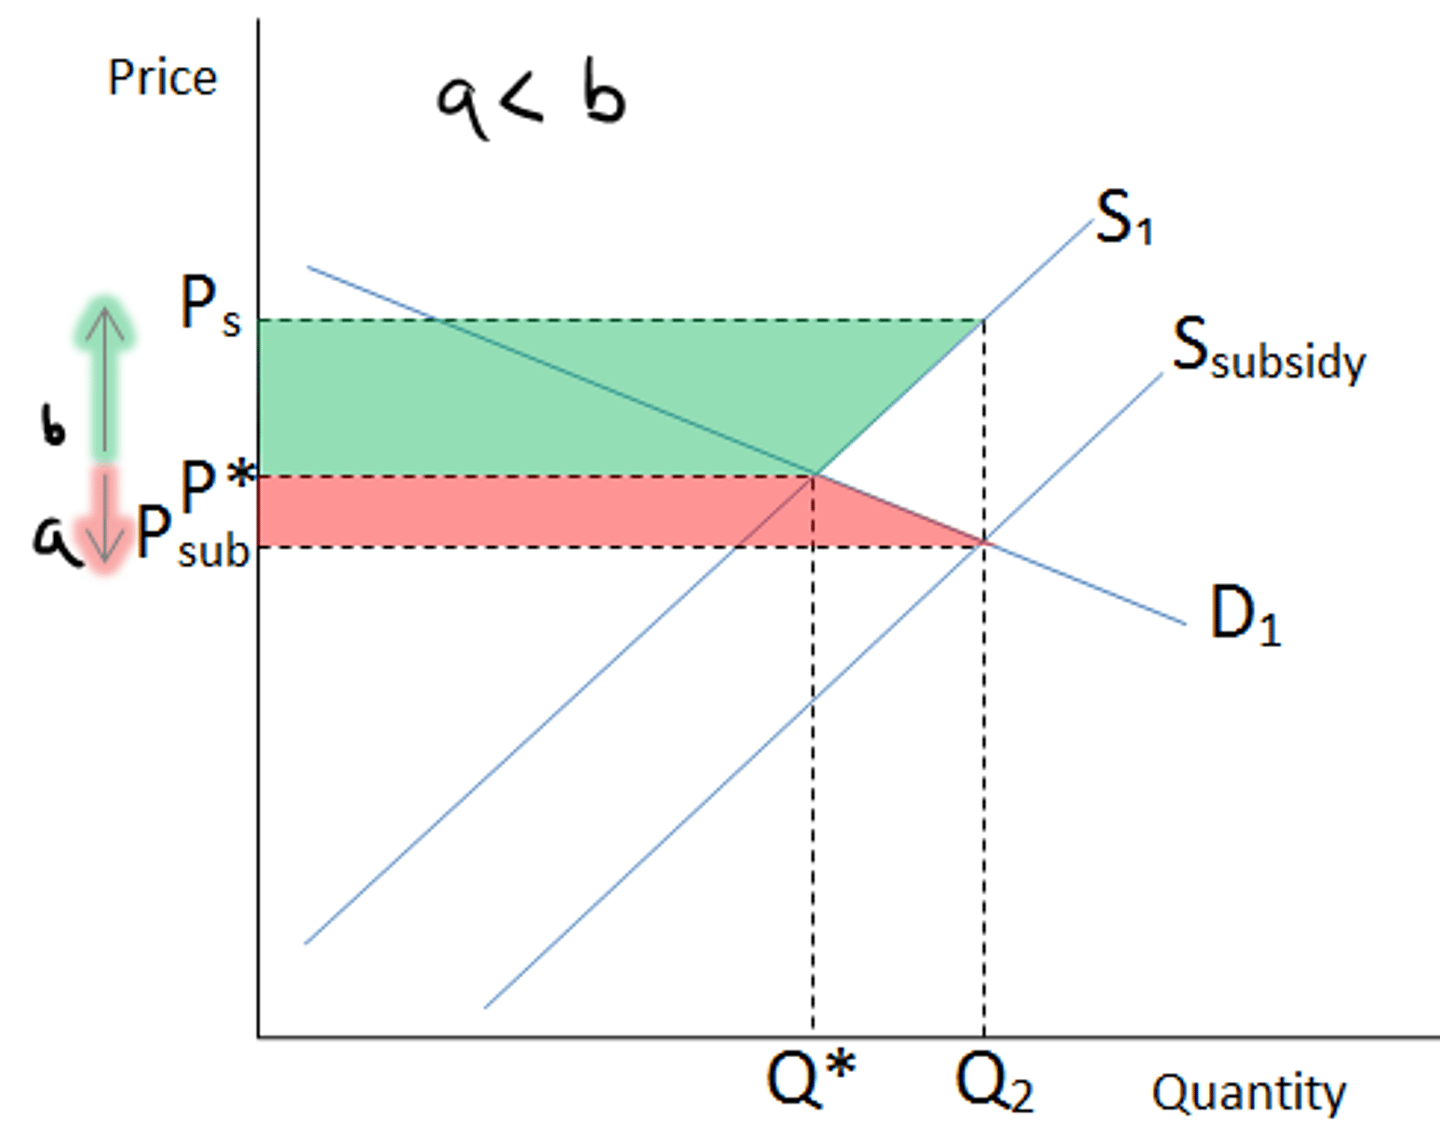
Effects of the Subsidy
Consumers pay lower market price
Quantity supplied increases
Average revenue collected by producers increases
Total revenue collected by producers increases
Government expenditure increases
Social welfare decreases
Consumer expenditure = depends on PED
Price Controls
Refer to cases where for some reason the government considers the market determined equilibrium price unsatisfactory and as a result intervenes and sets the price either below or above it
Price Ceiling
Maximum price set below the equilibrium
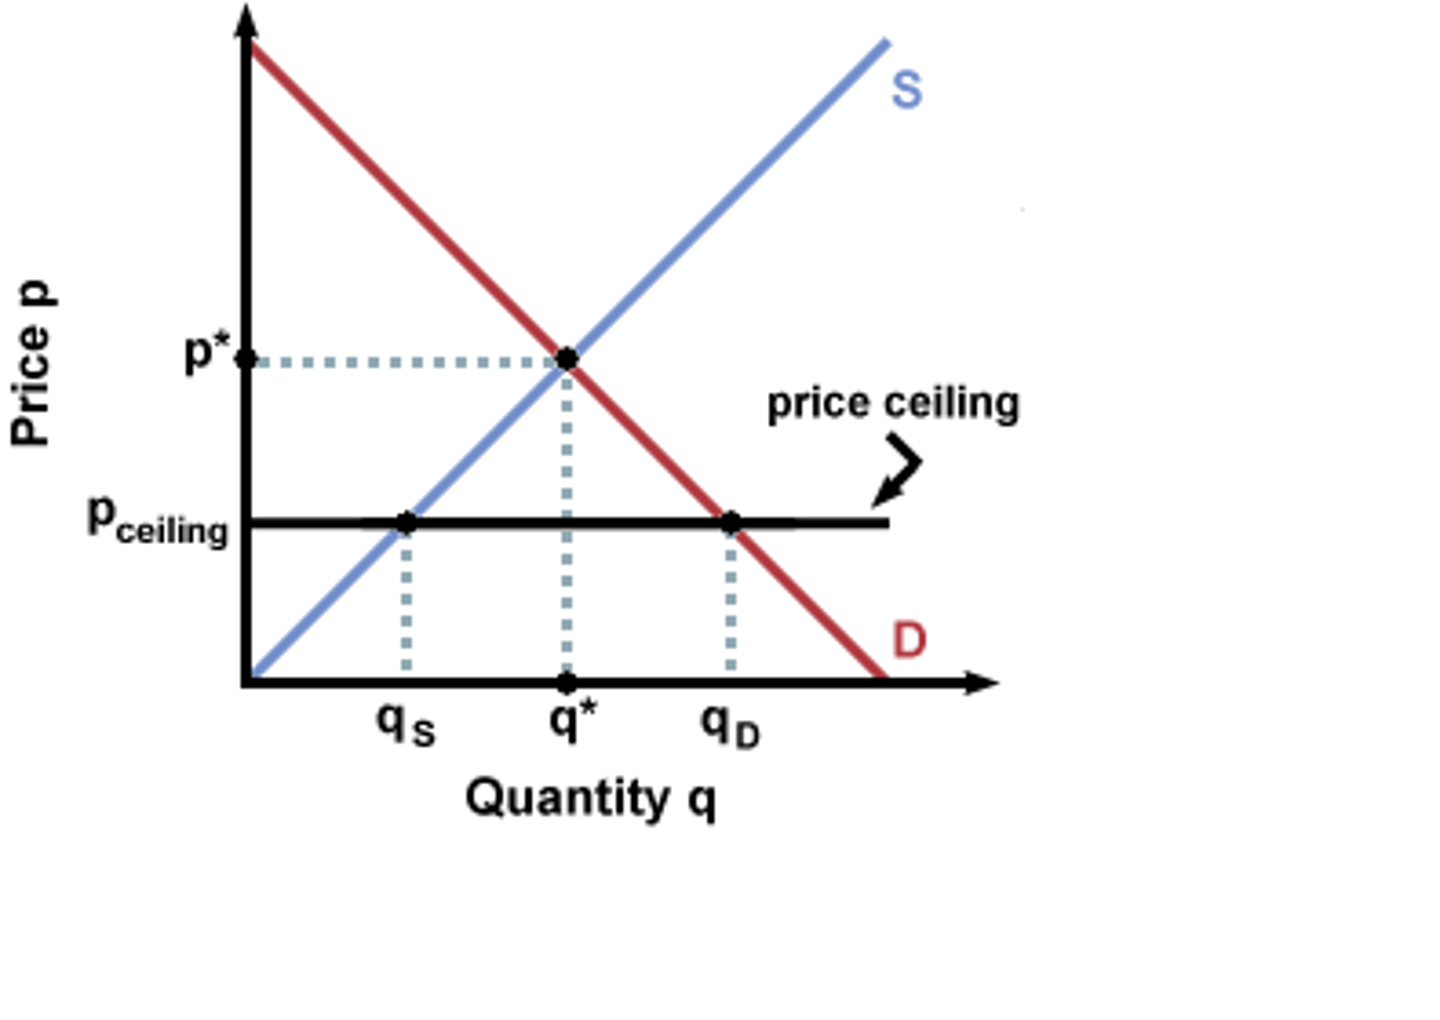
Aim of a Price Ceiling
To protect the buyers of the product
Problems with Price Ceiling
The new price cannot preform it's rationing functions and thus individuals may be willing and able to pay the price but it is not certain they they will end up with the good since there is shortage: "first come first serve"
-Black markets (parallel markets)
Rationing Methods:
Ballots
Coupons
Etc.
Cons of Price Ceiling
Takes away rationing capabilities of Price
Parallel Markets (for people willing to pay higher)
Lower quality of good
Shortage
How to fix shortage of price ceiling
Subsidy
Promotion of substitute goods
Stakeholders in Price Ceiling
Producers - worse off (lower revenue)
Consumers - better off (lower price BUT shortage)
Government - decrease tax revenue BUT increased popularity
Price Floor
Minimum price set above the market-determined equilibrium
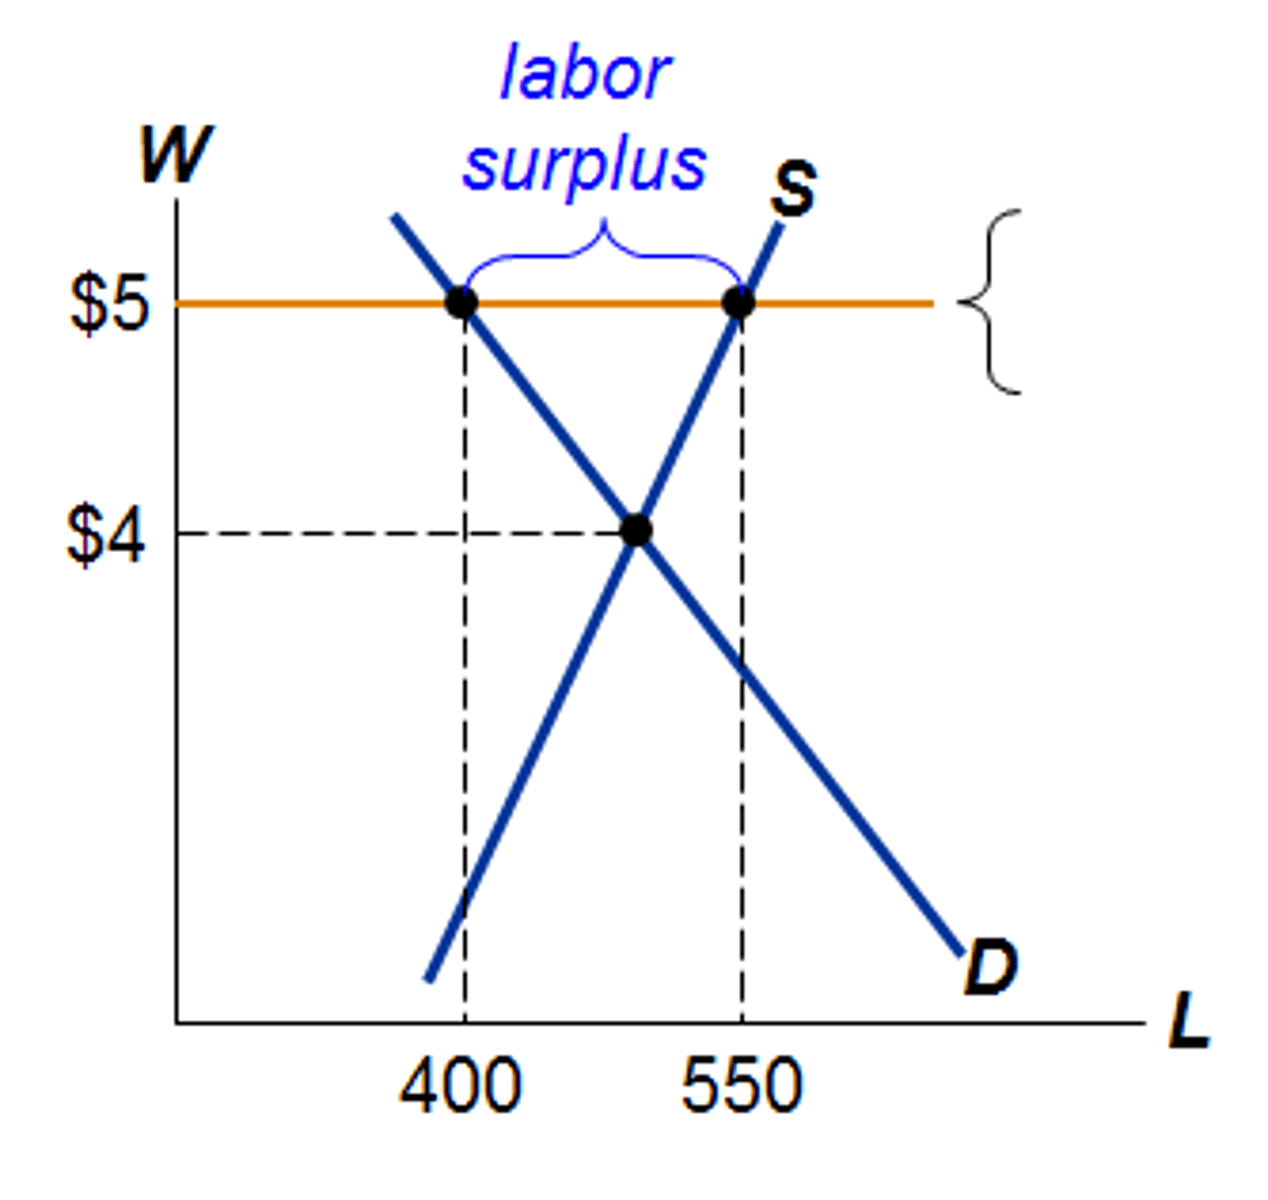
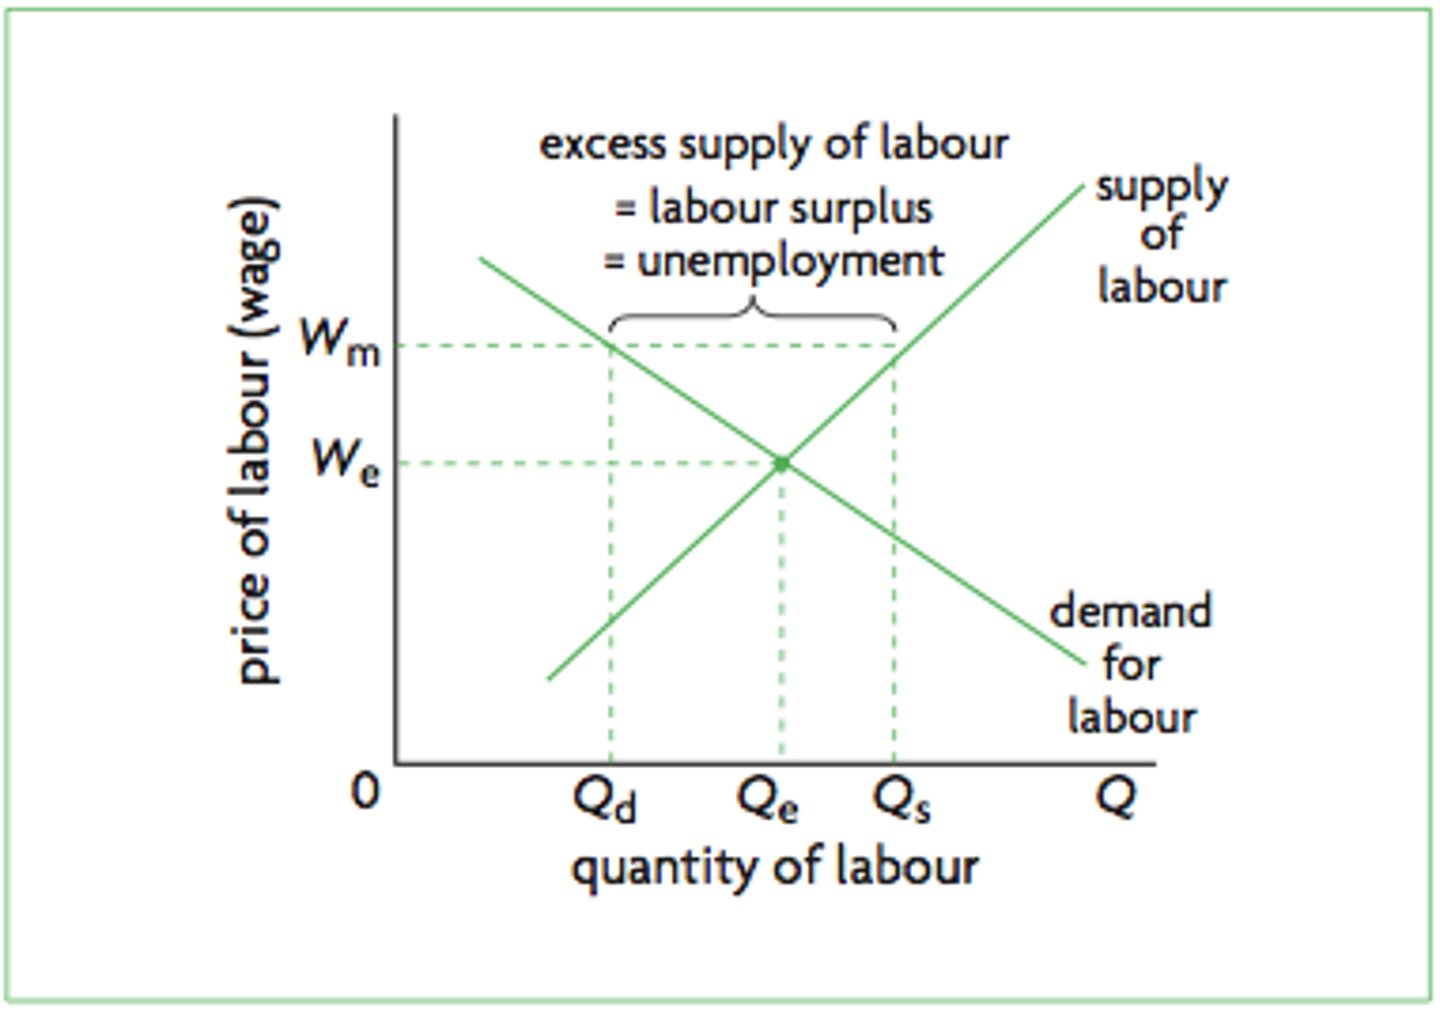
Price Floor in the Labour Market
Minimum Wage
Price Ceiling vs Price Floor
Price Ceiling:
Aim - protect consumers
Results - shortage, price cannot preform rationing role, possibility parallel market, worse quality good
Consumers - depends
Producers - worse off (lower price)
Welfare - inefficient Welfare Loss
Examples - food price controls, rent control
Price Floor:
Aim- protect producers (farmers)
Results - surplus, government forced to buy surplus and destroy it, burden on tax payers
Consumers - worse off (higher price)
Producer - better off
Welfare - Welfare loss
Example - farmers, minimum wage
Market Failure
Encompasses: externalities, public goods, monopoly power, asymmetric information
Externalities as Market Failure:
If an economic activity imposes costs on, or creates benefits for third parties for which they do not get compensated for, or do not pay for - imposes costs on third parties
Public Goods as Market Failure:
Leads to the collapse of the market as profit-oriented firms will not have the incentive to producer and offer these goods
Monopolies as Market Failure:
Less than the socially optimal amount of the good will be produced = no incentive
Asymmetric Information as Market Failure:
Buyers and sellers share different sets of information then this may also lead to a market failure
NEGATIVE CONSUMPTION EXTERNALITY
Negative Externality
Impose costs on third parties
Positive Externality
Provide benefits for third parties
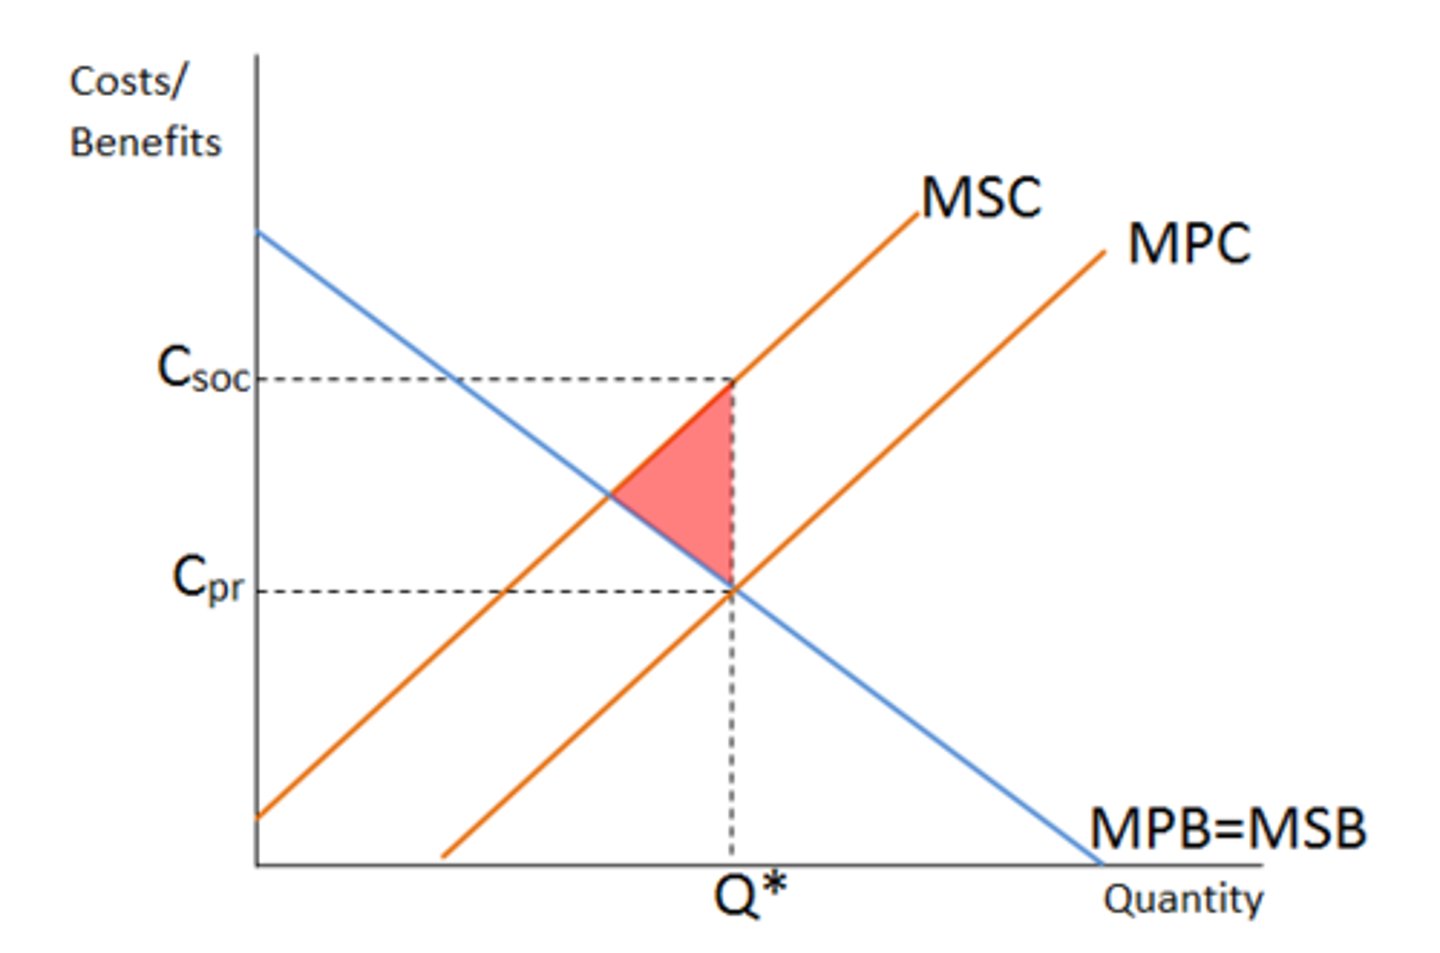
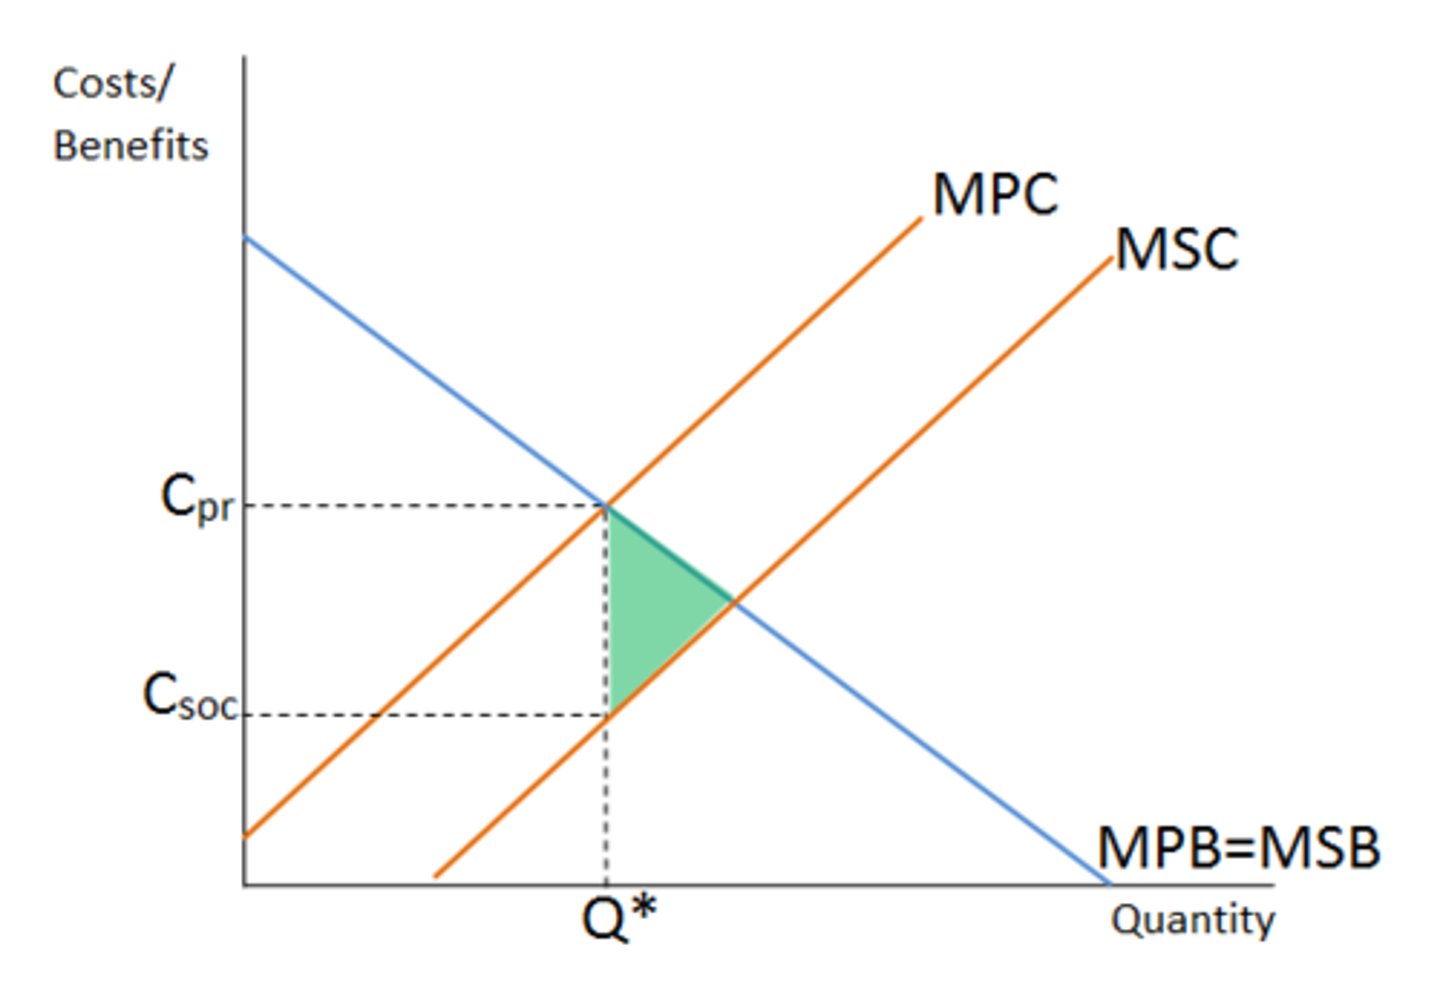
Marginal Cost
MPC (Private): costs of producing an extra unit of output
MSC (Social): Costs of producing an extra unit of output that are borne by society
Marginal Benefit
MPB (Private): Benefits individuals enjoy from the consumption of an extra unit of good
MSB (Social): Benefits that society enjoys from each extra unit consumed
Negative Production Externality
Overproduction of the good
Positive Production Externality
Underproduction of the good
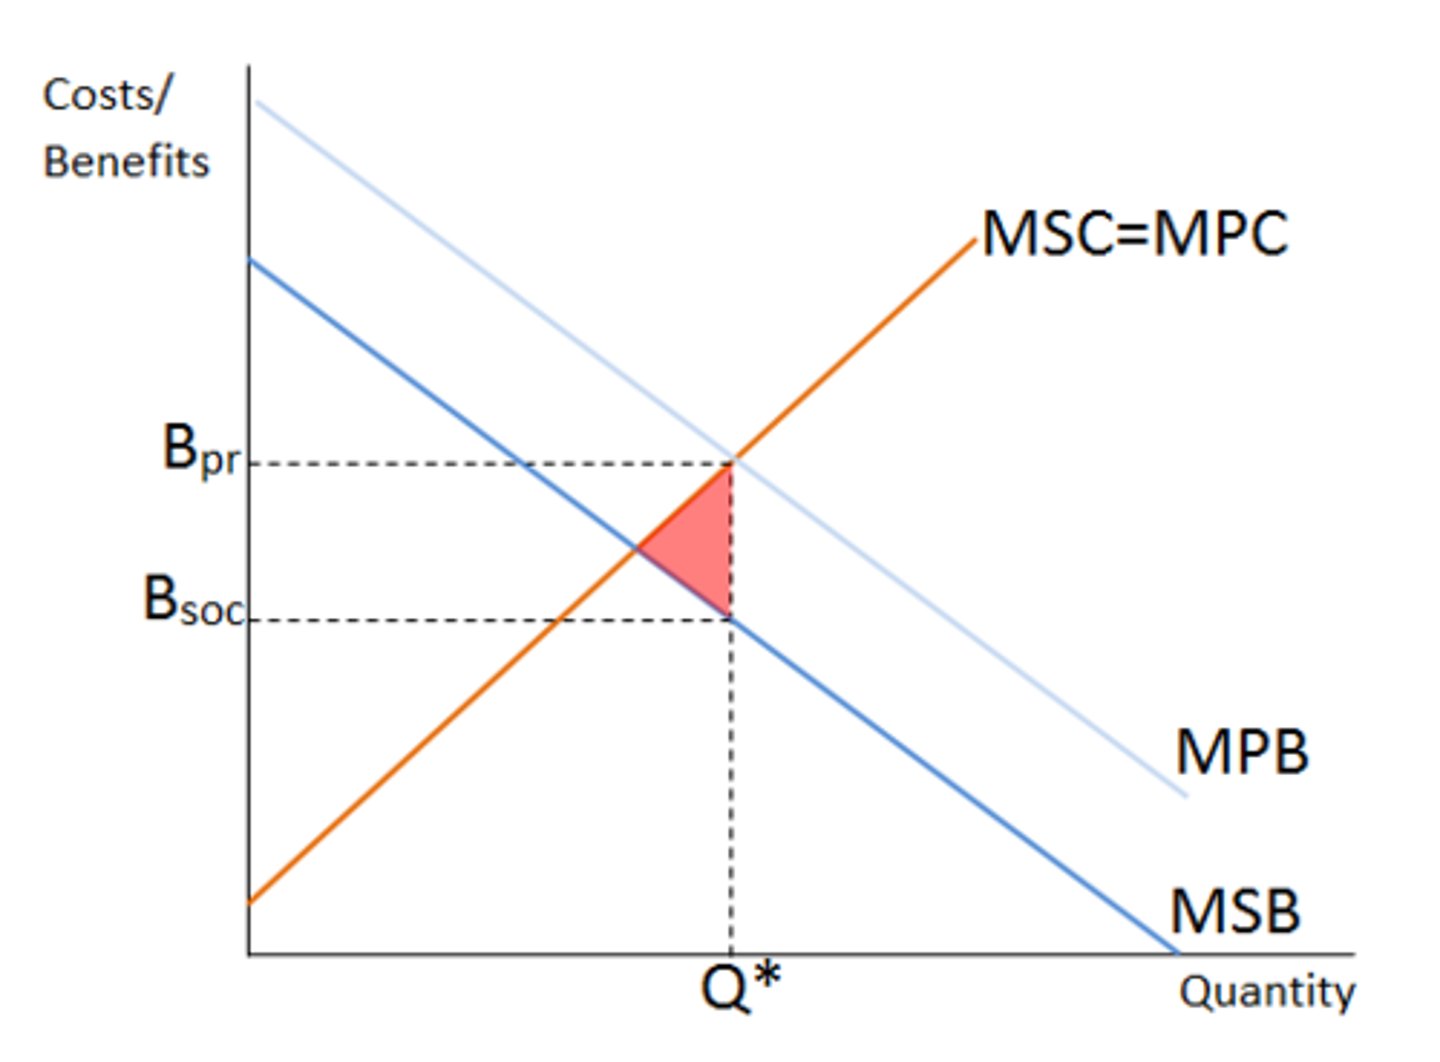
Negative Consumption Externality
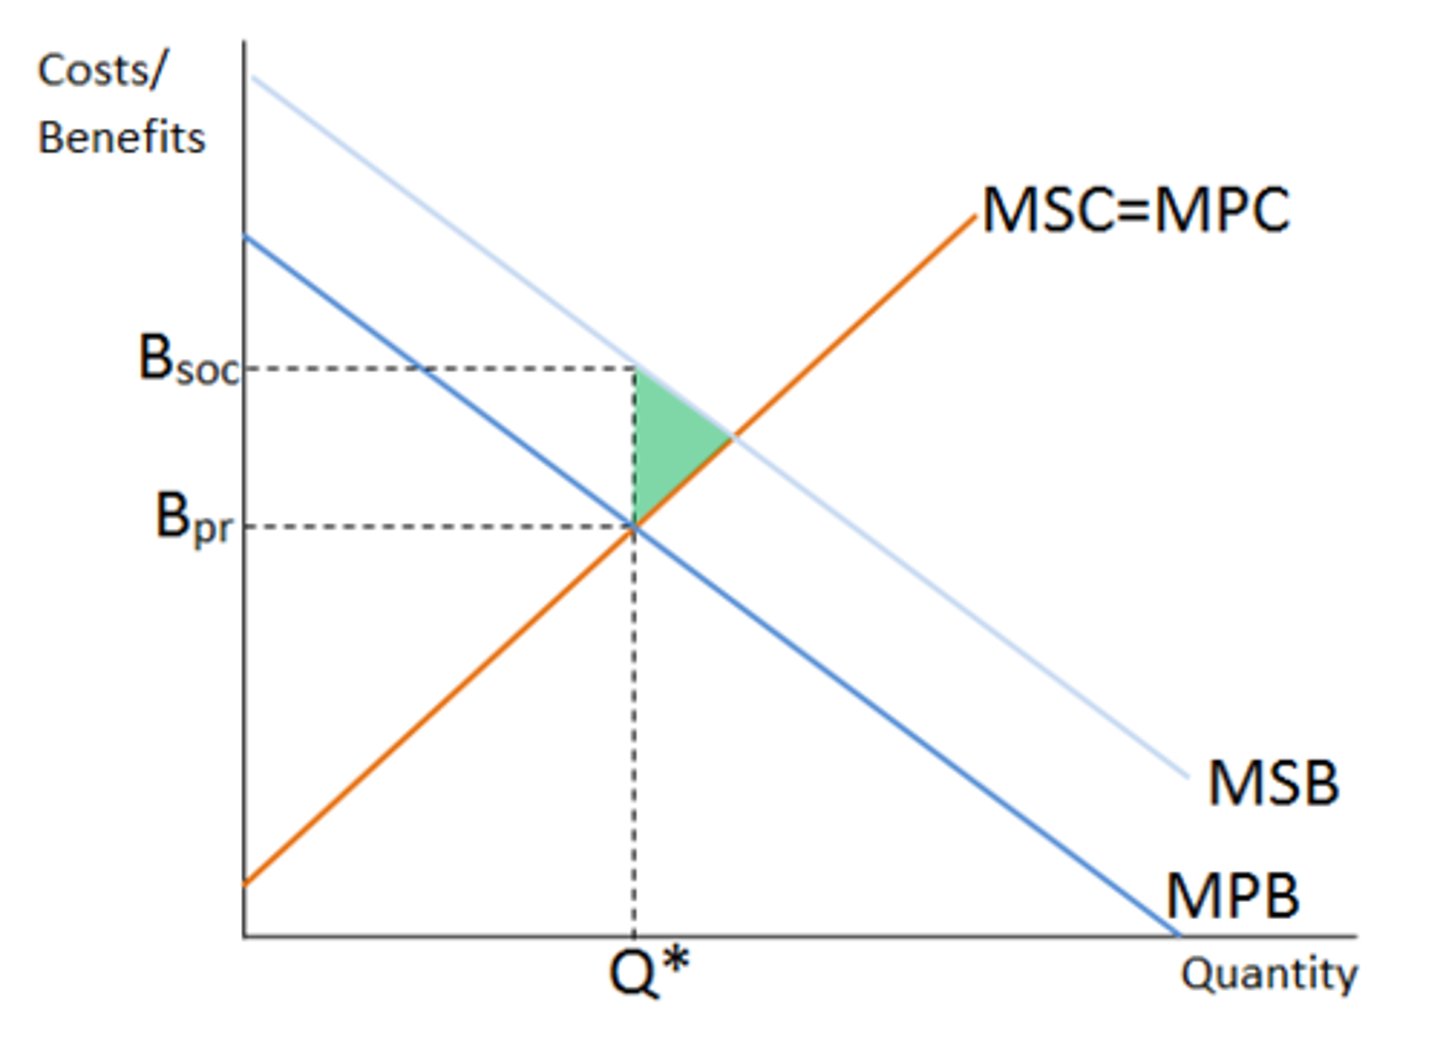
Positive Consumption Externality
Welfare Loss
Point towards your new P1 or Q1
Merit Good
A good which creates very significant externalities OR goods that the government would like for the public to consume regardless of their income
Examples: Education and health care
Demerit Good
Consumption of the good creates very significant negative externalities
Examples: Alcohol and Tobacco
Solutions to Negative Production Externalities
Indirect Taxation, Assigning and enforcing property rights over assets, Tradable pollution permits (cap and trade schemes), Advertising, Persuasion, Education
Solution to Positive Production Externality
Subsidy, Intellectual Property Rights, Mergers, Direct Regulation
Solution to Positive Consumption Externality (Merit Goods)
Subsidy, Legislation and Direct Provision, Advertisement and moral provision
Solutions to Negative Consumption Externality (Demerit Good)
Indirect Tax, Direct Regulation, Advertisement and moral persuasion
Public Good
Non-Rivalrous, Non-Excludable
Examples: light house, traffic lights, roads