Pulsed Echo Dynamic Range
1/116
Earn XP
Description and Tags
UT 200
Name | Mastery | Learn | Test | Matching | Spaced |
|---|
No study sessions yet.
117 Terms
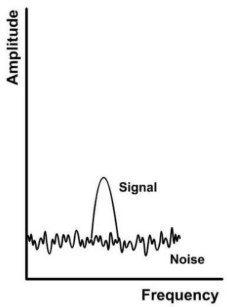
signal to noise ratio (SNR)
comparison of meaningful information (signal) in an image compared to the amount of contamination (noise); a ratio of signal amplitude
a ___ amplitude signal indicates a ___ signal compared to the noise
high; stronger
a high signal does not guarantee a high-quality image because
even a large signal could be masked by a high noise signal
low amplitude signal indicates the strength of the signal is
closer to the strength of the noise leading to less diagnostic value
Poor SNR can result from a high noise level and either a
high or low amplitude signal
which image has a poor SNR?
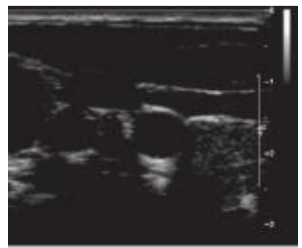
which image has a good SNR?
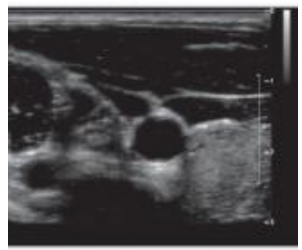
Good SNR is the result of ___ amplitude signal and ___ noise level
high; low
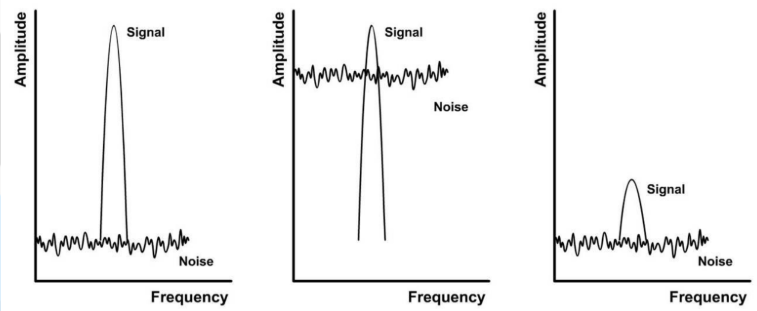
which graph represents the ideal SNR?
the graph on the left has good SNR
the middle and right graphs have poor SNR
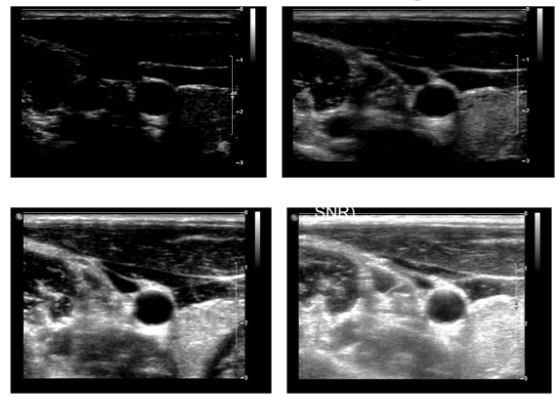
describe the SNR of the following images in the following order: top left, top right, bottom left, and bottom right
bad, ok, great, bad
sources of noise
(1) electronic noise
(2) clutter
(3) haze
(4) electrical interference
how does changing the receiver gain affect electronic noise and signals?
high receiver gain amplifies both noise and useful signals equally
clutter
large returning echoes from structures that obliterate weaker signals
examples: signals from specular reflections (valve echoes on Doppler spectrum)
haze
created by returning echoes from side lobes or poor transducer to skin contact
electrical interference
ultrasound machines receive energy emanating from other electrical devices and nearby equipment (shows up as a bright flashlight)
how can SNR be improved?
(1) image persistence/frame averaging
(2) spatial compounding
how does image persistence/frame averaging improve SNR?
this averaging technique reduces the noise thereby giving the appearance of improved SNR
how does spatial compounding improve SNR?
multiple images are created over time and then averaged together to create an image (also reduces specular reflection-related artifacts)
six core functions of ultrasound systems
(1) transmit beams (front end)
(2) receive beams (front end)
(3) process returned data (front and back end)
(4) perform measurements on processed data (back end)
(5) stores processed data (back end)
(6) displays processed data (back end)
the six core functions of ultrasound systems can be divided into 2 sub-systems called
front-end and back-end
front-end processes happen ___ image freezing and back-end processes happen ___ image freezing
before; after
front-end process(es)
transmit beams
receive beams
both front- and back-end process(es)
process returned data
back-end process(es)
perform measurements on processed data
stores processed data
displays processed data
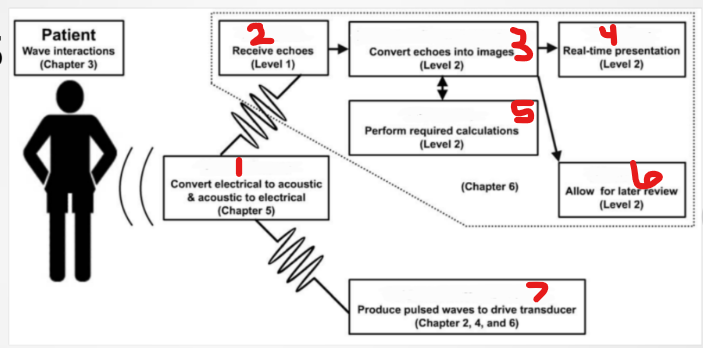
what is #1 labeled?
transducer

what is #2 labeled?
receive

what is #3 labeled?
process/scan convert

what is #4 labeled?
display

what is #5 labeled?
measure
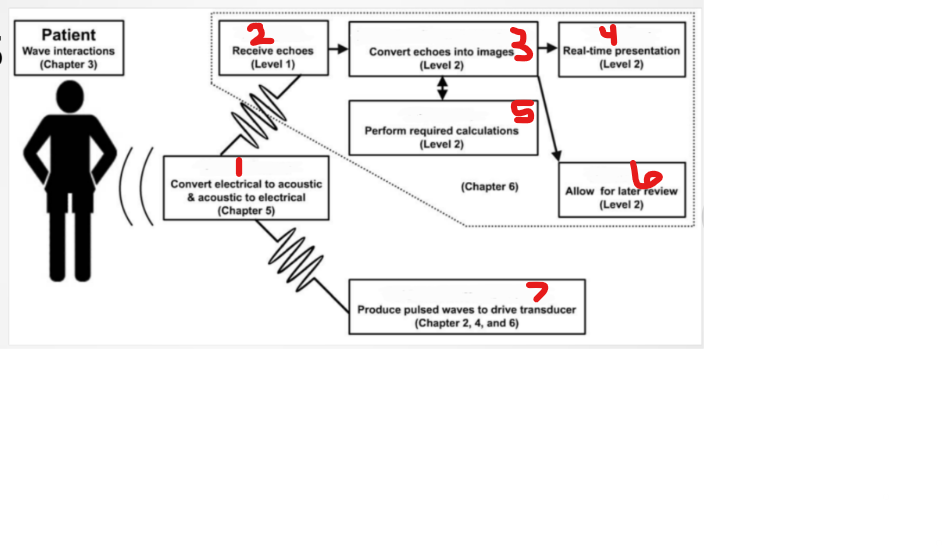
what is #6 labeled?
storage

what is #7 labeled?
transmitter (pulser)
ultrasound system components
(1) master synchronizer
(2) transducer
(3) transmitter
(4) pulser/beamformer
(5) receiver
(6) scan converter/memory
(7) display
(8) storage
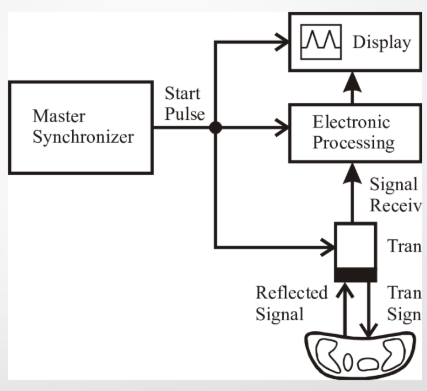
the master synchronizer is the
computer’s (CPU board) aka the brain of the ultrasound system
what are the functions of the master synchronizer?
(1) coordinates all the components of an ultrasound system
(2) controls the echo timing
(3) tells the pulser to send out a pulse and pays attention to the returned echo to determine the range
(4) makes sure a pulse has returned before sending the next pulse
(5) contains presets
where is the master synchronizer located in an ultrasound machine?
in the main body
the transmitter is capable of
(1) producing a virtually infinite number of electrical waveforms to drive the various transducers used in ultrasound
(2) changing the amplitude of voltage to decrease or increase the output power going into the patient
in reference to the transmitter, the higher the voltage
the higher the power output of the transducer
additional names for transmit power
(1) output power
(2) transmit power (or just transmit)
(3) power output (or just power)
(4) acoustic power
what is the role of the transmitter?
it powers the machine
overall gain and TGC are ___ from power
different
output power control is
AKA “transmit” power and is controlled by the sonographer
increasing the output power control ___ the amplitude of the voltage driving the transducer, which produces a ___ amplitude pressure as a result
increases; higher
power is proportional to
amplitude squared, which means that the higher the voltage amplitude, the significantly higher the power wave
intensity is proportional to
power, which means that the higher the power wave, the higher intensity of the sound beam
the ___ output power, the higher ___ sound beams
higher; intensity
higher output power and higher intensity sound beams
(1) penetrate deeper despite attenuation
(2) result in stronger returning echoes that appear brighter on ultrasound images
(3) are related to higher risk of bioeffects
output power levels must be kept low in order to
(1) decrease the transmitted acoustic energy
(2) minimize the risks of bioeffects
what does ALARA mean stand for and why is it significant in ultrasound imaging?
(1) as low as reasonably achievable
(2) keep power as low as possible to not harm the patient while also creating a good image
factors that affect transmit power distribution
(1) TDR frequency
(2) imaging modality
(3) image size
(4) imaging depth
(5) focus location
how does TDR frequency affect transmit power distribution?
higher frequency beams are absorbed at greater rates (higher frequency = greater attenuation = absorption)
there are ___ regarding power levels at higher frequencies to limit thermal bioeffects
restrictions
how does imaging modality affect transmit power distribution?
(1) non-scanned modalities scan the same area over and over resulting in increased heating (thermal bioeffects)
(2) scanned modalities there is risk for mechanical bioeffects
how does image size affect transmit power distribution?
increases the risk of tissue heating due to smaller area being scanned
how does imaging depth affect transmit power distribution?
decreased imaging depth = increased duty factor = increased average transmit power = increased risk of bioeffects
DF formula
DF = PD/PRP
DF relationships to remember
PD and DF are directly related
PRP and DF are inversely related
PRF and DF are directly related
depth and DF are inversely related
how does focus location affect transmit power distribution?
shallower focus results in decreased maximum transmit power (in order to reduce thermal risk)
beamformer/pulser is
part of the transmitter
roles of the beamformer/pulser
(1) coordinates the complex electrical signals sent to each active element on the transducer (thereby optimizing the transmitted ultrasound beam)
(2) adjusts electrical spike voltages to reduce lobe artifacts (apodization)
(3) during reception, establishes the time delays used for dynamic receive focusing
(4) controls dynamic aperture by varying the # of PZT crystals used during reception and transmission
(5) amplifies the returning echo signals
the beamformer/pulser consists of
(1) pulser
(2) delays
(3) transmit/receive switch
(4) amplifiers
(5) analog to digital converters
(6) summer
the pulser
(1) is part of the beamformer
(2) generates the voltage that drives the TDR
(3) controls the power entering the patient
the pulser determines
(1) PRF
(2) PRP
(3) soundwave strength
(4) frequency (drive voltage/drive frequency) for CW TDR
transmit/receive (T/R) switch
the beamformer has a T/R switch that is needed during transmission and reception
the T/R switch ensures the
(1) electrical signal travels in the correct direction
(2) pulser voltage goes to the transducer
(3) received voltages from the transducer go to the signal processor
as frequency increases, attenuation
increases
the receiver/signal processor prepares the information contained in the electrical signals for monitor display because
returning signals are weak and require receiver processing (due to attenuation)
the receiver/signal processor processes the return echo coming back from the
patient in the following order
(1) amplification
(2) compensation
(3) compression
(4) demodulation
(5) rejection
amplification (gain) is AKA
receiver gain, 2D gain, and overall gain
amplification (gain)
(1) ensures that each electronic return signal is equally amplified
(2) makes the entire image brighter
(3) dependent on the sonographer
(4) unit is dB or percentage (check each image/machine)
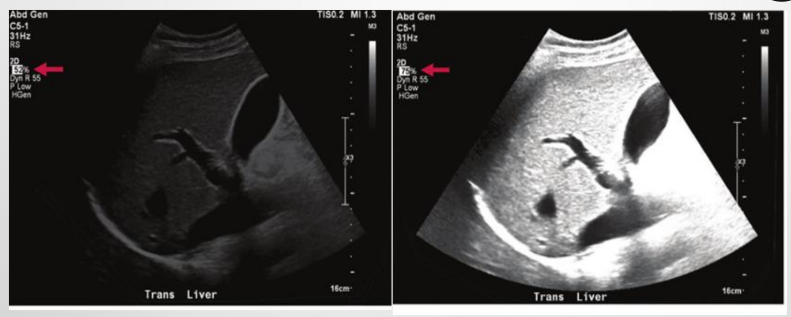
describe the amplification (gain) of the images
the image on the left is too dark and the image on the right is too bright
compensation is AKA
time gain compensation (TGC) or depth gain compensation
TGCs correct or compensate for ___ due to depth
attenuation
TGCs create an image that is ___ bright from top to bottom
uniformly
T/F: TGCs are controlled by the sonographer
true
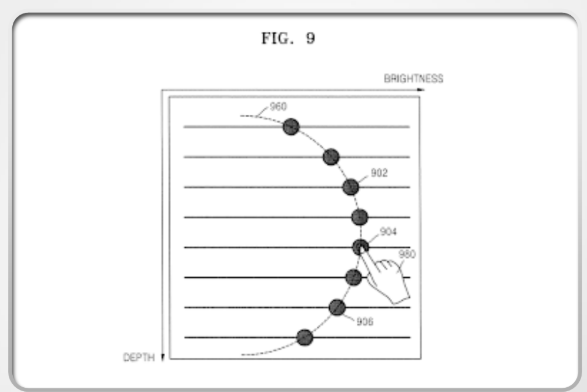
TGC curve
(1) compensation treats echoes differently, depending upon the depth from which they arise
(2) the mid to far fields are typically adjusted
(3) common shapes: C, Ɔ, S
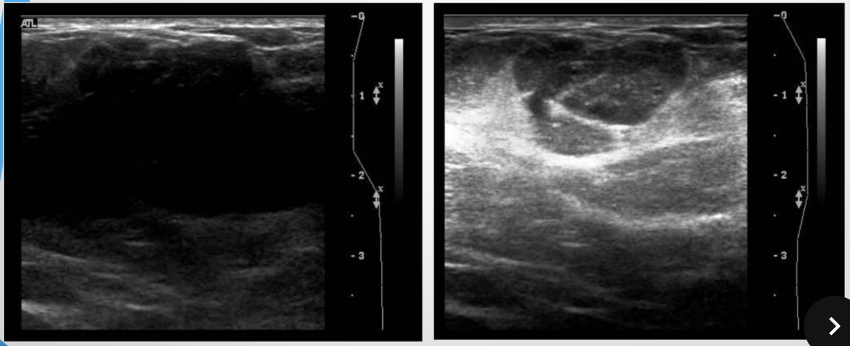
describe the use of the TGCs on the images
(1) on the left, the TGCs are too low, resulting in a very dark picture
(2) on the right, the TGCs are too high, resulting in a very bright picture
compression/log compression changes the ___ characteristics of the image
grayscale
compression/log compression reduces the differences between the ___ and ___ amplitudes
smallest; largest
compression/log compression ___ alter the ranking between signals; the largest remains the largest, and the smallest remains the smallest
doesn’t
compression ___ the range of echo range amplitudes (signals) processed by the receiver
reduces
two types of compression
(1) done in the the receiver (not done by the operator)
(2) user adjustable (via changing the dynamic range)
demodulation
is a two-part process that changes the electrical signals within the receiver into a form more suitable for display on a monitor through (1) rectification and (2) smoothing/enveloping
rectification
converts all negative voltages into positive voltages
smoothing/enveloping
smoothens the bumps around the waves and evens them out
after rectification and smoothing/enveloping, the US machine converts the
amplified signal into a single pulse
T/F: demodulation is adjustable by the sonographer
false
rejection is AKA
threshold or suppression
rejection allows the sonographer to control
whether low-level grayscale (unwanted noise) information within the data will appear on the displayed image
Weak echoes are associated with noise and rejection ___ the weakest echo without affecting large important ones
removes
most US systems have both a “built-in” reject and a ___ reject called wall filter
“user-adjustable”

what is happening at #1?
detected signal

what is happening at #2?
amplification

what is happening at #3?
time gain compensation

what is happening at #4?
compression
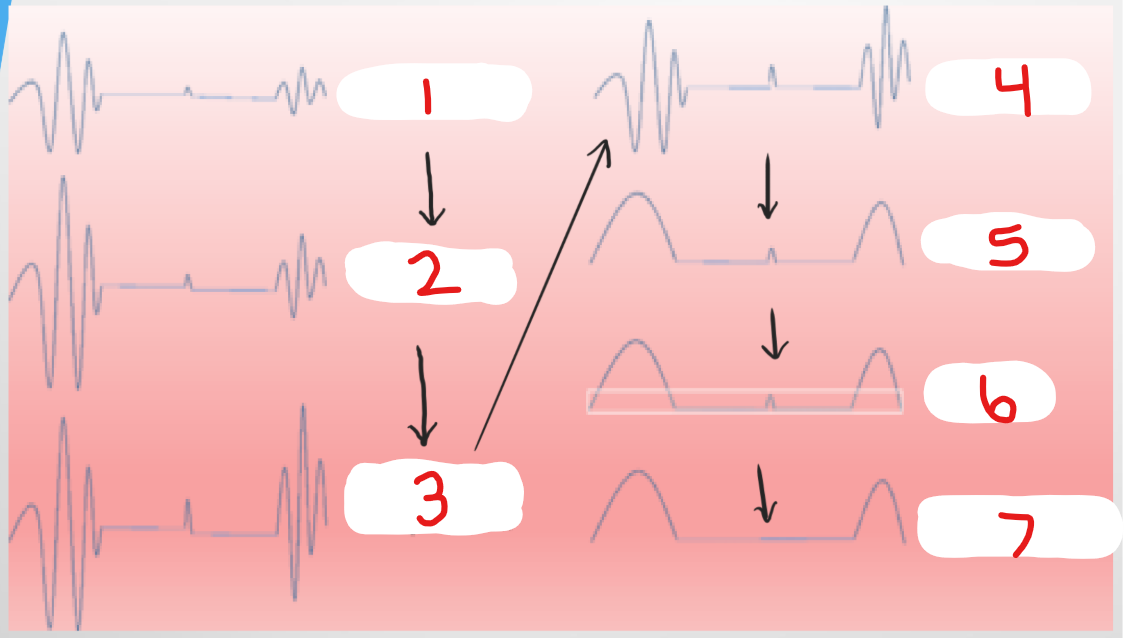
what is happening at #5?
demodulation

what is happening at #6?
rejection

what is happening at #7?
processed signal
dynamic range
is a method of reporting the extent to which a signal can vary and still be accurately measured
dynamic range is measured in ___
decibels (dB)
dynamic range is a ___ between the largest and smallest signals that are measured accurately
ratio