CAP4611 - Data Exploration (L2.pdf)
 Call Kai
 Learn
Learn Practice Test
 Spaced Repetition
 Match
Match Flashcards
 Knowt Play
1/31

There's no tags or description
Looks like no tags are added yet.
Name | Mastery | Learn | Test | Matching | Spaced | Call with Kai | Chat |
|---|
No analytics yet
Send a link to your students to track their progress
32 Terms
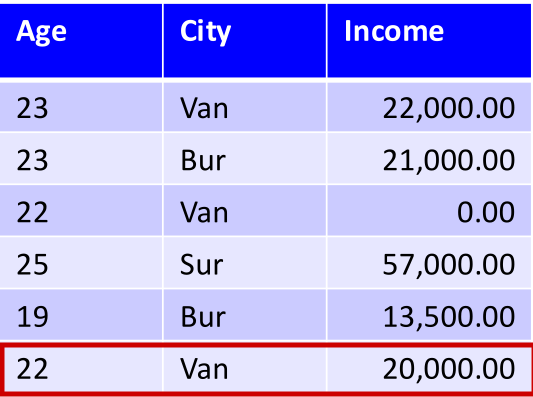
example
feature

categorical
features coming from an unordered set e.g. binary values {yes,no}, {1,0}
numerical
features coming from an ordered set e.g. continuous values {173.5, 162.4, 190.2}
one hot encoding

feature space

bag of words
replace documents by word counts

feature aggregation
combine features to form new features

discretization
turn numerical data into categorical

feature selection
remove features that are not relevant to the task

measures of location
mean, median, quantiles
mean
average value
median
value such that half points are larger/smaller
quantiles
value such that ‘k’ fraction of points are smaller
measures of spread
range, variance, standard deviation, interquantile ranges
range
minimum and maximum values
variance
measure of how far values are from mean
standard deviation
square root of variance
interquantile ranges
difference between quantiles
outliers
mean and std are more sensitive to ___
entropy
measures “randomness” of a set of variables
0
minimum entropy value
log(k)
maximum entropy value
uniform
distribution with highest entropy (for categorical features)
normal
distribution with highest entropy (for numerical features)
Anscombe’s quartet
almost same means, variances, & correlations. look completely different

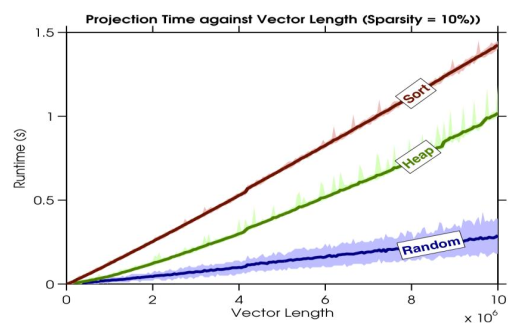
line plot
visualizes one variable as a function of another
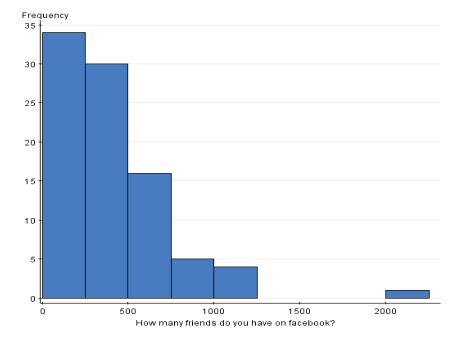
histogram
displays counts of a variable, split into “bins”
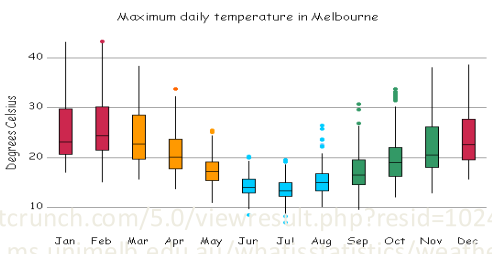
box plot
visualizes spread of continuous variables
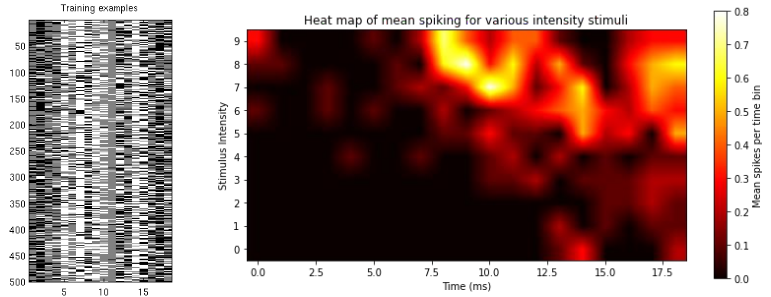
heatmap
visualizes table as an image, sometimes showing trends
correlation plot
visualizes all similarity among all pairs

scatter plot
visualizes correlation between two features
