Forest Measurements Stuff
0.0(0)
Studied by 0 peopleCard Sorting
1/83
Earn XP
Description and Tags
Last updated 10:38 PM on 11/13/22
Name | Mastery | Learn | Test | Matching | Spaced | Call with Kai | Chat |
|---|
No analytics yet
Send a link to your students to track their progress
84 Terms
1
New cards
According to the lecture, which of the following hazards do you need to be aware of when walking in the Duke Forest.
Poison Ivy
Ticks and chiggers
Venemous spiders
Copperheads
Bees and wasps, esp yellow jackets
Ticks and chiggers
Venemous spiders
Copperheads
Bees and wasps, esp yellow jackets
2
New cards
Learning outside offers a host of pedagogical, immunological, and psychological benefits.
Learning outside offers a host of pedagogical, immunological, and psychological benefits.
3
New cards
Carl A. Schenck, a German forester, developed the Biltmore stick while working at the Biltmore Estate in North Carolina.
Carl A. Schenck, a German forester, developed the Biltmore stick while working at the Biltmore Estate in North Carolina.
4
New cards
When measuring DBH with a diameter tape, you should read the tape to the nearest tenth of an inch.
When measuring DBH with a diameter tape, you should read the tape to the nearest tenth of an inch.
5
New cards
Diameter measurement tools have different biases. For example, the Biltmore stick loose accuracy as trees get bigger .
By contrast, diameter tapes tend to be positively biased when measuring irregularly shaped trees.
By contrast, diameter tapes tend to be positively biased when measuring irregularly shaped trees.
6
New cards
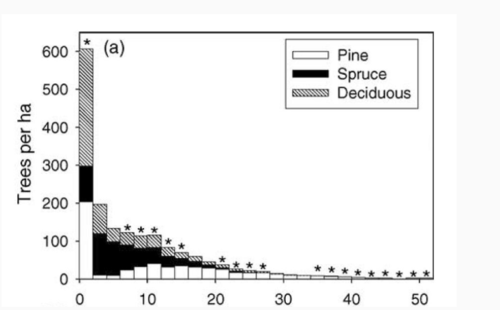
This DBH distribution (see picture) likely comes from what type of stand?
A natural stand
7
New cards
Why QMD instead of arithmetic mean?
quadratic mean has a simple relationship to mean basal area
quadratic mean makes it easier to build yield tables and stand projections
quadratic mean makes it easier to build yield tables and stand projections
8
New cards
1 chain is equivalent to 20.1 meters or 66 feet.
10 chains is equivalent to a furlong.
80 chains is equivalent to a mile.
10 chains is equivalent to a furlong.
80 chains is equivalent to a mile.
1 chain is equivalent to 20.1 meters or 66 feet.
10 chains is equivalent to a furlong.
80 chains is equivalent to a mile.
10 chains is equivalent to a furlong.
80 chains is equivalent to a mile.
9
New cards
If your step count is 26 steps per chain, and you pace a distance of 74 steps, how far did you pace in meters?
10
New cards
An all-aged or uneven-aged stand is one with trees of different ages and sizes.
11
New cards
Twelve paces is equivalent to 24 steps.
Twelve paces is equivalent to 24 steps.
12
New cards
When pacing, you should come up with an individual technique to compensate for changes in step length on hillsides and slopes.
When pacing, you should come up with an individual technique to compensate for changes in step length on hillsides and slopes.
13
New cards
A distance of 12 chains and 70 links is recorded as 12.70 chains.
A distance of 12 chains and 70 links is recorded as 12.70 chains.
14
New cards
In North Carolina, during the 18th and 19th centuries, naval stores production came from which tree species?
Longleaf pine (Pinus palustris)
15
New cards
Naval stores are derived from resins (typically, oleoresins) that are considered waste products by some and protect trees from herbivory and disease.
Naval stores are derived from resins (typically, oleoresins) that are considered waste products by some and protect trees from herbivory and disease.
16
New cards
Pitch is concentrated, more solid tar
Pitch is concentrated, more solid tar
17
New cards
Turpentine wasn't particularly necessary for 18th century ship buildling. Instead, turpentine became important in the 19th century as a solvent and fuel for lamps.
Turpentine wasn't particularly necessary for 18th century ship buildling. Instead, turpentine became important in the 19th century as a solvent and fuel for lamps.
18
New cards
By 1860 (before the start of the American Civil War), turpentine was replaced by kerosene as lamp fuel and this led to a decline in the industry. In addition, after the Civil War, iron vessels replaced wooden ships and synthetic solvents replaced turpentine.
By 1860 (before the start of the American Civil War), turpentine was replaced by kerosene as lamp fuel and this led to a decline in the industry. In addition, after the Civil War, iron vessels replaced wooden ships and synthetic solvents replaced turpentine.
19
New cards
Less that one percent of the original extent of p palustris exists in the usa today, and less than 3 percent of the original extent of palustris in NC exists today
Less that one percent of the original extent of p palustris exists in the usa today, and less than 3 percent of the original extent of palustris in NC exists today
20
New cards
Cat faces refer to the pattern of slash marks made into the cambium from which resins would ooze out of a tree.
Cat faces refer to the pattern of slash marks made into the cambium from which resins would ooze out of a tree.
21
New cards
Natural longleaf pine forests are fire-dependent.
Natural longleaf pine forests are fire-dependent.
22
New cards
Today, the United States imports resin from other countries (e.g., Brazil, China, and Indonesia), while tapping some of our own Slash Pine (Pinus elliottii).
Today, the United States imports resin from other countries (e.g., Brazil, China, and Indonesia), while tapping some of our own Slash Pine (Pinus elliottii).
23
New cards
American scientific forestry (in the late 19th century) began with the idea of long-term conservation of resources in mind.
American scientific forestry (in the late 19th century) began with the idea of long-term conservation of resources in mind.
24
New cards
Where do most of NC's timberlands occur?
25
New cards
What dominates most of NC's timberlands?
26
New cards
Trees grow up from their tips, in particular, from their apical meristems.
Trees grow up from their tips, in particular, from their apical meristems.
27
New cards
Lateral meristems allow for increases and girth.
Lateral meristems allow for increases and girth.
28
New cards
Basal area means two things: It can mean the proportion of land area occupied by the cross-sectional area of tree trunks or it can mean the cross-sectional area of a single tree trunk.
Basal area means two things: It can mean the proportion of land area occupied by the cross-sectional area of tree trunks or it can mean the cross-sectional area of a single tree trunk.
29
New cards
Basal area can be calculated from DBH, using the equation for the area of a circle. Just remember to divide DBH in half to get the radius.
Basal area can be calculated from DBH, using the equation for the area of a circle. Just remember to divide DBH in half to get the radius.
30
New cards
Which of these is a reason to measure basal area? (Please select all that apply.)
A. to compare growth and productivity between stands
B. to approximate tree number and size
C. to understand resource competition among trees in a stand
A. to compare growth and productivity between stands
B. to approximate tree number and size
C. to understand resource competition among trees in a stand
31
New cards
A hypsometer is any instrument that measures tree height.
A hypsometer is any instrument that measures tree height.
32
New cards
The height (H) of a tree is equal to the tangent of the angle to a tree multiplied by horizontal distance.
The height (H) of a tree is equal to the tangent of the angle to a tree multiplied by horizontal distance.
33
New cards
A compass need in North Carolina is pointing to magnetic north, about 9 degree west of true North.
A compass need in North Carolina is pointing to magnetic north, about 9 degree west of true North.
34
New cards
Avery and Burhart (p148) suggest measuing a leaning tree on longest edge (the outside of the lean). In lecture, we said that in this class we will measure leaning trees on the shortest edge (the inside of the lean)
Avery and Burhart (p148) suggest measuing a leaning tree on longest edge (the outside of the lean). In lecture, we said that in this class we will measure leaning trees on the shortest edge (the inside of the lean)
35
New cards
Which of the following parts of a car are made with forest products? (Please select all that apply.)
A. steering wheel
B. shatterproof glass
C. rubber belts
D. dashboard
A. steering wheel
B. shatterproof glass
C. rubber belts
D. dashboard
Which of the following parts of a car are made with forest products? (Please select all that apply.)
A. steering wheel
B. shatterproof glass
C. rubber belts
D. dashboard
A. steering wheel
B. shatterproof glass
C. rubber belts
D. dashboard
36
New cards
Poles and Pilings are typically worth double the value of sawlogs. Sawlogs are typically worth double chip-n-saw.
Poles and Pilings are typically worth double the value of sawlogs. Sawlogs are typically worth double chip-n-saw.
37
New cards
Taper is the decrease in diameter we normally observe from the tree base up to the top.
Taper is the decrease in diameter we normally observe from the tree base up to the top.
38
New cards
In our class, when measuring the merchantable height of hardwoods, We always measure from 1 ft above the ground to either the point of branching/deformation or 9" DOB, whichever comes first..
In our class, when measuring the merchantable height of hardwoods, We always measure from 1 ft above the ground to either the point of branching/deformation or 9" DOB, whichever comes first..
39
New cards
If we're interested in selling small-diameter roundwood and forest-derived biomass, we can estimate merchantable bole biomass up to a top of how many inches?
4" top for merchantable bole biomass
40
New cards
We measure merchantable height up to 9" DOB for hardwoods and 8" DOB for softwoods.
We measure merchantable height up to 9" DOB for hardwoods and 8" DOB for softwoods.
41
New cards
A log is typically 16 feet long, but may be any cut bole equal to or greater than 8 ft long.
A log is typically 16 feet long, but may be any cut bole equal to or greater than 8 ft long.
42
New cards
A board foot is a measure of volume equivalent to 12" x 12" x 1" (or 144 cubic inches).
A board foot is a measure of volume equivalent to 12" x 12" x 1" (or 144 cubic inches).
43
New cards
Log rules helped me estimate the volume (in board feet) and, subsequently, the value of my 70', 26" DBH loblolly pine in the lecture.
Log rules are just formulas and talbes used to estimate volume, weight, and other attributes of standing or cut trees.
Log rules are just formulas and talbes used to estimate volume, weight, and other attributes of standing or cut trees.
44
New cards
Duke Forest uses Doyle's log rules - which tends to underestimate the volume of small logs and overestimate the volume of large diameter logs.
Duke Forest uses Doyle's log rules - which tends to underestimate the volume of small logs and overestimate the volume of large diameter logs.
45
New cards
In forestry, diversity may include metrics of size diversity (irrespective of species) and biodiversity.
In forestry, diversity may include metrics of size diversity (irrespective of species) and biodiversity.
46
New cards
comparing tree size diversity of different stands, assessing changes in tree size over time, quantifying the influence and effect of different silvicultural treatments are all ways that tree size diversity can be used in management. It can also be used to assess areas suitable for particular silvicultural treatments.
comparing tree size diversity of different stands, assessing changes in tree size over time, quantifying the influence and effect of different silvicultural treatments are all ways that tree size diversity can be used in management. It can also be used to assess areas suitable for particular silvicultural treatments.
47
New cards
The Gini Coefficient has been found to a useful measure of heterogeneity and can measure both the range and relative abundance of size classes.
The Gini Coefficient has been found to a useful measure of heterogeneity and can measure both the range and relative abundance of size classes.
48
New cards
The Gini coefficient ranges from 0 to 1, where 0 represents a normal distribution of tree diameter classes and 1 represents a inverse J-shaped and uniform distributions.
The Gini coefficient ranges from 0 to 1, where 0 represents a normal distribution of tree diameter classes and 1 represents a inverse J-shaped and uniform distributions.
49
New cards
Biodiversity is scale dependent and can refer to diversity wihtin a species, among species, and of communities, ecosystems, and landscapes.
Biodiversity is scale dependent and can refer to diversity wihtin a species, among species, and of communities, ecosystems, and landscapes.
50
New cards
Alpha diversity is made up of two sub-concepts: they are species richness and species evenness .
The two subcomponents of biodiversity among species in a defined area are 1) species richness and 2) evenness.
51
New cards
Evenness describes the variability in species abundances.
Evenness describes the variability in species abundances.
52
New cards
Uneveness distributions and low richness result in a low Shannon index.
Uneveness distributions and low richness result in a low Shannon index.
53
New cards
ENS (effective number of species) is a metric used to equate the Shannon index number with an approximate number of evenly distributed species.
ENS (effective number of species) is a metric used to equate the Shannon index number with an approximate number of evenly distributed species.
54
New cards
the stability time hypothesis of diversity has basically been debunked
the stability time hypothesis of diversity has basically been debunked
55
New cards
When a stand is sampled , it means that the characteristics of the entire stand are extrapolated from a subset of the stand.
When a stand is sampled , it means that the characteristics of the entire stand are extrapolated from a subset of the stand.
56
New cards
Estimating windthrow, regeneration, and volume are typical uses of transect samples
Estimating windthrow, regeneration, and volume are typical uses of transect samples
57
New cards
When doing a strip cruise, you need to place strips across topographic features, like streams, drains, and ridges.
When doing a strip cruise, you need to place strips across topographic features, like streams, drains, and ridges.
58
New cards
line-intersect sampling, belt transects, and strip cruise are all part of the transect sampling tradition. Angle-gauge sampling is a plotless sampling technique.
line-intersect sampling, belt transects, and strip cruise are all part of the transect sampling tradition. Angle-gauge sampling is a plotless sampling technique.
59
New cards
Variable radius plot, point sampling, angle-gauge sampling, and Bitterlisch sampling are all terms for plotless sampling.
Note, each term describes some aspect of the plotless sample (e.g., we use an angle gauge or prism to sample, we start at a central point, the plot doesn't have a single radius, and Bitterlisch developed the technqiue).
Note, each term describes some aspect of the plotless sample (e.g., we use an angle gauge or prism to sample, we start at a central point, the plot doesn't have a single radius, and Bitterlisch developed the technqiue).
60
New cards
If you are interested in the volume of large trees - because, say, you're planning a sawtimber harves - then you might use a plotless sample because it measures more of the sawtimber-sized trees and will increase the accuracy of sawtimber estimates in a stand.
If you are interested in the volume of large trees - because, say, you're planning a sawtimber harves - then you might use a plotless sample because it measures more of the sawtimber-sized trees and will increase the accuracy of sawtimber estimates in a stand.
61
New cards
There is no hard and fast rule regarding sampling intensity, but forests typically use 5%, 10%, or 20% intensities.
There is no hard and fast rule regarding sampling intensity, but forests typically use 5%, 10%, or 20% intensities.
62
New cards
Point sampling (i.e., variable radius, angle-gauge, plotless sampling), is an unequal-probability-selection sampling method.
Point sampling (i.e., variable radius, angle-gauge, plotless sampling), is an unequal-probability-selection sampling method.
63
New cards
H = D/100 * % Slope
where D is your distance from the tree and % slope is read directly from the clinometer
where D is your distance from the tree and % slope is read directly from the clinometer
H = D/100 * % Slope
where D is your distance from the tree and % slope is read directly from the clinometer
where D is your distance from the tree and % slope is read directly from the clinometer
64
New cards
Merchantable height measurements starts 1 foot off the ground, to account for the stumpage lost by
machines that can't harvest timber flush to the ground.
machines that can't harvest timber flush to the ground.
Merchantable height measurements starts 1 foot off the ground, to account for the stumpage lost by
machines that can't harvest timber flush to the ground.
machines that can't harvest timber flush to the ground.
65
New cards
A board foot is a measure of volume and is equivalent to 144
cubic inches. The number of board feet yielded by a tree or stand is usually determined by a log rule. Log rules allow foresters to estimate volume yield (in board feet) from easily measurable units, like diameter and length (in feet or logs).
cubic inches. The number of board feet yielded by a tree or stand is usually determined by a log rule. Log rules allow foresters to estimate volume yield (in board feet) from easily measurable units, like diameter and length (in feet or logs).
Log rule formulas vary in accuracy (for more on this see Avery & Burkhart 2009, pp. 113-121), and the log rules
used vary by region.
used vary by region.
66
New cards
Pacing allows foresters to quickly measure horizontal distance in the field without the use of
equipment or assistants. While this measurement is initially crude, with practice one can attain an accuracy of over 98% on level terrain
equipment or assistants. While this measurement is initially crude, with practice one can attain an accuracy of over 98% on level terrain
67
New cards
1 chain = 66 feet = 20.1 m and 1 pace = 2 steps*
1 chain = 66 feet = 20.1 m and 1 pace = 2 steps*
68
New cards
DBH. Diameter at breast height (or DBH) is "the most frequently tree measurement made by foresters (Avery & Burkhart 2002)." One reason foresters commonly measure DBH is because it is a relatively simple, direct
measurement. The other reason foresters measure DBH is because we can estimate a number of important tree attributes from this one measurement, including basal area, tree growth, and wood volume.
measurement. The other reason foresters measure DBH is because we can estimate a number of important tree attributes from this one measurement, including basal area, tree growth, and wood volume.
69
New cards
DBH Distributions. Foresters often use size-class distribution models to project future diameter distributions of a stand. These projections provide information about future yields, which foresters can use to make decisions about forest management.
To generate these distributions, foresters usually need to know the age of the stand, the stand density (i.e., the number of trees per unit area), and the site index (i.e., an indirect measurement of site productivity based on tree height and measured age). Different types of stands result in distinct DBH distributions. For example, pure (i.e., where > 80% of canopy
trees are the same species), even-age stand distributions are typically unimodal (i.e., one peak) and slightly
skewed .
70
New cards
Quadratic Mean Diameter (QMD). Foresters use the average diameter of a stand in a variety of outputs,
including yield table, stand summaries, and inventory data (Curtis & Marshall 2000). Yet, the average diameter reported is usually not the arithmetic mean, but the quadratic mean. One major difference between the arithmetic mean and the quadratic mean diameter is that the quadratic mean gives greater weight to larger trees (Curtis and Marshall 2000). In addition, using quadratic mean diameter (QDM) simplifies the construction of yield tables and stand projections, due to its exact relationship with the mean basal area per tree (see Curtis and Marshall 2000). Quadratic mean diameter (QMD) uses the two inputs, di (or the diameter at breast height of each individual tree) and n (the total number of trees).
including yield table, stand summaries, and inventory data (Curtis & Marshall 2000). Yet, the average diameter reported is usually not the arithmetic mean, but the quadratic mean. One major difference between the arithmetic mean and the quadratic mean diameter is that the quadratic mean gives greater weight to larger trees (Curtis and Marshall 2000). In addition, using quadratic mean diameter (QDM) simplifies the construction of yield tables and stand projections, due to its exact relationship with the mean basal area per tree (see Curtis and Marshall 2000). Quadratic mean diameter (QMD) uses the two inputs, di (or the diameter at breast height of each individual tree) and n (the total number of trees).
71
New cards
Arithmetic Mean & Median. The mean and median are both measures of central tendency. The arithmetic
mean is common calculated by summing the observations and dividing by the number of observations (n). So
if our observations were a sample of DBHs of 100 oak trees in a plot in Duke Forest, we would sum all the
DBHs and divide by 100.
The median is the sample observation at the midpoint (i.e., at the 50th percentile). Half of the observations
will be larger and half will be smaller in a sorted list of observations.
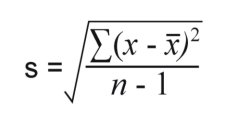
Standard Deviation. We also measure the dispersion, or the extent, of measurements using metrics like range
or variance. The standard deviation is a common metric of dispersion. The standard deviation is calculated by
summing up the squared differences between each observation and the mean and dividing it by n-1.
mean is common calculated by summing the observations and dividing by the number of observations (n). So
if our observations were a sample of DBHs of 100 oak trees in a plot in Duke Forest, we would sum all the
DBHs and divide by 100.
The median is the sample observation at the midpoint (i.e., at the 50th percentile). Half of the observations
will be larger and half will be smaller in a sorted list of observations.
Standard Deviation. We also measure the dispersion, or the extent, of measurements using metrics like range
or variance. The standard deviation is a common metric of dispersion. The standard deviation is calculated by
summing up the squared differences between each observation and the mean and dividing it by n-1.
72
New cards
When we have a normal distribution, one standard deviation around the mean usually contains 68% of the
observations and two standard deviations around the mean usually contain 95% of our observations
observations and two standard deviations around the mean usually contain 95% of our observations
When we have a normal distribution, one standard deviation around the mean usually contains 68% of the
observations and two standard deviations around the mean usually contain 95% of our observations
observations and two standard deviations around the mean usually contain 95% of our observations
73
New cards
The confidence interval (CI) tells you with 95% assurance the range that the true mean falls in. This
equation should only be used with large samples (n ≥ 30).
CI = x ± 2 * (stdev/√n)
equation should only be used with large samples (n ≥ 30).
CI = x ± 2 * (stdev/√n)
The confidence interval (CI) tells you with 95% assurance the range that the true mean falls in. This
equation should only be used with large samples (n ≥ 30).
CI = x ± 2 * (stdev/√n)
equation should only be used with large samples (n ≥ 30).
CI = x ± 2 * (stdev/√n)
74
New cards
Know the equation for QMD!!
Know the equation for QMD!!
75
New cards
BA = π(DBH/2)2
BA = π(DBH/2)2
76
New cards
The wedge prism is shallow angle prism. When viewing trees through the prism, their stems will
appear offset by a distance that varies with their distance from the prism. In the case of a 10-factor prism (which we'll be using in this class), every 33 units of distance appears offset by one horizontal unit. This means, that each tree, depending on its DBH, must be within a certain distance (called the limiting distance) to be counted "in." For example, a 12 in (or 1 ft) DBH tree must be < 33 ft from plot center to be tallied and a 24 in (2 ft) DBH tree must be < 66 ft from plot center to be tallied. Due to this relationship, when you use a 10-factor (or 10 BAF) prism, each "in" tree is equivalent to 10 sq ft of basal area.
appear offset by a distance that varies with their distance from the prism. In the case of a 10-factor prism (which we'll be using in this class), every 33 units of distance appears offset by one horizontal unit. This means, that each tree, depending on its DBH, must be within a certain distance (called the limiting distance) to be counted "in." For example, a 12 in (or 1 ft) DBH tree must be < 33 ft from plot center to be tallied and a 24 in (2 ft) DBH tree must be < 66 ft from plot center to be tallied. Due to this relationship, when you use a 10-factor (or 10 BAF) prism, each "in" tree is equivalent to 10 sq ft of basal area.
77
New cards
Plotless sampling does not require measured quadrats or plots to sample vegetation. In this course, you were first introduced to plotless sampling (AKA: variable radius plot, point sampling, angle-gauge sampling, or Bitterlisch sampling) when you sampled the basal area (BA) of the longleaf pine stand.
Plotless sampling enables foresters and ecologists to complete forest inventories quickly. In particular, plotless sampling allows for more efficient sampling of basal area, number of stems by diameter class, and mortality (Kangas 2006 and
references therein). In contrast, fixed area sampling allows for more efficient sampling of the number of total stems
78
New cards
The coefficient of variation is a measure of relative standard deviation. Since this statistic is calculated on a percent scale, it allows you to get a sense of the spread of your data without being confused by units.
To calculate the coefficient of variation, please use the following equation:
CV% = (stdev / mean) x 100
To calculate the coefficient of variation, please use the following equation:
CV% = (stdev / mean) x 100
79
New cards
Fixed-area plot sampling is a technique that measures trees within a pre-determined number of fixed-area plots. Plots are commonly designed as squares, rectangles, circles, or strips. Since the plots are of known area, the values from those plots should scale proportionally to the entire stand. Plots may be chosen randomly, stratified to account for some feature of the landscape or stand (e.g., slope, age class), or laid out systematically in a grid pattern. Each of these methods have advantages and draw backs. For example, random plots may miss an important soil type, and systematic plots may too closely correspond with a regularly spaced topographic feature, missing finer-scale topographic variations.
Another feature of fixed-area plots is that one will typically measure more small-diameter trees than large-diameter trees, because most forests have more small-diameter trees. This may not be desirable, especially if one is interested in merchantable timber. One solution is to create sub-plots within a fixed-area plot (AKA nested plots). In this, one can measure all of the large trees (e.g., > 6" DBH) in the entire plot and only measure small trees (e.g., < 6" DBH) in the smaller sub-plot.
Another feature of fixed-area plots is that one will typically measure more small-diameter trees than large-diameter trees, because most forests have more small-diameter trees. This may not be desirable, especially if one is interested in merchantable timber. One solution is to create sub-plots within a fixed-area plot (AKA nested plots). In this, one can measure all of the large trees (e.g., > 6" DBH) in the entire plot and only measure small trees (e.g., < 6" DBH) in the smaller sub-plot.
80
New cards
allometric equations are used to estimate difficult-to-measure variables (e.g., biomass) from easily measured and well-correlated variables (e.g, DBH or height). To develop these equations, hundreds of trees have been harvested,
separated into parts (e.g., foliage, branches, bark, wood, roots), and dried to estimate oven-dry biomass.
To estimate the C stock of the aboveground tree biomass, assume that C content is half of the oven-dry biomass
separated into parts (e.g., foliage, branches, bark, wood, roots), and dried to estimate oven-dry biomass.
To estimate the C stock of the aboveground tree biomass, assume that C content is half of the oven-dry biomass
81
New cards
If a stand is fully stocked, with trees effectively occupying the space while still having room to grow, a manager may take no action. If a stand is overstocked, with trees growing in a space so completely that growth is suppressed, a manager might need to thin. If a stand is understocked, with too few trees occupying a space,
the manager might plant
the manager might plant
82
New cards
To determine whether a stand is over- or understocked, a forest manager might refer to a stocking guide. Stocking guides use attributes such as basal area, tree density, and average tree diameter to provide guidelines that help forest managers make decisions. Stocking guides vary with tree species, stand age (e.g., even-aged or mixed), and location.
To determine whether a stand is over- or understocked, a forest manager might refer to a stocking guide. Stocking guides use attributes such as basal area, tree density, and average tree diameter to provide guidelines that help forest managers make decisions. Stocking guides vary with tree species, stand age (e.g., even-aged or mixed), and location.
83
New cards
Relative Density
Relative density is a term that is used differently by foresters than ecologists. For a forester, relative
density is the density of a stand compared to the maximum density common in a stand of similar age and composition.
This metric helps forest managers know if their stand is over- or understocked. For an ecologist, relative density is the
density of one plant species as a percent of the total density. Ecologists use this metric to assess the relative dominance
of a species in an ecosystem or habitat.
84
New cards
Both forest managers and ecologists may have an interest in plant diversity. Diversity usually includes
the richness (or number) of species in an area and how evenly (in what proportion) those species occur. Ecologists have
developed a number of indices to assess diversity. A popular diversity index is the Shannon index
the richness (or number) of species in an area and how evenly (in what proportion) those species occur. Ecologists have
developed a number of indices to assess diversity. A popular diversity index is the Shannon index