chap 4: review microsoft excel
1/65
There's no tags or description
Looks like no tags are added yet.
Name | Mastery | Learn | Test | Matching | Spaced | Call with Kai |
|---|
No analytics yet
Send a link to your students to track their progress
66 Terms
excel as a data analytics tool: advantages: commonly
installed
excel as a data analytics tool: advantages:
familiarity
excel as a data analytics tool: advantages: visual
tabular display
excel as a data analytics tool: advantages: flexible organization of
data and calculations
excel as a data analytics tool: advantages: lower
learning curve
excel as a data analytics tool: disadvantages: general
purpose tool
excel as a data analytics tool: disadvantages: designed for
smaller data sets
excel as a data analytics tool: disadvantages: limited
functions
excel as a data analytics tool: disadvantages: limits
on data size
excel as a data analytics tool: disadvantages: detecting
calculation errors
copying and pasting: the original source must be
in a delimited format
copying and pasting: the delimitation is need to spread the
data across the column for each row
copying and pasting: tab-delimitation format can be
directly placed into an excel worksheet
copying and pasting: data not delimited by tabs are
not automatically split across columns.

copying and pasting: data in a tab-delimited format can be
directly placed into an Excel worksheet

copying and pasting: comma-delimited text can be copied and pasted in excel,
but the data are not automatically distributed across the cells and must be converted.

copying and pasting: a comma-delimiated format can also
create a problem if a comma is part of the text

copying and pasting: a pipe-delimited format is often used instead of a
comma-delimited format because the pipe is never used within the text

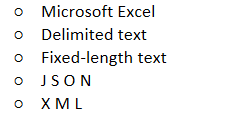
import - source options:
Microsoft Excel
Delimited text
Fixed-length text
J S O N
X M L
import - source options:
Microsoft Access
SQL Server
Oracle
MySQL

import - source options: services
Meta (Facebook)
Salesforce
Microsoft Azure

AVERAGE
Calculates and returns the average value for the defined set of cells

COUNT
Determines the number of cells containing a value for a defined set of cells

COUNTA
Determines the number of cells for a defined set of cells; including empty cells

FREQUENCY
Returns a distribution of the frequency for each value in a defined range of cells

MAX
Calculates and returns the largest value within a defined set of cells

MEDIAN
Calculates and returns the median value within a defined set of cells

MIN
Calculates and return the smallest value within a defined set of cells

MODE
Calculates and returns the most common value within a defined set of cells

STDEV
Calculates and returns the standard deviation of the values within a defined set of cells

SUM
Adds all values within a defined set of cells and returns the total value

INT
Rounds the input value rounded to the nearest integer value

MOD
Returns the remainder after a number is divided by a divisor

PI
Represents the value of Pi or returns the value of Pi

POWER
Returns the input value raised to the defined power

RAND
Returns a randomized decimal value between 0 and less than 1

ROUND
Rounds the input number to the define precision and returns the result

SQRT
Calculates the square root of the input value and returns the result

TRUNC
Truncates the input number by the defined precision and returns the result

conditional operators: function that uses parameters to determine
different responses based on the input
conditional operators: example
IF(E4 <> 10 AND E4 > = 15, 1, 2)

conditional operators: IF function uses parameters to determine the response when a
specific condition is met and an alternate response when the condition is not met

AND
Requires both conditional tests to be true in order to return a true value

NOT
Requires both condition not to be true in order to return a true value

OR
Requires either conditional test to be true in order to return a true value
=
Used to determine if the input value is equal to the test value

<>
Used to determine if the input value is not equal to the test value

>
Used to determine if the input value is greater than the test value

<
Used to determine if the input value is less than the test value

>=
Used to determine if the input value is greater than or equal to the test value

<=
Used to determine if the input value is less than or equal to the test value

named ranges: ranges allow sets of data to be referenced by a name of the
analyst’s choosing rather than by cell coordinates

named lookups: XLOOKUP function is used to take an input value, lookup the value in a reference table and
return a corresponding value
named lookups: the key to using the XLOOKUP function is to first have a
reference data range set up in the form of a table.

named lookups: XLOOKUP function formula include the cell with for the input value, the named range that the
value will be compared to, and the corresponding Named Range with the response variable

pivot table: categorizes and aggregate data into a
more meaningful form
pivot table: takes raw data and transforms them
into categories and summaries
pivot table: detailed data must be
structured properly
pivot table: data must be set in named columns where each column represents
different attributes of the same entity
filters: by default, the tables will
include all rows
pivot table: enable the pivot table to
limit the row
rows: determine groupings of
the results
rows: can include more than
one field in the rows area
values: columns in the data set
that are to be aggregated
columns: values displayed in the
table
columns: aggregate calculation of the
detailed data