Intermediate Macroeconomics Exam 2
1/33
There's no tags or description
Looks like no tags are added yet.
Name | Mastery | Learn | Test | Matching | Spaced | Call with Kai |
|---|
No study sessions yet.
34 Terms
How do you find the steady state level of population N* in the Malthus Model
USE THESE TWO KEY EQUATIONS:
N’/N = g(C/N)
C = Y = zf(L,N)
Start with the fact that N’/N = g(C/N), then plug C = zf(L,N) into the equation.
Since N’/N = 1, we can set g(zf(L,N)/N) = 1 and solve for N*
What are the key steady state equations in the malthus model?
c = y = zf(l)
N’/N = g(c)
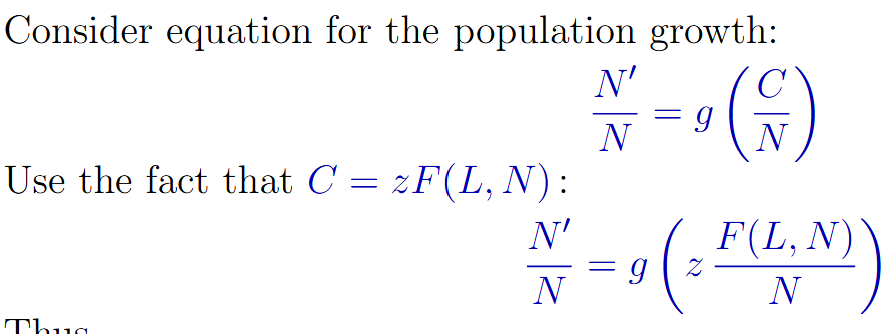
How do you graph with the Malthus Model
Plot two equations on two different graphs:
find c* from graph 2, then find l* from graph 1 using c*.
How do you find the equation that describes how aggregate capital tomorrow depends on today with the Solow Model
USE THESE THREE KEY EQUATIONS:
K’ = I + (1-d)K
I = S
Y = zF(K,N)
Start with the Aggregate Capital Evolution equation K’ = I + (1-d)K
Then, plug in S for I (likely given)
Finally, plug in the Y that was added from adding S.
From this, we get K’ = szF(K,N) + (1-d)k
How do you find the per worker production function with the Solow Model
USE THESE TWO KEY EQUATIONS
y = Y/N
Y = zF(K,N)
Start with y = Y/N, then plug in Y to get y = zF(K,N)/N
Because of constant returns to scale, we can write this as zF(K/N,N/N)
Since K/N = k and N/N = 1, we get y=zf(k)
How do you rewrite the equation that describes how aggregate capital tomorrow depends on today in per-capita terms with the Solow Model
USE THESE THREE KEY EQUATIONS:
k = K/N
y = Y/N
c = C/N
We use the equation we already found, K’ = szF(K,N) + (1-d)K, and divide by N:
K’/N = szf(k) + (1-d)k
We need to rework K’/N by multiplying it by N’/N’. This should give us something like k’(1+n) = szf(k) + (1-d)k
We can rewrite this as k’ = (szf(k) + (1-d)k)/(1+n)
How do you find steady-state capital per worker k*?
USE THIS KEY EQUATION:
k = k’ = k*
Plug k* into our per-capita aggregate capital equation and solve for k*
What is the growth rate of aggregate variables in the Solow Model steady-state?
All aggregate variables grow at a rate of n. To prove this:
k’ = k => K’/N’ = K/N => K’/K = N’/N => K’/K = 1+n
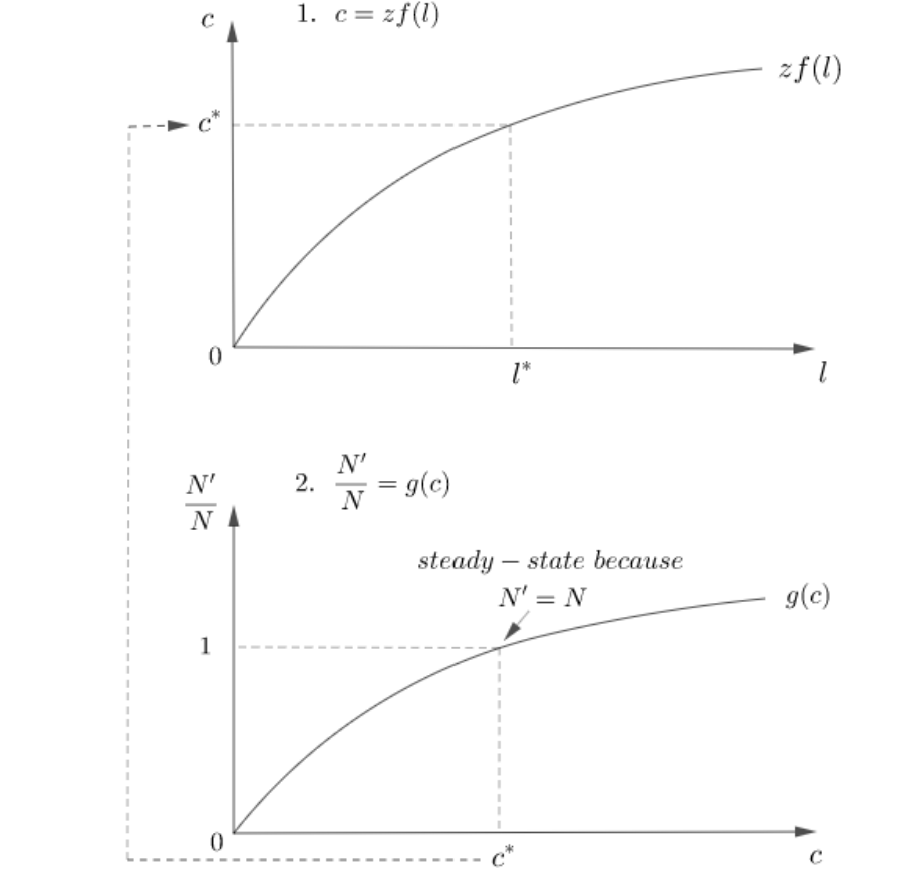
How do you graph with the Solow Model
Make a single graph with the x-axis labeled k and the y-axis unlabeled. Draw the (n+d)k line (straight, increasing) and the szf(k) line. Where they intersect is the steady-state k*.
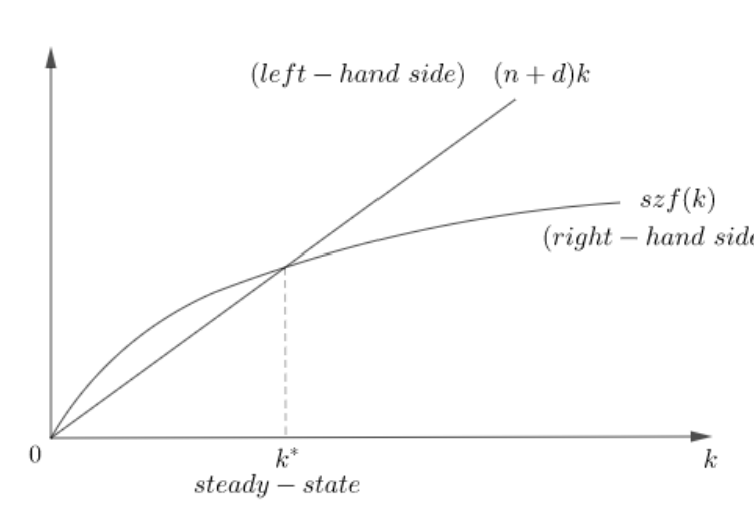
How do you graphically show consumption with the Solow Model
To show consumption, add the output line y=zf(k) above szf(k). The distance between zf(k) and szf(k) at k* is consumption.
What are the assumption equations with the Solow Model
N’/N = (1+n)
Y = zF(K,N)
Y = sY + (1-s)Y
K’ = I + (1-d)K
I = S = sY
How do you find the golden rule saving state and capital graphically?
The line parallel to (n+d)k and tangent to zf(k) touches zf(k) at the golden rule capital k*gr. The golden rule saving rate s*gr is the one that yields k*gr
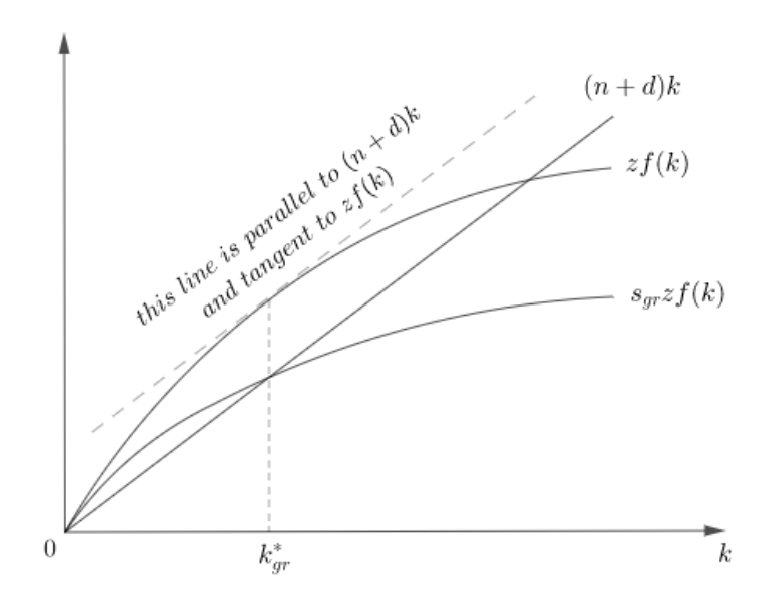
How do you find the golden rule capital analytically?
USE THESE THREE KEY EQUATIONS:
c = (1-s)y
y = zf(k)
szf(k)=(n+d)k (steady state)
Start with the equation c = (1-s)y, then plug in zf(k) for y. This gives you zf(k) - szf(k). Since in the steady state, szf(k)=(n+d)k, we now have:
c = zf(k) - (n+d)k → max k.
In order to maximize k, we have to take a partial derivative with respect to k and set it equal to 0, which gets us zf’(kgr) - (n+d) = 0, and in turn, zf’(kgr) = n + d. From here, just solve for k*
How do you find the golden rule savings rate analytically?
USE THIS KEY EQUATION:
szf(k)=(n+d)k (steady state)
After finding the steady state capital, plug that into szf(kgr) = (n+d)kgr, and try your best to solve for s.
What is the golden rule saving rate / golden rule capital
The golden rule saving rate is the saving rate which produces the highest consumption. The corresponding steady-state capital is the golden rule capital.
What is the growth accounting formula?
gy = gz + agk + (1-a)gn
Solve for a
How do you find the current period budget constraint?
Set c = Income ± taxes/subsidies - s.
ie: c = y - t - s
How do you find the future period budget constraint?
Set c’ = Income ± taxes/subsidies + s(1+r).
ie: c’ = y’ - t’ + s(1+r)
How do you find the lifetime budget constraint?
First, solve for s in the current period budget constraint.
Next, plug this s into the future budget constraint.
Finally, rearrange the expression so that consumption is on the left and disposable income is on the right, and divide both sides by (1+r)
ie: s = y - t - c
c’ = y’ - t’ + (y - t - c)(1+r)
c’ = y’ - t’ + (y-t)(1+r) - c(1+r)
c + c’/1+r = y-t + y’-t’/1+r
we = y-t + y’-t’/1+r
Where does the endowment point go?
The endowment point corresponds to the situation when the consumer does not save and does not borrow, so s=0. Consumers on the left save, while consumers on the right borrow.
Log-preferences
lnc + θlnc* → max c,c*
s.t. c + Bc* = F
c = 1/(1+θ) * F
c* = θ/(1+θ) * F/B
Perfect Complements
min{c, θc*} → max c,c*
s.t. c + Bc* = F
Set c = θc*
Plug into BC: θc* + Bc* = F
c* = F/(θ+B)
c = θc* = θF/(θ+B)
Perfect Substitutes
c + θc* → max c,c*
s.t. c + Bc* = F
Substitute constraint out: c = F - Bc*
F - Bc* + θc* → max c*
F + (θ-B)c* → max c*
If θ>B, set c* as LARGE as possible.
If θ<B, set c* as small as possible.
Rigid Preferences
ⓒ is exogenously fixed constant
c + Bc* = F
ⓒ + Bc* = F
c* = (F - ⓒ) / B
c = ⓒ
One-sided preferences
lnc → max c,c*
c + Bc* = F
c = F
c* = 0
Second Middle Of The Night Equation
c = y - t - s
s = y - t - c
What is the government’s budget constraint in the current period?
G = Nt + B
What is the government’s budget constraint in the future period?
G’ = Nt’ - B(1+r)
How do you find the government’s lifetime budget constraint
First, solve for B in the current period budget constraint.
Next, plug this B into the future budget constraint.
Finally, rearrange the expression so that consumption is on the left and disposable income is on the right, and divide both sides by (1+r)
ie: B = G - Nt
G’ = Nt’ - (G - Nt)(1+r)
G + G’/1+r = Nt + Nt’/1+r
What does a change in the timing of taxes do without market frictions
It moves the endowment point, as the savings change due to tax cuts/tax spikes. The interest rate does not change due to Ricardian equivalence.
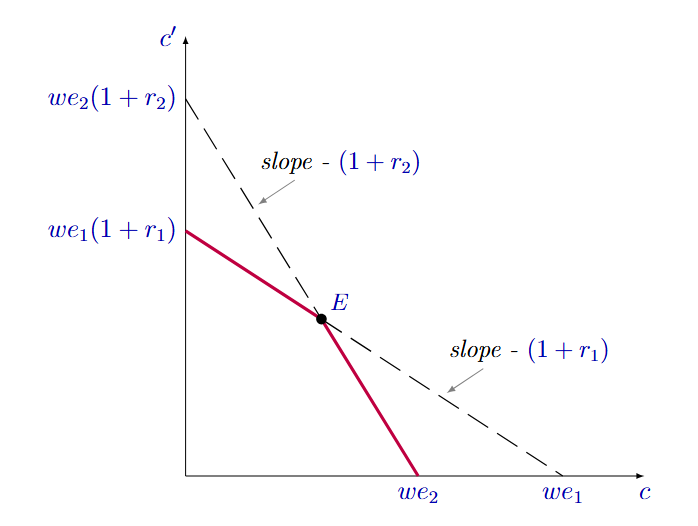
What does a change in the timing of taxes do when the consumer faces two different interest rates, one for lending and one for borrowing?
We get two different we1 and we2, one for saving and one for lending. We plot both of these on the graph, where we1 > we2, but we2(1+r2) > we1(1+r1). Then we remove the unattainable points and are left with a kinked graph.
Ricardian equivalence no longer holds, since r1 ≠ r2. This leads to a change in the line AND endowment pine.
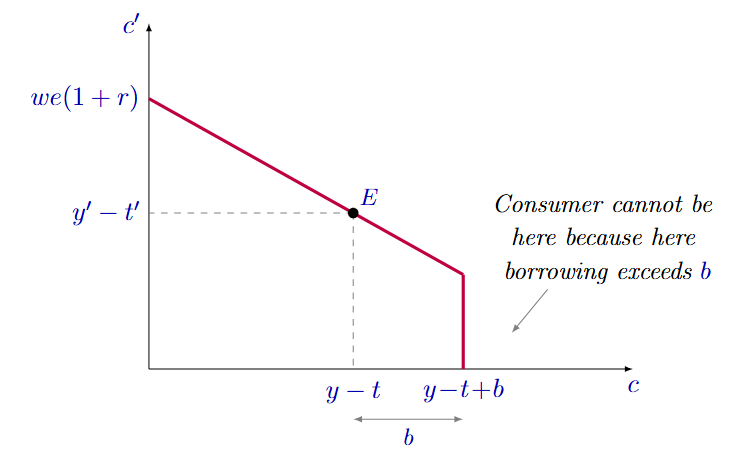
What does a graph with a borrowing limit look like?
It loooks similar to the base two-period model graph, but with a kink at y-t+b, because the consumer cannot borrow more than b.
What is the government budget constraint with Social Security?
Nb = N(1+n)t
How do we know if social security is good or bad for the consumer
wess = we + b((n-r)/(1+n)(1+r))
If n (return on social security) is greater than r (return on regular savings), then social security is good for the consumer. If n is less than r, then social security is bad for the consumer.