Investigating Science Year 11 Prelims
1/171
There's no tags or description
Looks like no tags are added yet.
Name | Mastery | Learn | Test | Matching | Spaced |
|---|
No study sessions yet.
172 Terms
Observation
Observation refers to noting or recording a result, occurrence, or phenomenon. Information that has been acquired through any of the senses including sight, hearing, taste, feeling and smell
What do observations allow us to do?
Invent new tools, discover natural laws and explore the mysteries of the universe
Direct observation
Uses our senses e.g. using our eyes to see the stars
Indirect observation
Uses tools, like thermometers or microscopes e.g. using a telescope to view the sky in detail
What is the role of observations in science?
Collect and record data
Construct hypotheses
Test hypotheses (experimentation)
Make conclusions
Produce theories
How are observations useful in investigations?
Can instigate scientific inquiry by providing researchers with a starting point
Can provide a means of gathering data
Can be used as evidence to investigate a hypothesis
What do observations lead to?
Collecting data
Making inferences
What are the types of data?
Qualitative observations (Descriptive)
Quantitative observations (Numerical)
What are the quantitative and qualitative observations of burning a candle?
Qualitative observation: Candle slowly extinguishes and water level rises and eventually stops
Quantitative observation: Time taken for candle to extinguish, final water level
Inferences
Use information or data to make conclusions to suggest a reason why we observe something.
Based on this observation: A specific bird species always builds its nest in a particular type of tree. What inference can be made?
The bird prefers that tree because it provides a suitable habitat for raising young.
What inferences can be drawn from burning a candle?
With no flame, the temperature and pressure inside the container decreases
The pressure inside and outside the container tries to equalise, forming a vacuum.
A vacuum is caused by the loss of heat from the candle being out.
The water is sucked up into the container until the pressure is balanced.
What are the quantitative and qualitative observations of Rock Strata?
Qualitative observations: Texture, colour, layering of pattern
Quantitative observations: Layer thickness, dip angles
What inferences can be drawn from Rock Strata?
By examining the order, composition, and fossil content of Rock Strata layers, geologists can infer past environments, geological events, and the evolution of life.
Bernoulli Effect
Bernoulli’s principle describes the relationship between fluid (liquid or gas) speed and pressure: faster-moving fluids have lower pressure, and slower-moving fluids have higher pressure.
What are the quantitative and qualitative observations of the Bernoulli Effect?
Quantitative observations: Measurable decreases in fluid pressure as fluid velocity increases.
Qualitative observations: Effects like a stream of air pulling nearby objects together or a shower curtain moving inward when water flows, showing that faster-moving fluid creates lower pressure.
King Hiero’s Crown
King Hiero commissioned a royal crown with a local goldsmith
The goldsmith returned the finished product, but King Hiero was suspicious of the goldsmith.
He wondered if the goldsmith had only used some of the gold he had given him and filled the rest of the crown with silver, keeping the extra gold for himself.
King Hiero then hired Archimedes to investigate and determine whether his suspicions were correct.
Density
Measure of how much “stuff” is packed into the volume of an object. P = m/v
Archimedes’ experiment
Archimedes experimented with this process by having replicas of the crown made: one made of pure silver and the other of pure gold. Both replica crowns had the same weight but different sizes.
Archimedes put the silver crown in the water, and collected and measured the volume of the water that overflowed. Then, he repeated the process with the golden crown.
As the silver crown was larger (because its density was lower), it displaced more water as it had a larger volume.
Then, testing King Hiero's crown, Archimedes saw it displaced more water than the replica golden crown. This meant that it had a larger volume, and indicated that it was not made purely of gold.
Fleming’s experiment
Fleming left a petri dish with bacteria next to an open window for a few weeks
When he next checked the bacteria-filled dish it had been contaminated with mould and the mould was ‘eating away’ at the bacteria
Fleming identified the substance in the mould responsible for killing the bacteria and named it penicillin.
Galileo observing Jupiter’s Moons observation and inference
Observed that moons were orbiting around Jupiter
Inference: Planets orbit the sun
Geocentric Model
Earth is the centre of the universe
Heliocentric model
Planets orbit the sun
Phases of Venus
Galileo observed that the phases of Venus were similar to the phases of our moon
Galileo inferred that both bodies must have the same light source, the sun and that the way the phases appeared meant that the geocentric model was incorrect
Jupiter’s moons
Galileo observed how Jupiters moons followed a pattern every month
Galileo inferred that this pattern showed that Jupiter also had other bodies orbiting it and Earth was not the only planet that had things orbiting it, disproving the geocentric model
What does observing the behaviour of plants, animals and weather help with?
Helps with determining when to hunt, fish and gather
What does observing changes in animal migration patterns, breeding habits and feeding behaviour help with?
Informs conservation strategies
Firestick farming
A land management technique that uses fire to manage the landscape.
Describe an example of a way in which Aboriginal and Torres Strait Islander Peoples have used observation and inference to develop an understanding of Country and Place in order to create innovative ways of managing the natural environment. (Firestick farming)
Aboriginal and Torres Strait Islander peoples used fire-stick farming as a way to manage the natural environment. Through careful observation over thousands of years, they noticed that small, controlled burns using patch burning encouraged new plant growth, attracted grazing animals like kangaroos. From these observations, they made the inference that fire could be used deliberately as a land management tool. By applying this knowledge, they created a mosaic of burnt and unburnt land that maintained biodiversity, provided reliable food sources through hunting and ensured the long-term sustainability of Country.
Aboriginal people used observation to notice how naturally occurring bushfires cleared old vegetation, encouraged new plant growth, and attracted animals to graze on the fresh shoots. From this, they made the inference that if fire was used deliberately in small, controlled ways, it could be a tool for managing the land. This practice, known as firestick farming, created patchworks of burnt and unburnt areas that promoted biodiversity, made hunting easier, protected important plants, and reduced the risk of large destructive bushfires. In this way, careful observation and inference allowed Aboriginal peoples to develop an innovative and sustainable method of managing the natural environment.
Describe an example of a way in which Aboriginal and Torres Strait Islander Peoples have used observation and inference to develop an understanding of Country and Place in order to create innovative ways of managing the natural environment. (Medicinal plants)
Observations made by Aboriginal people were a vital part to the implementation and use of natural medicines and remedies within their society. This is because through these observations they allowed Indigenous people to recognise and utilize the healing and beneficial properties of plants and nature. These observations were crucial, as the necessary information gathered was passed down through generations, carrying through their traditions and culture that we now know due to their careful observations of nature, and how they survived for 60 000+ years. An example of how observations conducted by Indigenous people further leading to the development of natural medicines is seen through the properties in which they uncovered within tea tree leaves. The indigenous concluded through their observations that tea tree leaves had natural healing properties which helped relieve colds, prevent wound infections and clean up skin. These observations made by Aboriginal people amongst their day-to-day environmental interactions highlights how critically and effectively they observed and studied their surroundings in which enabled the refinement of traditional medicinal practices and laid the foundations of modern-day medicine.
Aboriginal and Torres Strait Islander Peoples closely observed the natural properties of plants like the tea tree. They noticed that when the leaves were crushed, they released oils with a strong smell and that applying these leaves to wounds or infections reduced swelling and promoted healing. From these observations, they made the inference that tea tree leaves contained medicinal properties and could be used as natural antiseptics. This understanding led to innovative environmental management practices, as tea trees were carefully harvested and used sustainably, ensuring the resource was never depleted. By combining observation with inference, they developed a sophisticated knowledge of bush medicine that not only managed human health but also reflected a deep respect for and sustainable interaction with Country.
European settlers did not always appreciate the agricultural practices of First Nations Peoples. However, these Peoples had many practices based on observations and inferences that helped them survive. Evaluate some biases that may have affected scientific thinking of European settlers regarding the agricultural practices of First Nations peoples
Racial biases:
European settlers believed people with darker skin were ‘inferior’ and would be less likely to listen to them and so they didn’t believe in their agricultural practices
As ATSI peoples were all black at the time, the settlers thought that their ideas (fire-stick farming, seasonal harvesting) were not as good as European ones (fencing, ploughing)
Not technological:
European settlers were in the age of the Industrial Revolution, to them technologies were the best way to get things done and didn’t believe in traditional methods
Nomadism:
Seasonal rotation of harvesting areas was wrongly seen as nomadism rather than a sustainable system to prevent overuse of the land and European people thought it was inferior
Eurocentric perspective:
They had experienced their way of doing things to be highly successful in the past
They thought that Aboriginal peoples controlled burning, management of native plants, firestick farming, natural fertilisers, rotational hunting and crop rotation were inferior and underestimated the First Nations’ peoples ecological knowledge
They thought their own agricultural practices were advanced and efficient while First Nations peoples were primitive and backward
Failed to understand the sophisticated land management systems of First Nations peoples
Geological Strata
Stacked-up layers of rock in the Earth’s crust
Layers often represent different geological periods
Qualitative and Quantitative data we can collect from Rock Strata
Qualitative: Rock type, colour, shape
Quantitative: Elevation, layer thickness, grain size
Outline 2 ways in which observations may be enhanced by using digital thermometers over analogue thermometers
Show an exact reading of the temperature and remove possibility of human error
Digital thermometers are more precise than analogue thermometers
What are the disadvantages of digital technology
Expensive
Discuss how observations have been limited by observation tools and how their improvement has helped develop knowledge
Used to believe that Earth was the centre of the universe due to our lack of observational tools as we were only able to see planets as we only had the naked eye meaning our knowledge of the universe was restricted and we believed in the geocentric model
Galileo developed his own telescope by improving the tool of the naked eye and observed the phases of Venus as being similar to our moons and this helped develop knowledge leading to the creation of the heliocentric model
As telescopes continued to improve, later tools such as radio and space telescopes allowed scientists to observe galaxies, black holes, and cosmic background radiation, further expanding knowledge of the universe
This shows how better observation tools overcome earlier limitations and lead to major scientific breakthroughs
Spectroscopy
Study of different wavelengths of light
How could spectroscopy be used as evidence for the Big Bang?
Spectroscopy splits light from galaxies into a spectrum, showing characteristic absorption/emission lines
Observations show these lines are redshifted (shifted towards the red end of the spectrum).
Redshift indicates galaxies are moving away from us.
This means the universe is expanding.
If the universe is expanding now, it must have started from a much smaller, denser state.
This provides strong evidence for the Big Bang theory.
Why is the Hubble Space Telescope superior to those on Earth and how has it benefitted astronomy?
The Hubble Space Telescope is superior to Earth-based telescopes because it orbits above the atmosphere, avoiding distortion, weather, and light pollution, while also detecting wavelengths like ultraviolet and infrared that are blocked on Earth.
This has led to clearer, sharper images and uninterrupted observations. Hubble has greatly advanced astronomy by helping determine the age of the universe, providing evidence for dark energy, revealing how galaxies evolve through deep-field images, and even analysing exoplanet atmospheres. Its discoveries have not only transformed scientific knowledge but also inspired global public interest in space.
Assess the impact of observation tools on scientists’ observations of the universe
The development of observation tools has had a profound impact on scientists’ understanding of the universe. Early naked-eye observations limited knowledge to visible stars and planets, supporting incorrect models like the geocentric theory.
With the invention of the telescope, astronomers such as Galileo were able to observe Jupiter’s moons and the phases of Venus, providing evidence for the heliocentric model.
Later, improved telescopes, including the Hubble Space Telescope, allowed scientists to see distant galaxies, measure redshift, and refine the age and expansion rate of the universe.
These technological advances show that as observation tools improve, they overcome earlier limitations, enabling new discoveries and significantly expanding scientific knowledge of the universe.
How can we use data to form further research questions?
Check for any inconsistencies in our data
Investigate unexpected results
Analyse untested variables
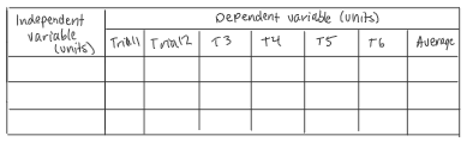
Independent variable
The variable we change
Dependent variable
The variable that we measure
Controlled variables
The variables that we keep constant
Reliability
Reliability refers to how consistent data is in repeated measurements. The experiment should be undertaken at least 3 times with consistent results and an average must be calculated to ensure that the results are reliable and trustworthy.
Accuracy
Accuracy refers to whether the results are close to the "true value". So, the quality of the measuring apparatus and the skill of the scientists taking the measurement affects accuracy. If the apparatus is faulty or the scientists make a mistake, the measurement may be inaccurate.
Validity
Validity refers to how suitable the method is and if all variables are identified and controlled appropriately to the aim of the experiment.
How can you increase validity of an experiment?
Controlling Variables
Ensure that 1 variable is being changed and 1 being measured and the rest are constant
Data
Any information or facts we collect or observe during a scientific investigation
Primary data
Data collected for the first time through original research methods e.g. surveys, experiments, observations
Secondary data
Data someone has previously collected, organised, and analysed by someone else e.g. books, magazines, newspapers, government publications
What are some different data collection methods?
Experiments (primary)
Observational studies (primary)
Case studies (secondary)
Surveys (primary)
Line graphs
Used to visualise trends over time for continuous variables
Useful for comparing multiple trends or variables on a single graph
Scatter plot
Used to analyse the relationship between 2 continuous variables
Used to display the overall trend or pattern in the data in order to compare variables
Bar graph
Used to compare categorical data like colour or blood type
How can qualitative data be represented as a visual or digital representation?
Images
Photos
Diagrams
How can quantitative data be represented as a visual or digital representation?
Tables
Graphs
Maps
How would you use visual and digital representations to collect data?
Sensors
Imaging
3D modelling and simulations
Draw
To reach a conclusion through deduction or inference
How to draw conclusions based on data?
Describe any trends, patterns, relationships and consider any limitations
Positive correlation
Two variables increase together
Negative correlation
One variable increases while the other decreases
Exponential increase
Variable increases at an accelerating rate (steep upward curve)
Exponential decrease
Variable decreases at an accelerating rate (steep downward curve)
Why do we assess scientific findings?
To help validate our results
To understand the significance of our results
To identify new questions for further exploration
Tabulation
Easy for results comparison
Sometimes results table format can be difficult
Efficient way to record quantitative data
Purpose of a table is to allow peers to review the results of an investigation without having to decode long scientific jargon
Graphing data
Visual representation of results
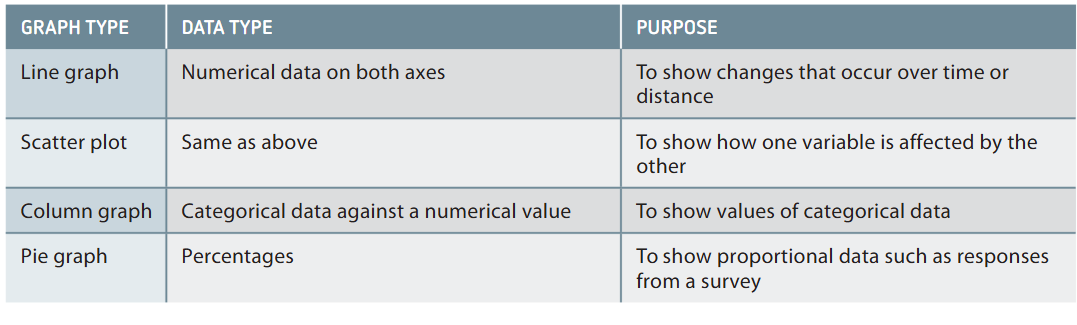
Line graph vs scatter plot
Line graph: The data points are connected sequentially and the order matters e.g. Temperature over a week.
Scatter plot: You want to show the relationship/correlation between two variables e.g. Hours studied vs. test score
How to construct your table?
Writing a conclusion
You conclusion should:
• State what the results of the experiment indicate
• Link to the aim of the experiment
• Include actual values from your results to support your claim
I like to start my conclusion by writing "The results indicate..." DON'T SAY PROVE. Say support, reject
Example: The results do not support the hypothesis that as boiling time increased, voltage increased from 0.2 volts for raw to 9.6 volts for 10 minutes.
Discussion
The discussion is where the trends indicated by the results are discussed. This is also where validity, reliability, accuracy, errors and uncertainty is discussed. Each aspect is multifaceted and should be discussed in depth.
CUTLAS
Crosses
Units
Title
Label both axes
Axis
Straight line of best fit
Size
Why process toxic plants for bush tucker?
Native plants were an essential part of Aboriginal peoples diet and nutrition
When other food was scarce, they needed to make these foods safe to eat
How did Aboriginal peoples use toxic plants to make them edible?
Made careful observations of plants, animals and the environment
Led to inferences of plant edibility and processes for ridding them of toxicity
Methods used by Aboriginal people to transform inedible plants to edible staple foods (Australian Cycads)
Crushing the kernels are pounded into smaller pieces helping leach out the toxins
Soaking for several days which allows the toxins to dissolve and be carried away by the water
Drying in the sun to reduce moisture and prevent rotting
Cooking as Aboriginal people observed that cooking or heating the fruit makes it taste better, breaks down the toxins from food and no-one gets sick
Aboriginal and Torres Strait Islander Peoples used the fruit of cycad and used it as a food
source. They developed methods to remove toxins from cycads that allowed cycad seeds to
become a rich food source. Different methods were used to achieve this. Seeds were removed
from husk and then cooked and leached in running water overnight to remove the toxins.
Another method was to dry the seeds and then leached in running water for 3-5 days.
Fermentation was also used as a method to remove the toxins.
How were Aboriginal people able to locate sources of freshwater within bodies of salt water?
Observing specific behaviours like birds soaring or gathering inland, they can infer there are nearby freshwater sources
Different plant species thrive in freshwater and saltwater environments so they can infer there is freshwater in some areas
What are the 4 techniques used by Aboriginal people to locate freshwater?
Technique | Description |
Gnammas/Rock Holes | Natural depressions in rocks that collect and store rainwater and doesn't drain away after the rain
|
Impoundments/Clay dams | Small dams built in clay soils to trap and store surface water after rainfall. These acted like reservoirs, holding water for use during drier times. |
Tree roots | Certain trees (e.g., eucalyptus) hold fresh water in their roots. Aboriginal Peoples would dig up roots, cut them into pieces, and drain the water by squeezing or sucking. |
Kappi wodern | Freshwater feeds into reefs through underground springs that come up from the water table. During low tides or days without wind, freshwater rises because it has a lower density than saltwater, and it floats on the top. |
What are key qualitative methods used to collect data on water quality?
Water colour
Plant and animal species
What are the key quantitative methods used to collect data on water quality?
Measuring pH, temperature and dissolved oxygen
How can you use secondary sources to validate inferences and conclusions?
You might find that other studies come to the same conclusions so your conclusion is solid + adds a level of credibility to your findings
Why gather secondary source research before planning an investigation?
Make informed inferences based on existing knowledge
Allows us to develop focused inquiry questions that address gaps in knowledge and contribute to our understanding of the topic
Assists us in constructing suitable hypotheses
Helps us plan our investigations
Helps us to avoid unnecessary investigations
Reveals limitations or errors in past research
May be outdated or biased or inaccurate
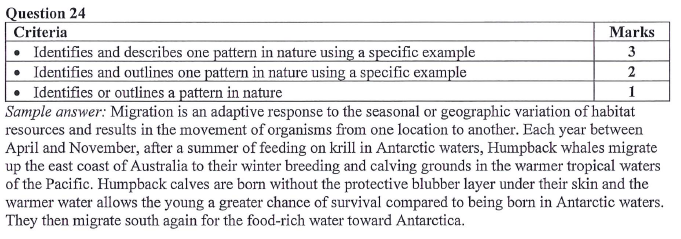
Why do animals migrate?
Find more food
Find a more suitable environment
Raise their young in favourable conditions
How do animals migrate?
Animals are able to navigate by:
Learning from previous generations
Using the sun and stars
Using the earth's magnetic fields
Using landmarks
What is an example of an animal that migrates?
In earlier times, people believed whales “disappeared” or even died off seasonally when they vanished from local waters, because they had no way of tracking them across oceans. The assumption came from observing the pattern of absence but misinterpreting its cause. Humpback whales migrate thousands of kilometres every year. They travel from cold polar waters, where they feed in summer to warm tropical waters, where they breed and give birth in winter.
Movement of comets
Comets are leftover materials from the formation of our solar system and orbit our sun
They can be identified by their tail, which is ice vaporising as it gets closer to the sun
Follow Kepler’s Laws of Planetary Motion – the closer to the sun they are, the faster they move
They have a highly elliptical orbit
Comets originate from the Kuiper belt or Oort cloud. Those from Kuiper are in plane with the solar system. Those from Oort are at random angles to the solar system.
Comets travel in elongated, elliptical orbits around the Sun, spending most of their time in the cold outer solar system before a gravitational disturbance sends them inward. As a comet nears the Sun, its ice heats up and turns directly into gas, forming the visible coma and tail, which are always pointed away from the Sun.
Patterns are repeated events in nature. Patterns have been observed overtime throughout the
universe that have supported scientists in constructing body of evidence required to support
scientific conclusions. Scientists seek to identify and understand patterns in our world by
drawing on their scientific knowledge to offer explanations that enable the patterns to be
predicted. One such example is Halley’s comet. Previously, comets were thought to be
unique one-time events. In 1860, English astronomer Edmond Halley became interested in
positions of the comets and started to plot the path of comets and identified a pattern of
comets that approached Earth. He used Newton’s law of gravitation and searched the
historical records to conclude that the same comet had approached Earth in 1531, 1607, 1682
and predicted its return in 1758. This comet is now called as the Halley’s comet and has an
elliptical path around Sun with orbital time of 75 years. Hence, it was established that comets
orbit the Sun and will be observed approaching the Earth periodically.
Formation and shape of crystals
Snowflakes form around dust particles in air
The shapes and sizes are determined by the weather
The drier the weather conditions, the simpler the snowflake
Due to the nature of bonding in water molecules, snowflakes are always symmetrical and 6 sided
Elements exhibiting certain properties
Mendeleev looked at increasing atomic mass and similar properties of elements to organise the periodic table we know today
Now it has been used to show many more properties such as:
Atomic mass
Atomic number
Atomic radius
Electronegativity
Ionisation energy
A clear pattern observed in nature is the recurring properties of elements. When scientists, including Dmitri Mendeleev, studied elements, they noticed repeating trends in properties such as reactivity, conductivity, and atomic radius when the elements were arranged by increasing atomic mass. These consistent patterns over time built a strong body of evidence for Mendeleev’s scientific conclusion that elements exhibit periodic properties, which led to the development of the Periodic Table. This organisation not only explained existing patterns but also allowed Mendeleev to predict the properties of elements not yet discovered, further confirming the validity of his conclusion.
Fractals
Are repeating, infinite patterns and irregular geometric patterns that exhibit self-similarity and repeat at different scales seen throughout nature
Examples in nature:
Vascular system in plants
Snowflakes
Electricity discharge
Romanesco cauliflower
Coastlines
Seashells
Galaxies
Aurora Australis
Solar flares from the sun produce electrons that are sent towards Earth
The Earth’s magnetic fields pull these towards the north and south pole
Particles collide with atoms in the atmosphere – colours are produced as these atoms drop from excited states
Predicting the Aurora Australis
Auroras follow the solar cycle = 11 years
Years with high levels of activity tend to have more spectacular auroras
Auroras also coincide with sunspots turned towards earth. They help with predictions as the sun takes 28 days to rotate.
There is no precise way to accurately predict an aurora
Unstable isotopes
An isotope is a type of atom from the same element but with a different number of neutrons
Isotopes that are unstable release radiation and undergo nuclear decay – their ratio of protons to neutrons is too large
All elements after lead (atomic number > 82) are unstable
Type 1 error
Type I = hypothesis is incorrectly accepted
patterns aren’t there, but look like they are
random data looks like a pattern by chance
we use statistical analysis to overcome this error
Type 2 error
Type II = hypothesis is incorrectly rejected
failing to recognise a pattern
usually happens because variables aren’t controlled
leads to misinterpreting patterns
Pareidolia
The tendency to perceive a specific, often meaningful image in a random or ambiguous visual pattern
Can be visual or auditory
The tendency to see faces in random objects
Optical illusions
Misleading image presented to vision
The image processed by the brain is different to reality
Our brain taking shortcuts to interpret information quality
Correlation vs Causation
Correlation signifies a statistical association between two variables, indicating they tend to change together, but not necessarily that one causes the other.
Causation, on the other hand, means that a change in one variable directly causes a change in the other
How can data be misinterpreted?
Personal bias
Poor scientific method
Inaccurate data
Confusing correlation for causation
Unethical behaviour
Sampling errors
Quoting numbers within margin of error
Making generalisations
Not considering outside causes
Deception
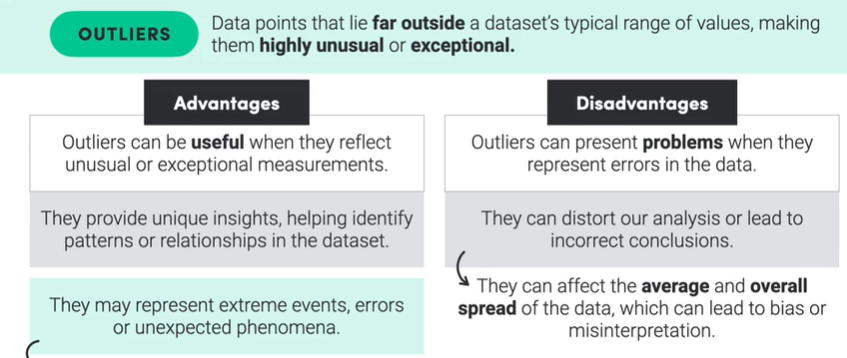
Outliers
An unusual score that deviates from the rest of the data set
It is further away from the rest of the data points and lies out of the general pattern
How do outliers affect data analysis?
Outliers can bias estimates and errors
Affects the mean
Increases with a high value
Decreases with a low value
Affects the slope of the data
The line of best fit will be skewed towards the outlier
Increases the range and standard deviation
Standard error of regression (R2 value)
Affects P-value (statistical significance)
What are the advantages and disadvantages of outliers?