Stats- levels of measurement
1/32
There's no tags or description
Looks like no tags are added yet.
Name | Mastery | Learn | Test | Matching | Spaced | Call with Kai |
|---|
No study sessions yet.
33 Terms
what are levels of measurement
rules for assigning numbers to objects
what type of number has the lowest number of rules
nominal
which type of number has the highest number of rukes
ratio
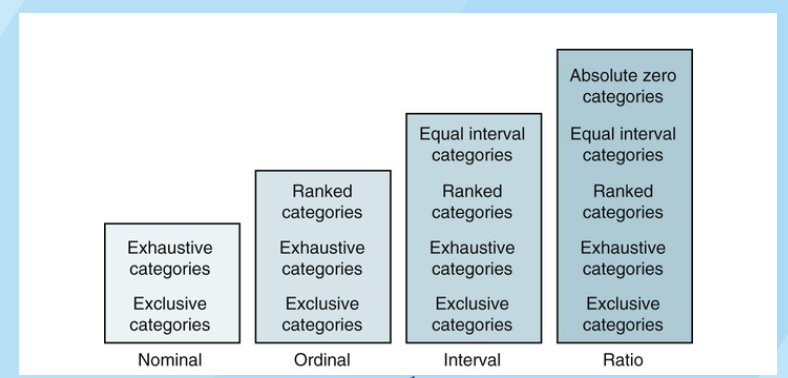
order from lowest to highest number of rules
nominal, ordinal, interval, ratio
rules for nominal categories (lowest form)
must be exclusive (fits into only one category)
must be exhaustive (fits into at least one category)
example of nominal
gender, race/ ethnicity, picking fav food
ordinal
categories that can be rank ordered
ordinal rules
Categories must be exhaustive and mutually exclusive
each category or box must be recognized as higher or lower or better or worse than another category
there is not a set number between one subjects score and another score
do not have a continuum of values with equal distances between them
pain scale ( no set distance between numbers in pain scales)
what are Nonparametric or distribution-free analysis techniques used for
to analyze nominal and ordinal level variables to examine relationships
what are assumptions for Nonparametric or distribution-free analysis techniques
Values dont need to be normally distributed
The level of measurement is usually ordinal or nominal
nominal level data measurement of central tendency
mode
mode
most frequently occuring in a data set
Ordinal Level Data: Measurement of Central Tendency
median
median
middle value in a data set
what are descriptive statistical analyses
frequencies and percentages
what are frequencies and percentages used to describe
demographic variables
what is range used to determine
the dispersion or spread of values of a variable measured at the ordinal level
interval
The distances between intervals of the scale are numerically equal
interval rule
There is no absolute zero
The score of zero does not indicate that the property being measured is absent (can go negative)
continuous variable
ex: temp
ratio is the
highest form of measurement
ratio rules
numerically equal intervals of a scale
absolute zero 0 and up
continuous variables ( same distance between each number)
age, blood pressure, pulse
what are parametric statistics conducted on
interval and ratio levels of data
what do parametric statistics describe
variables, examine relationships among variables and determine difference between groups
parametric statistics assumptions
Distribution of scores is expected to be a normal distribution or approximately normal
Variables are continuous, measured at the interval or ratio level
Data can be treated as though they were obtained from a random sample
significant results for stats
p values less than or equal to 0.05
levels of measurement review
nominal variable analysis
chi-square
ordinal variable analysis
spearman ranked order coreelation coefficient and the mean whitney U and wilcoxen signed ranks
what are parametric statistics
powerful analysis
means and standard deviations
use interval or ratio levels
pearsons correlation coefficient
determines relationships between variables
T-test and ANOVA
calculated to determine significant differences between groups
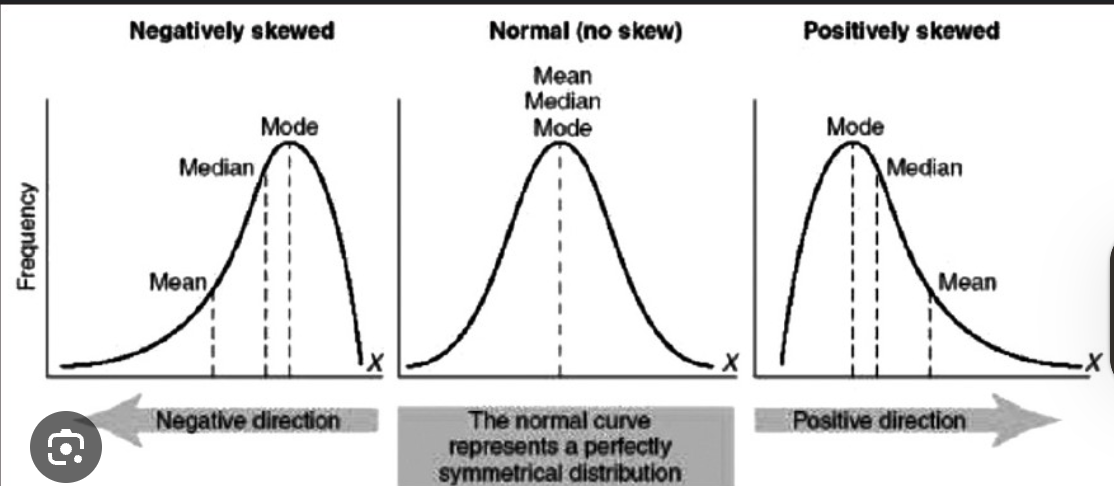
what happens when mean, medium mode is positively or negatively skewed
Positvely skewed: mode, medium, mean (high to low)
negative skewed: mean medium mode (low to high)