GEOG 181
1/126
There's no tags or description
Looks like no tags are added yet.
Name | Mastery | Learn | Test | Matching | Spaced |
|---|
No study sessions yet.
127 Terms
Egocentric mental maps
Mental maps of the places we live, work, and visit
Geocentric mental maps
Mental maps of places we have not directly experienced, such as foreign cities
Charts and plans
Specialized documents that are designed to be used as tools by people with necessary training and knowledge, for example: aeronautical charts
General reference maps
Show multiple themes of information - typically used as base maps. Note:
Small scale maps show more data, but less in detail
Large scale maps show less area, but provide greater detail and show smaller features
Thematic maps
Generally focus on representing spatial distribution of a single theme of information
Choropleth maps
Represent the average value of data collected within predefined areas
Provide a general pattern of the spatial distribution
Assigns a colour based on a data value to a region
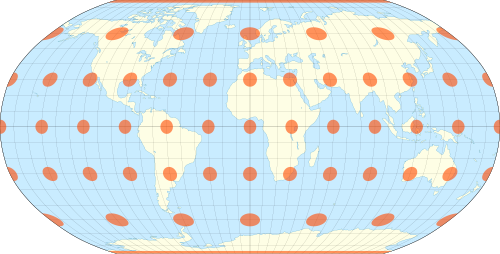
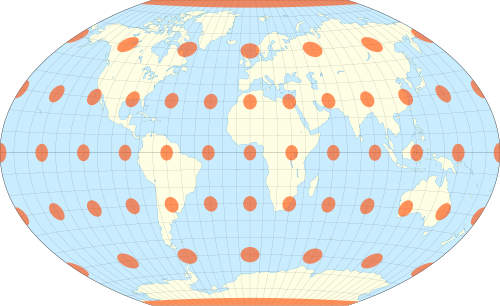
Dot maps
Provide a general impression of the spatial distribution of a phenomenon
Require equal-area projections
Use individual dots to represent a fixed number of something, distributed across space
Proportional symbol maps
Show the general spatial pattern of a phenomenon
Symbol is typically shown as a point or a circle, scaled on the value of the attribute
Good for total quantities, but not for ratios or percentiles
The three functions of maps
Navigation
Visualization
Measurement
Ptolomy
A Greek mathematician whom created the Geographia in the 2nd century, listing coordinates of known locations in the Roman Empire
What were some features of maps that used Geographia?
Evidence of the knowledge of a round Earth
Use of a projection to transfer the features of a round earth onto a flat map
Lines of latitude and longitude
T and O Maps
Represent the European understanding of the world during the medival period (7th century)
What were the three known continents identified on T and O maps?
Asia, Africa, and Europe
Waldseemüller Map of 1507
The most significant map to be created after the knowledge of the “new world”, using projections derived from Ptolomy
Topographic Survey of France
From the late 17th to early 19th century, France undertook efforts to map the entire country, using triangulation, leading to a series of 1:80,000 scale topographic maps
By the 1700s, what development did we begin to see in maps?
Maps began to focus on presenting single themes of data over simple based maps, being used as tools for analyzing spatial patterns
What is the shape of the Earth, and what shape can we use to represent it?
Earth is an oblate spheroid, and we can represent it with an ellipsoid
On the (almost) spherical Earth, we can specify a location using?
Latitude
Longitude
Elevation
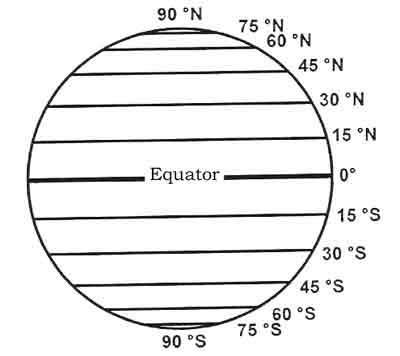
Latitude
Measures our angular position from the centre of the Earth, with respect to the north and south direction
Average length between degrees of latitude
For basic calculations, we assume 111 km
Lines of latitude run ___ to the equator
Lines of latitude run parallel to the equator
Longitude
Measures our position fro the prime meridian, with respect to the east and west directions
Lines of equal longitude are called
Meridians
Where is the prime meridian located?
Greenwich, England
The length of a degree of longitude at a particular latitude
Length of 1° = 111 km * cos(latitude)
Geodetic datums
Consist of a mesh of reference points which translate positions on maps to their real position on the surface of the earth
1900 U.S. Standard Datum
The first nationwide datum for the U.S., using the Clarke 1866 ellipsoid and had origin point of Meades Ranch, Osborne County, Kansas. Used as the reference points for all points in America from 1901 to 1989
NAD27
In 1927, the original 1900 U.S. Standard Datum expanded to include Canada and Mexico
NAVD29
In 1929, elevations were added to the NAD27
NAD83
In 1983, the NAD83 was created using satellite imagery, based on the GRS 80 ellipsoid. The origin point was the mass-centre of the Earth
Coordinates for points in NAD83 and NAD27 can differ in their location by anywhere from ___ to ___
Coordinates for points in NAD83 and NAD27 can differ in their location by anywhere from 10m to 250m
What replaced NAD83?
The World Geodetic System (WGS84)
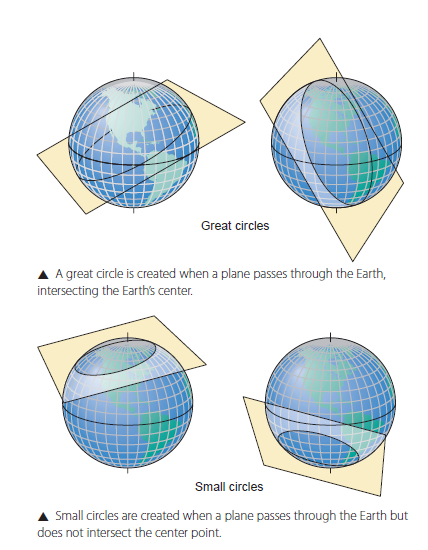
Great circles
The shortest distance between two points on Earth is an arc that is a portion of a great circle
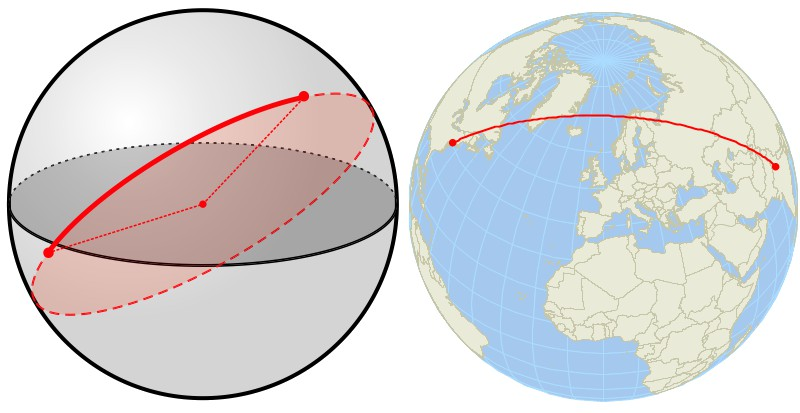
Small circles
Ceated on the Earth when a plane passes through the Earth’s surface without passing through its centre
Great vs. small circles
The plane that creates a great circle passes through the Earth’s centre
The meridians of longitude each represent half a ___ circle
The meridians of longitude each represent half a great circle
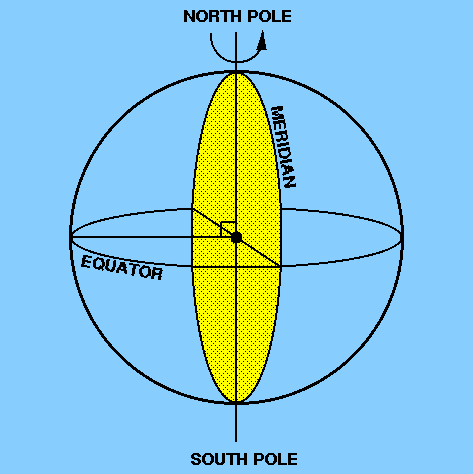
The parallels of latitude, other than the equator, are ___ circles
The parallels of latitude, other than the equator, are small circles
Loxodromes
Lines on the Earth’s surface that have a constant compass direction
T/F: The meridians of longitude are loxodromes
True, they either head north or south
T/F: The equator is not a loxodrome
False, it heads east or west
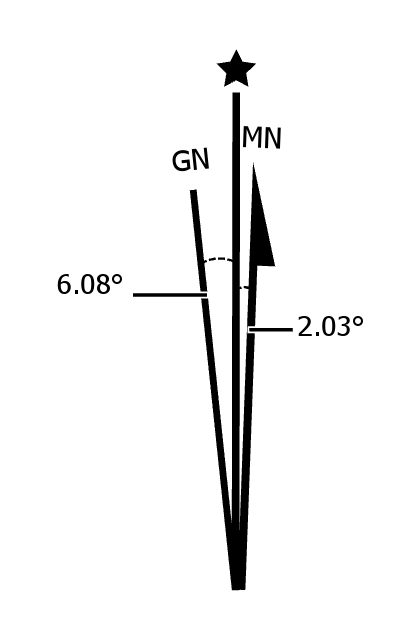
What are the three Norths?
True North
Magnetic North
Grid North
True North
Direction to the North Pole
What North do Meridians point to?
True North and True South
Magnetic North
Direction to the North magnetic pole; the direction that is sensed by a compass
T/F: The Magnetic North is constant
False, it moves around over time
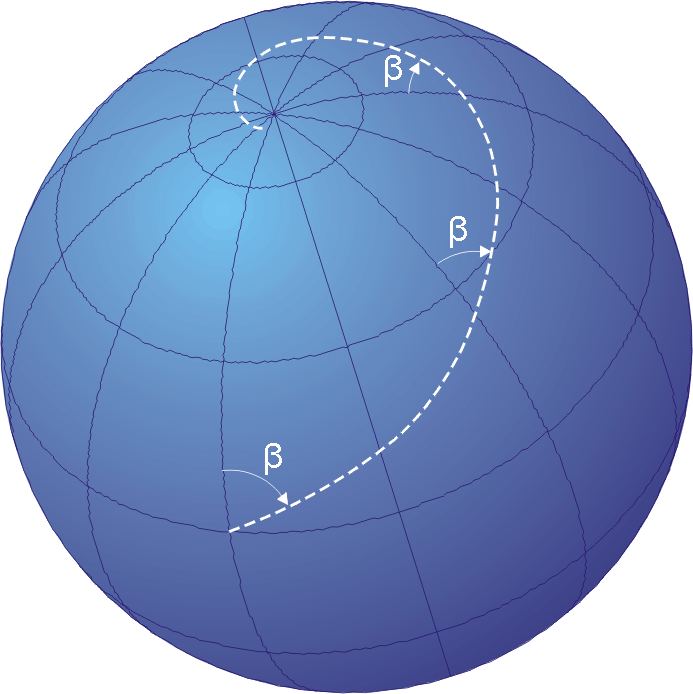
Grid North
North on the Cartesian grid of the UTM projection
T/F: Grid North is the same as True North
False, they diverge as you move away from the central meridian of a UTM zone
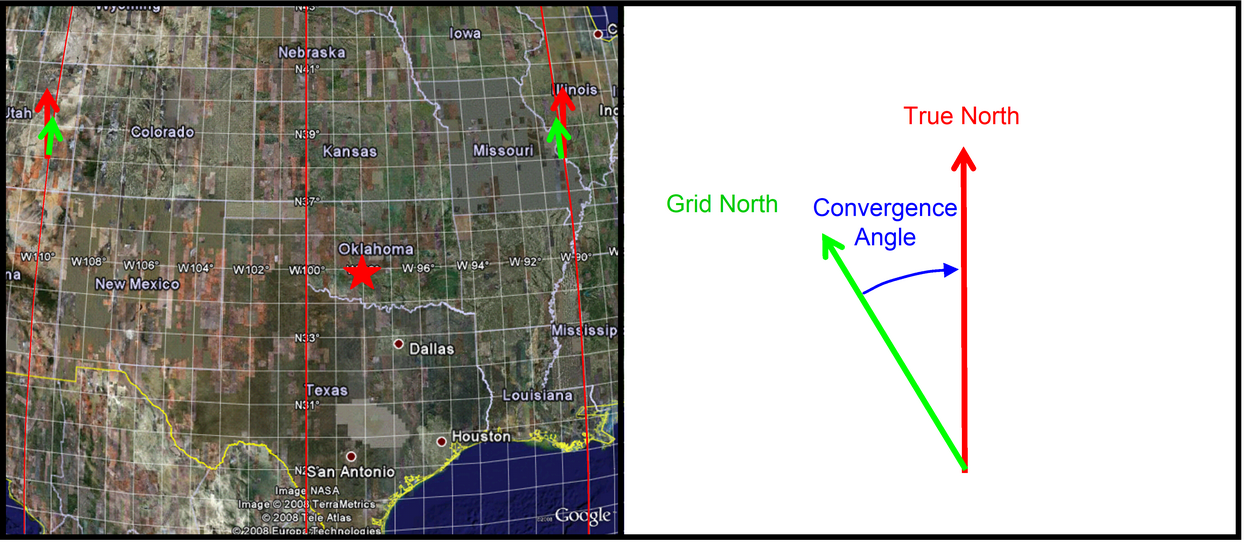
Declination diagram
Summarizes the direction relationships between the three Norths on a map
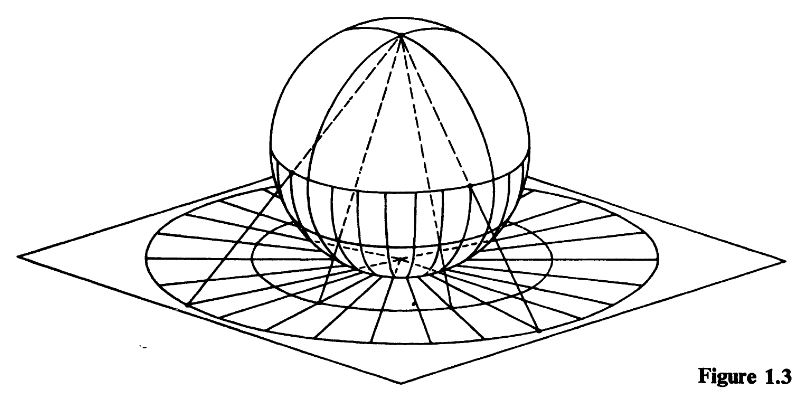
Three steps of creating map projections
Create a three dimensional representation of the Earth that has the same area as the surface of the Earth
Reduce the scale of the generating globe until it matches the scale of the map
Project the features from a generating globe onto the developable surface
T/F: For small scale maps, we can use a sphere for a generating globe
True, a sphere is a good approximation of the Earth over small areas
T/F: For large scale maps, we can use a sphere for a generating globe
False, we must choose an ellipsoid that provides a good fit with the region
Four geometric relationships in projections
Equal area
Equidistant
Conformal
Azimuthal
Small scale maps
Cover large regions, such as world maps, continents, or regions
Large scale maps
Show smaller areas in more detail - called large scale since the representative fraction is large (ie. 1:1,000)
Projection class
The type of the developable surface used to produce the final map:
Plane
Cylinder
Cone
Conventional (use mathematical rules)
Projection aspect
The orientation of the projection surface with respect to the generating globe:
Normal (most common)
Transverse
Oblique
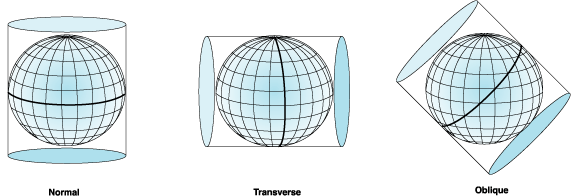
Normal projection aspect
The axis of projection is lined up with the axis of the generating globe
Transverse projection aspect
The axis of the projection is perpendicular to the axis of the generating globe
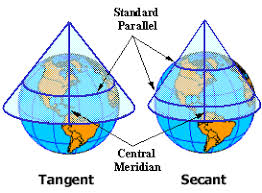
Projection case
The position of the projection surface relative to the surface of the generating globe:
Tangent
Secant
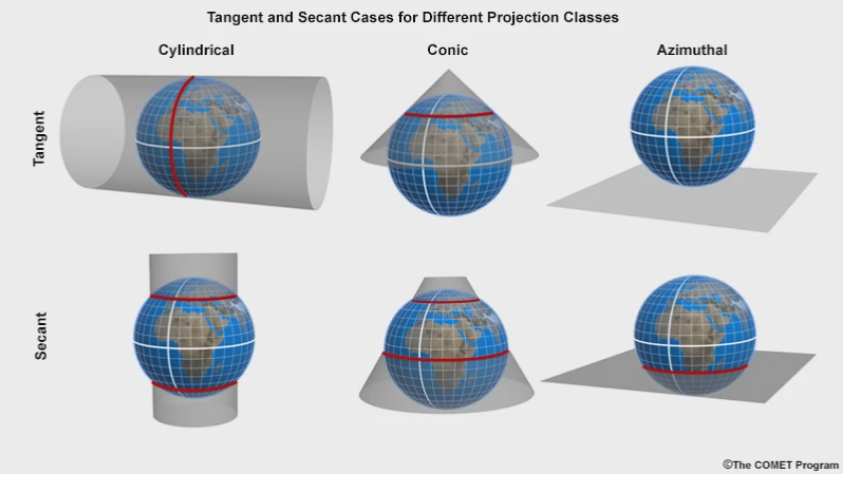
Tangent case
The projection surface lies tangent to the generating globe
Secant case
The developable surface intersects the generating globe
Standard points (or lines)
The point or lines where the projection surface touches the generating globe
The further we move away from the standard point or lines, the ___ distortion there is
The further we move away from the standard point or lines, the more distortion there is
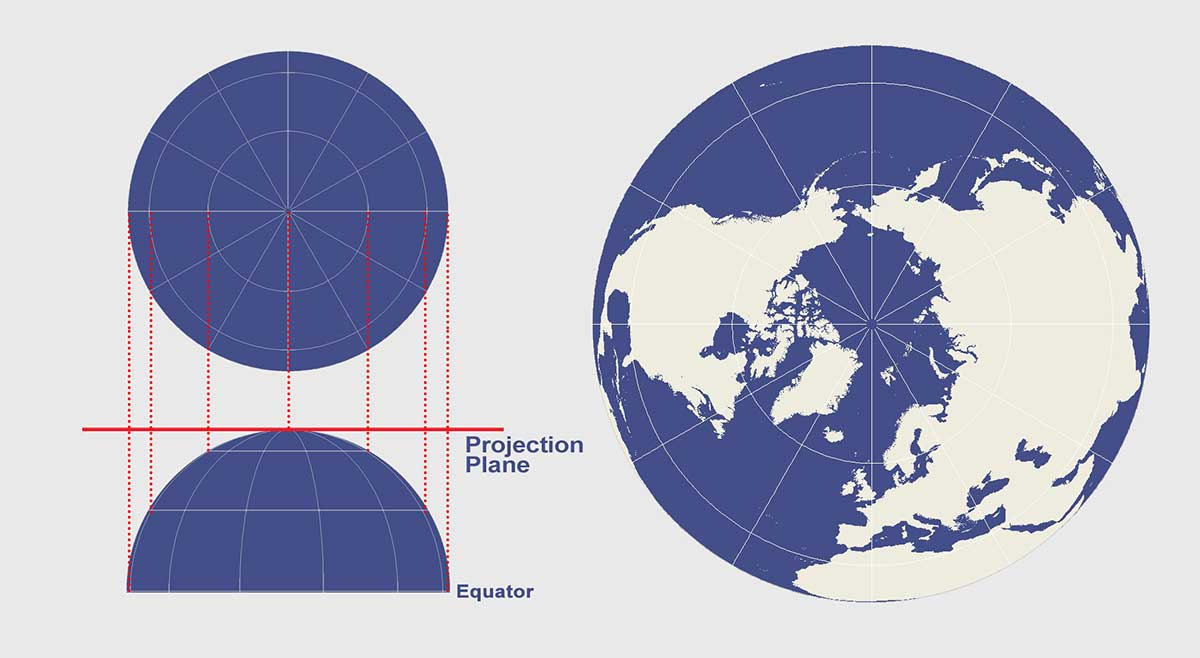
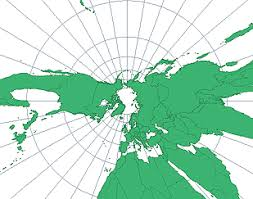
Azimuthal projection
Created by projecting onto a flat plane
Preserves directional relationships about the standard points or lines
Useful for polar regions
Gnomonic projection
Azimuthal projection
Great circles appear as straight lines
Useful for navigation
Stereographic projection
Azimuthal projection
Preserves the shapes of features
Not possible to show more than one hemisphere
Orthographic projection
Azimuthal projection
Provides a view of Earth as it appears in space
Not possible to show more than one hemisphere
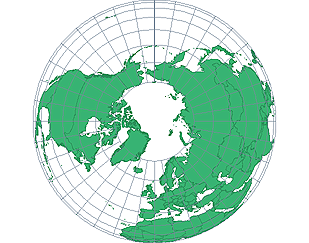
Azimuthal equidistant projection
Constructed mathematically
Preserves angular relationships around the standard point
Preserves distances measured from the standard point at the centre of the map
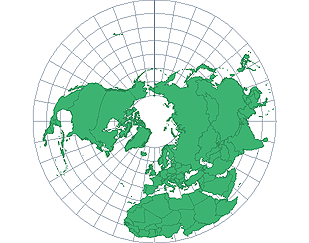
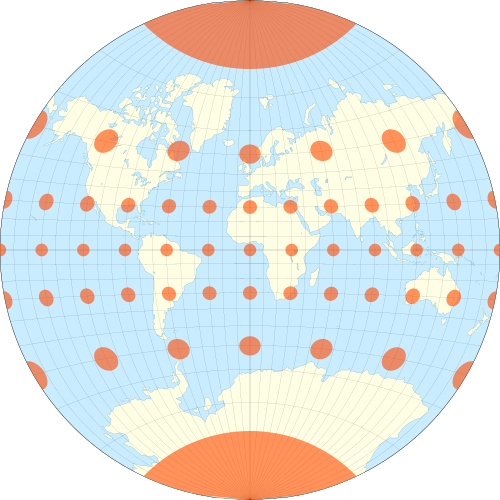
Lambert Equal-Area (azimuthal)
Capable of depicting the entire surface of the Earth
Preserves area
Heavily distorts shapes
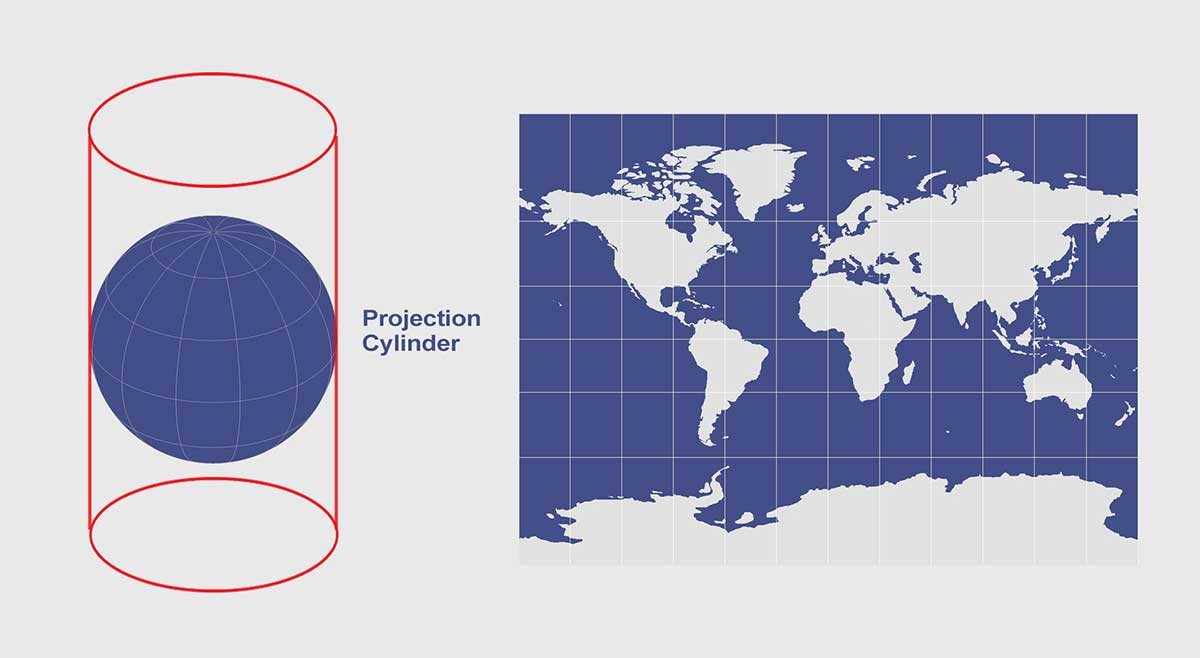
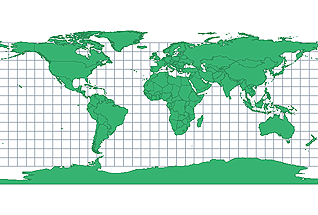
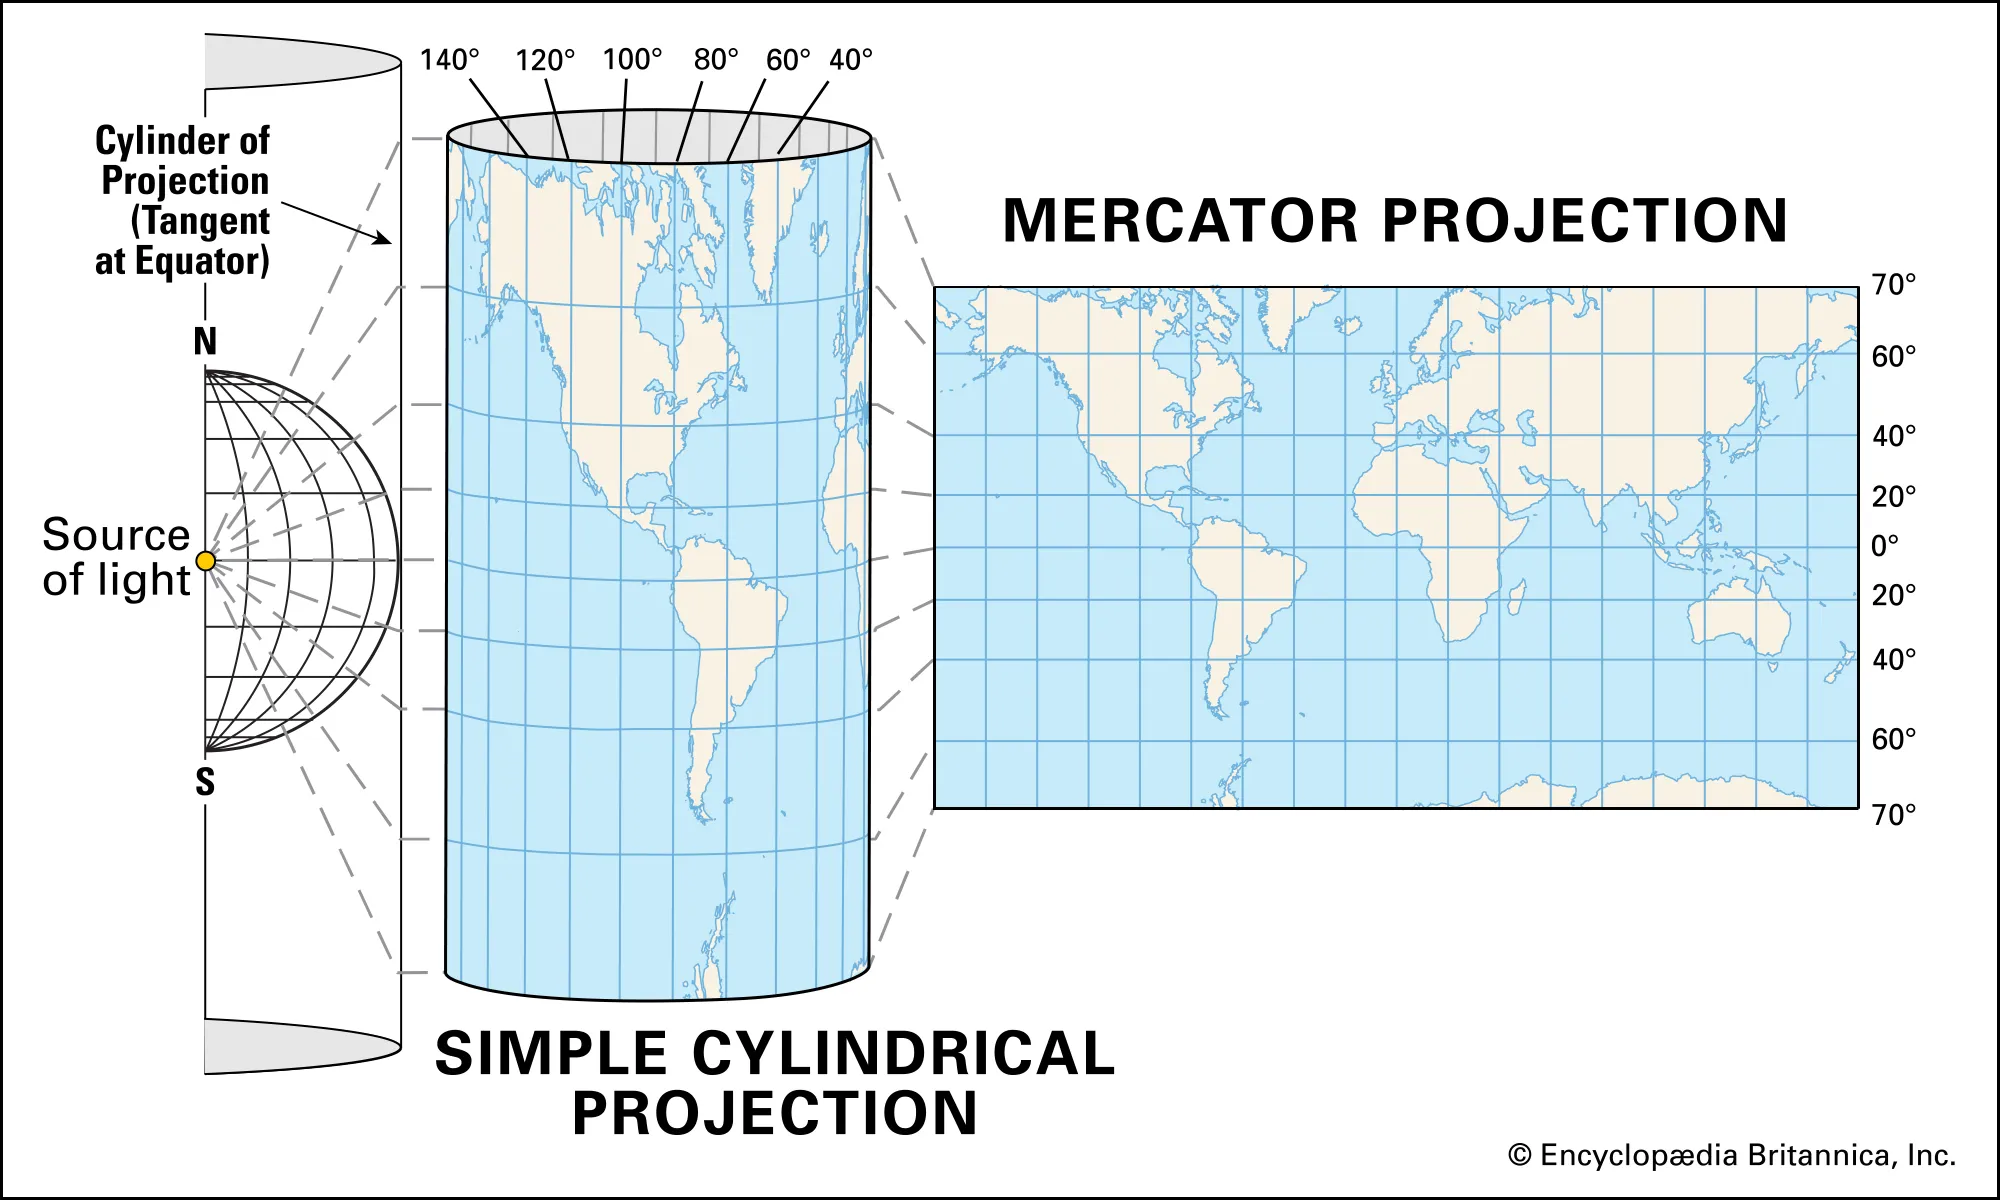
Cylindrical projections
Created by wrapping a cylinder around the generating globe
Lambert Equal-Area (cylindrical)
Standard line runs around the equatorial region
Preserves area
Heavily distorts shapes
Equidistant projection
Cylindrical projection
Preserves north/south distances, as well as the standard lines
Distorts shape and area
Sometimes called “unprojected” (wrong)
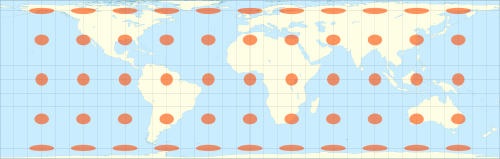
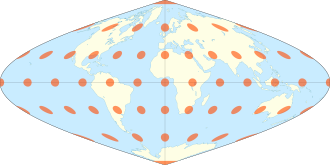
Sinusoidal projection
Cylindrical projection
Preserves area
Preserves east/west distances
Parallels of longitude are proportional to their lengths on Earth
Mercator projection
Cylindrical projection
Most famous projection
Preserves angular relationships
Preserves shapes of features
Heavily distorts area
Why is the Mercator projection still so heavily used?
Loxodromes appear as straight lines, allowing for sailors to plot courses easily
Angles and shapes are preserved locally, meaning that intersections intersect perpendicularly on the map
Lines of longitude and latitude create perfect rectangles
Compromise projections
Do not preserve any geometric relationships, but instead strike a balance between each to make them well-suited for global mapping
Van der Grinten projection
Compromise projection
Projects the entire Earth onto a circle
Robinson projection
Compromise projection
Strikes a balance between preserving shape and area
Winkel Tripel projection
Compromise projection
Contains less distortion of land masses near the poles
Still widely used today
Conic projections
Often used to depict mid-latitude regions
Ptolemy’s maps used many conic projection characteristics
Equidistant conic projection
Distances measured along meridians and standard lines are true to scale
A rudimentary version was described by Ptolemy
Lambert Conformal Conic projection
Conic projection
Preserves shape of features
Widely used for aeronautical charts
Straight line drawn on this projection approximates a great circle route
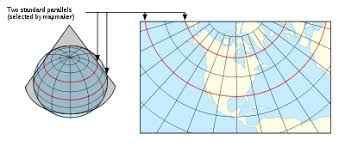
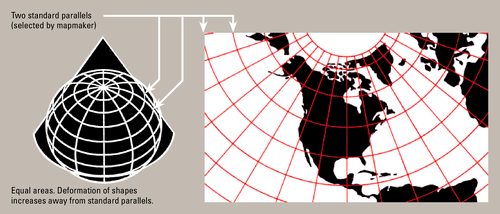
Albers Equal Area projection
Conic projection
Preserves area
Commonly used in Canada and United States
We consider two things when selecting an appropriate projection
The purpose of the map
The area of interest that we wish to map
Best projection for dot density maps
An equivalent (equidistant) projection that preserves area
Best projection for navigation maps
Gnomic projection for polar regions, or Mercator projection
Best projection for polar regions
Azimuthal projections
Best projection for mid-latitude regions
Conic projections
Best projection for equatorial regions
Cylindrical projections
Best projection for global maps
Compromise projections
Best projection for showing areas of deforestation globally across 10 years
Sinusoidal projection, since it preserves area
Best projection for a dot map showing zebra populations in Africa
Sinusoidal or Lamert Equal-Area, since they preserve area and equatorial regions are relatively undistorted
Best projection for showing areas of deforestation in South America
Albers Equal Area, since it preserves area and reduces distortion in mid-latitude regions
Best projection for showing state-by-state Coronavirus rates in the U.S.
Albers Equal Area, since it preserves area and reduces distortion in mid-latitude regions
Best projection for displaying navigational routes in Antarctica
Gnomonic projection, since it is azimuthal (good for polar regions), and straight lines on a map create a great circle route
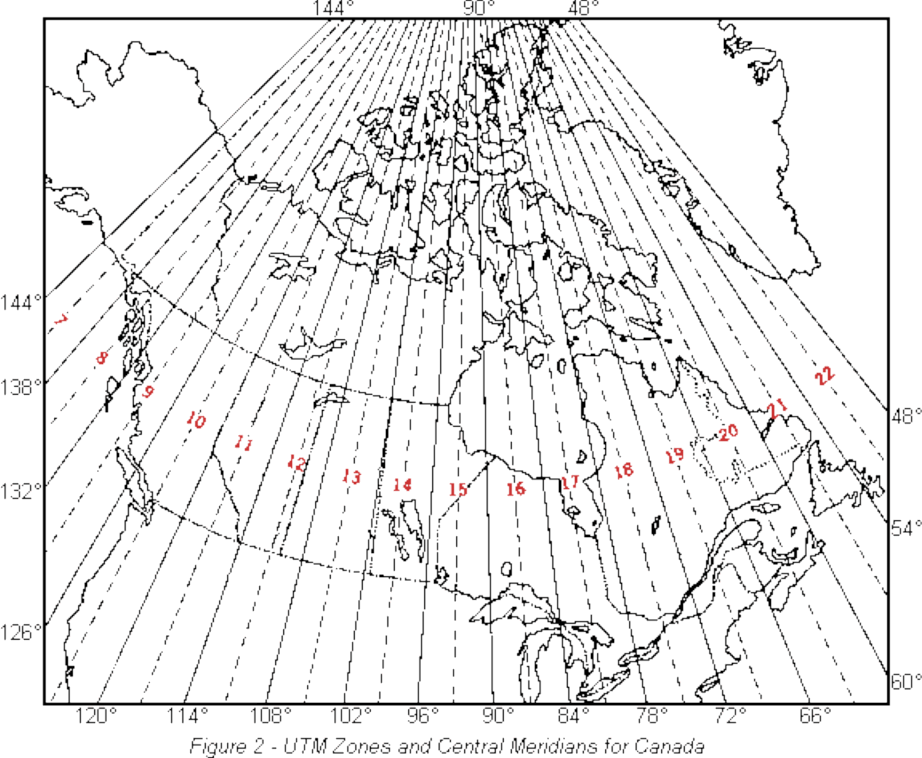
Universal Transverse Mercator Projection
Compromise projection that uses a Cartesian grid of coordinates
Most commonly sued for localized mapping
Comprised of 120 individual projections
Cartesian coordinates in UTM
Each hemisphere in each UTM zone has a Cartesian grid based on a false origin point for that half of the zone, with coordinates (0, 0)
Map accuracy
How closely the information on a map matches the true value: can be scale-specific and application-specific
Map precision
How the numerical and categorical data in the math is being measured
The two types of errors in geospatial data
Systemic error
Random error