AP Micro - Unit 2
1/39
There's no tags or description
Looks like no tags are added yet.
Name | Mastery | Learn | Test | Matching | Spaced | Call with Kai |
|---|
No analytics yet
Send a link to your students to track their progress
40 Terms
law of demand
inverse relationship exists between price and quantity demanded
as price decreases, quantity demanded increases
demand curve
downward slope labeled D on Price v. Quantity plot
why?
Diminishing marginal utility
income effect (consumers aware of % that good is of their income)
substitution effect (consumers will find alternative if price is not ideal)
Market demand
horizontal sum of individual demands
what if demand increases/decreases?
vs
what if quantity demanded inc/dec?
demand curve shifts right/left respectively
if quant. demand. inc or dec, there is a move along the curve
determinants of demand (what causes right/left shifts)
TRIBE
Tastes/preferences (of consumers)
Price of related goods
substitutes (inc. in pepsi price drives inc. demand for coke)
complements (dec. in hot dog price drives inc. in quantity demanded for hot dog which in turn drives inc. in demand for buns)
unrelated goods (one price change does not affect the other)
Income
Normal good (superior goods, as income increases demand increases)
Inferior goods (as income increases demand decreases)(ex. Spam, Thrift clothes)
Number of Buyers (population)
Expectations (pregnancy drives demand for baby products)
law of supply
a direct relationship exists between price and quantity supplied
as price increases, quantity supplied increases (to capitalize on that higher price)
supply curve
upward trend labeled S on a price v. quantity plot
increase in supply v. quantity-supplied
in supply: shift left/right
in quant. supp.: move along the curve
Determinants of supply
ROTTEN
Resource Prices
price of resources dec. leads to increase in supply
Price of other goods
price of good 1 inc. leads to quantity supp. of good 1 to inc., and the shift in resources needed to accomplish that leads to decrease in supply of good 2
Technology
more tech = more supply
Taxes and subsidies
more taxes = less supply
subsidy = more supply
Expectations
Number of Sellers
price elasticity of demand
how much more or less will consumers buy a good as price changes
measures responsiveness to price changes
% change in quantity demanded / % change in price = Ed
where in both % change values should be absolute value
price elasticity of demand is…
inelastic from 0 to 1
necessities like insulin, changing price won’t really change quantity demanded
elastic from 1 to infinity
luxuries
unit elastic at 1
quantity change = price change, a 10% inc or dec will lead to a 10% inc or dec in the other
businesses could opt to switch to a more inelastic good to allow for price raises and more revenue
two extreme cases in price elasticity of demand
vertical line = perfect inelastic demand, consumers willing to pay anything
horizontal line = perfect elastic demand, consumers will only purchase at one specific price, will stop buying entirely if price changes
determinants of price elasticity of demand
Need v. Want
Substitutability
More subs = more elastic
Percentage of income
higher % = more elastic
Time
more time = more elastic
If an executive only has so many days to book a flight to Paris, will be willing to pay more for it (more inelastic due to less time)
total revenue
Price * Quantity = TR
TR - Total Cost = Profit
TR = consumer expenditure (synonyms)
Total Revenue Test for Elasticity
based on quant. demanded v. TR parabola (right of vertex = inelastic and left of it = elastic, vertex = unit elastic)
If price and TR move together, inelastic demand
if quantity and TR move together, elastic demand
if TR doesn’t move, unit elastic
price elasticity of supply
Es = % change in quant. supplied / % change in price
measures how much quantity supplied can change in response to a price change
determinants of price elasticity of supply
Input Substitutability
More subs (more ways and means of producing a good) = more elastic, more can be supplied after a price increase
ex, if the price of oil increases, my company only has one source of it, so I can’t just switch to a source that’s easier to extract or cheaper to produce, quantity supplied cannot increase that much
Time
Less time = inelastic
ex, less time means less strategizing, must use expensive resources available
cross-price elasticity of demand
Exy = % change in quantity demanded of X / % change in price of Y
Tests whether goods are related or not
positive = goods are substitutes (magnitude = more/less sub.)
negative = goods are complementary (magnitude = more comp. or less comp.)
zero/near-zero = unrelated
Income Elasticity of Demand
Ei = % change in quantity demanded / % change in income
positive = goods are normal (superior)
negative = goods are inferior
magnitude matters
market demand and supply graph
S and D lines intersecting on a Q v. P plot, with dashed lines towards axis where market equilibrium is (intersection)
surplus
when quantity supplied is higher than quantity demanded, when price is too high, two separate points on S and D lines that leads to two Qd values
price must be lowered
shortage
Price falls below market equilibrium, two points on Qd axis, Qs < Qd
Must raise price
Market equilibrium (what determines)
Equilibrium price and quantity (location of it)
Indeterminate (either equil. price or equil. quantity may be)
rationing function of prices (market will move itself to equilibrium, prices ration out goods and shortages/surpluses occur when priced wrong)
changes in demand/supply (as opposed to changes in Qd and Qs)
welfare economics
study of economic wellbeing
market equil. will maximize the welfare of buyers and sellers
consumer surplus and producer surplus
consumer surplus
price buyer is willing to pay minus market price
“upwards” triangle formed beneath demand curve by highest price willing to pay, lowest price willing to pay, and point where consumer surplus is zero
area of this triangle = surplus of all consumers
producer surplus
market price minus price producer is willing to sell at\
“downward” triangle formed above supply curve by highest price willing to sell, lowest price, and where producer surplus is zero
area is surplus of all producers
Market efficiency
consumer surplus + producer surplus = total surplus
free markets maximize efficiency (total surplus) at equilibrium
drawing single / double shifts
always start with P v. Q plot, labeled S and D lines, and market equilibrium with dashed lines to axes (P1 and Q1)
single shifts: draw the new line, label the old one 1 and new one 2, draw new equilibrium with P2 and Q2
double shifts: move each line equal distance, new equilibrium is one formed by D2 and S2 curves, one value (P or Q) should be indeterminate, since we can’t know which shift had a greater effect on that value (label this one X1,2)
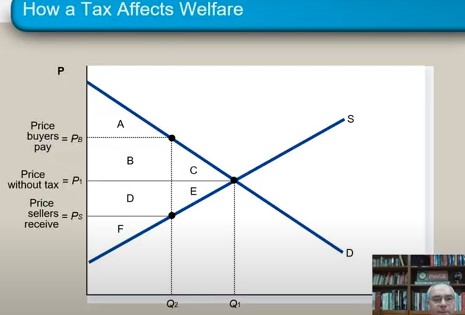
taxation, general effects
When a tax is levied on a good…
Price paid by buyer increases
Price received by producer decreases
Both end up with less money
Must fit within S and D curve, drives a wedge between price buyers pay and that sellers receive
quantity sold decreases (occurs left of equilibrium)
tax distortion on a graph
A = consumer surplus
F = producer surplus
B + D = tax revenue (size of tax (vertical) * quantity of good sold (horizontal))
C + E = Deadweight loss (DWL, fall in total surplus) (c for consumer and e for producer)
ABC = consumer surplus without tax

what determines size of DWL?
elasticity of supply and demand
more elastic (flatter line) = more loss
tax incidence
How is tax split between buyers and sellers?
The steeper (more inelastic) curve pays more
notice larger DWL triangle for the steeper curve when the tax distortion is applied to the graph
price controls
enacted when policymakers believe market price is unfair to buyers or sellers
price ceiling: legal maximum, benefits consumers
price floor: legal minimum, benefits producers
two types: binding (effects equilibrium), non-binding (no effect)
effects of non-binding ceiling/floor
equilibrium already above the floor / below the ceiling, all is well
effects of binding floor / ceiling
ceiling: equi. price is above the ceiling, price must be lowered, but this creates a shortage, Qs < Qd, and non-price-rationing (long lines, discrimination, not everyone gets the good now)
floor: equil. price below the floor, must increase, but this creates a surplus, Qs > Qd, and non-price rationing (companies bribing others to sell their product)
price control effect on total surplus
binding price floor
consumer surplus = A
producer surplus = BDF (floors help prod.)
DWL = CE
binding price ceiling
Producer surplus = F
consumer surplus = ABD (ceilings help consum.)
DWL = CE
international trade (two types of attitudes)
closed economy (autarchy) (no trade at all)
open economy (trades freely)
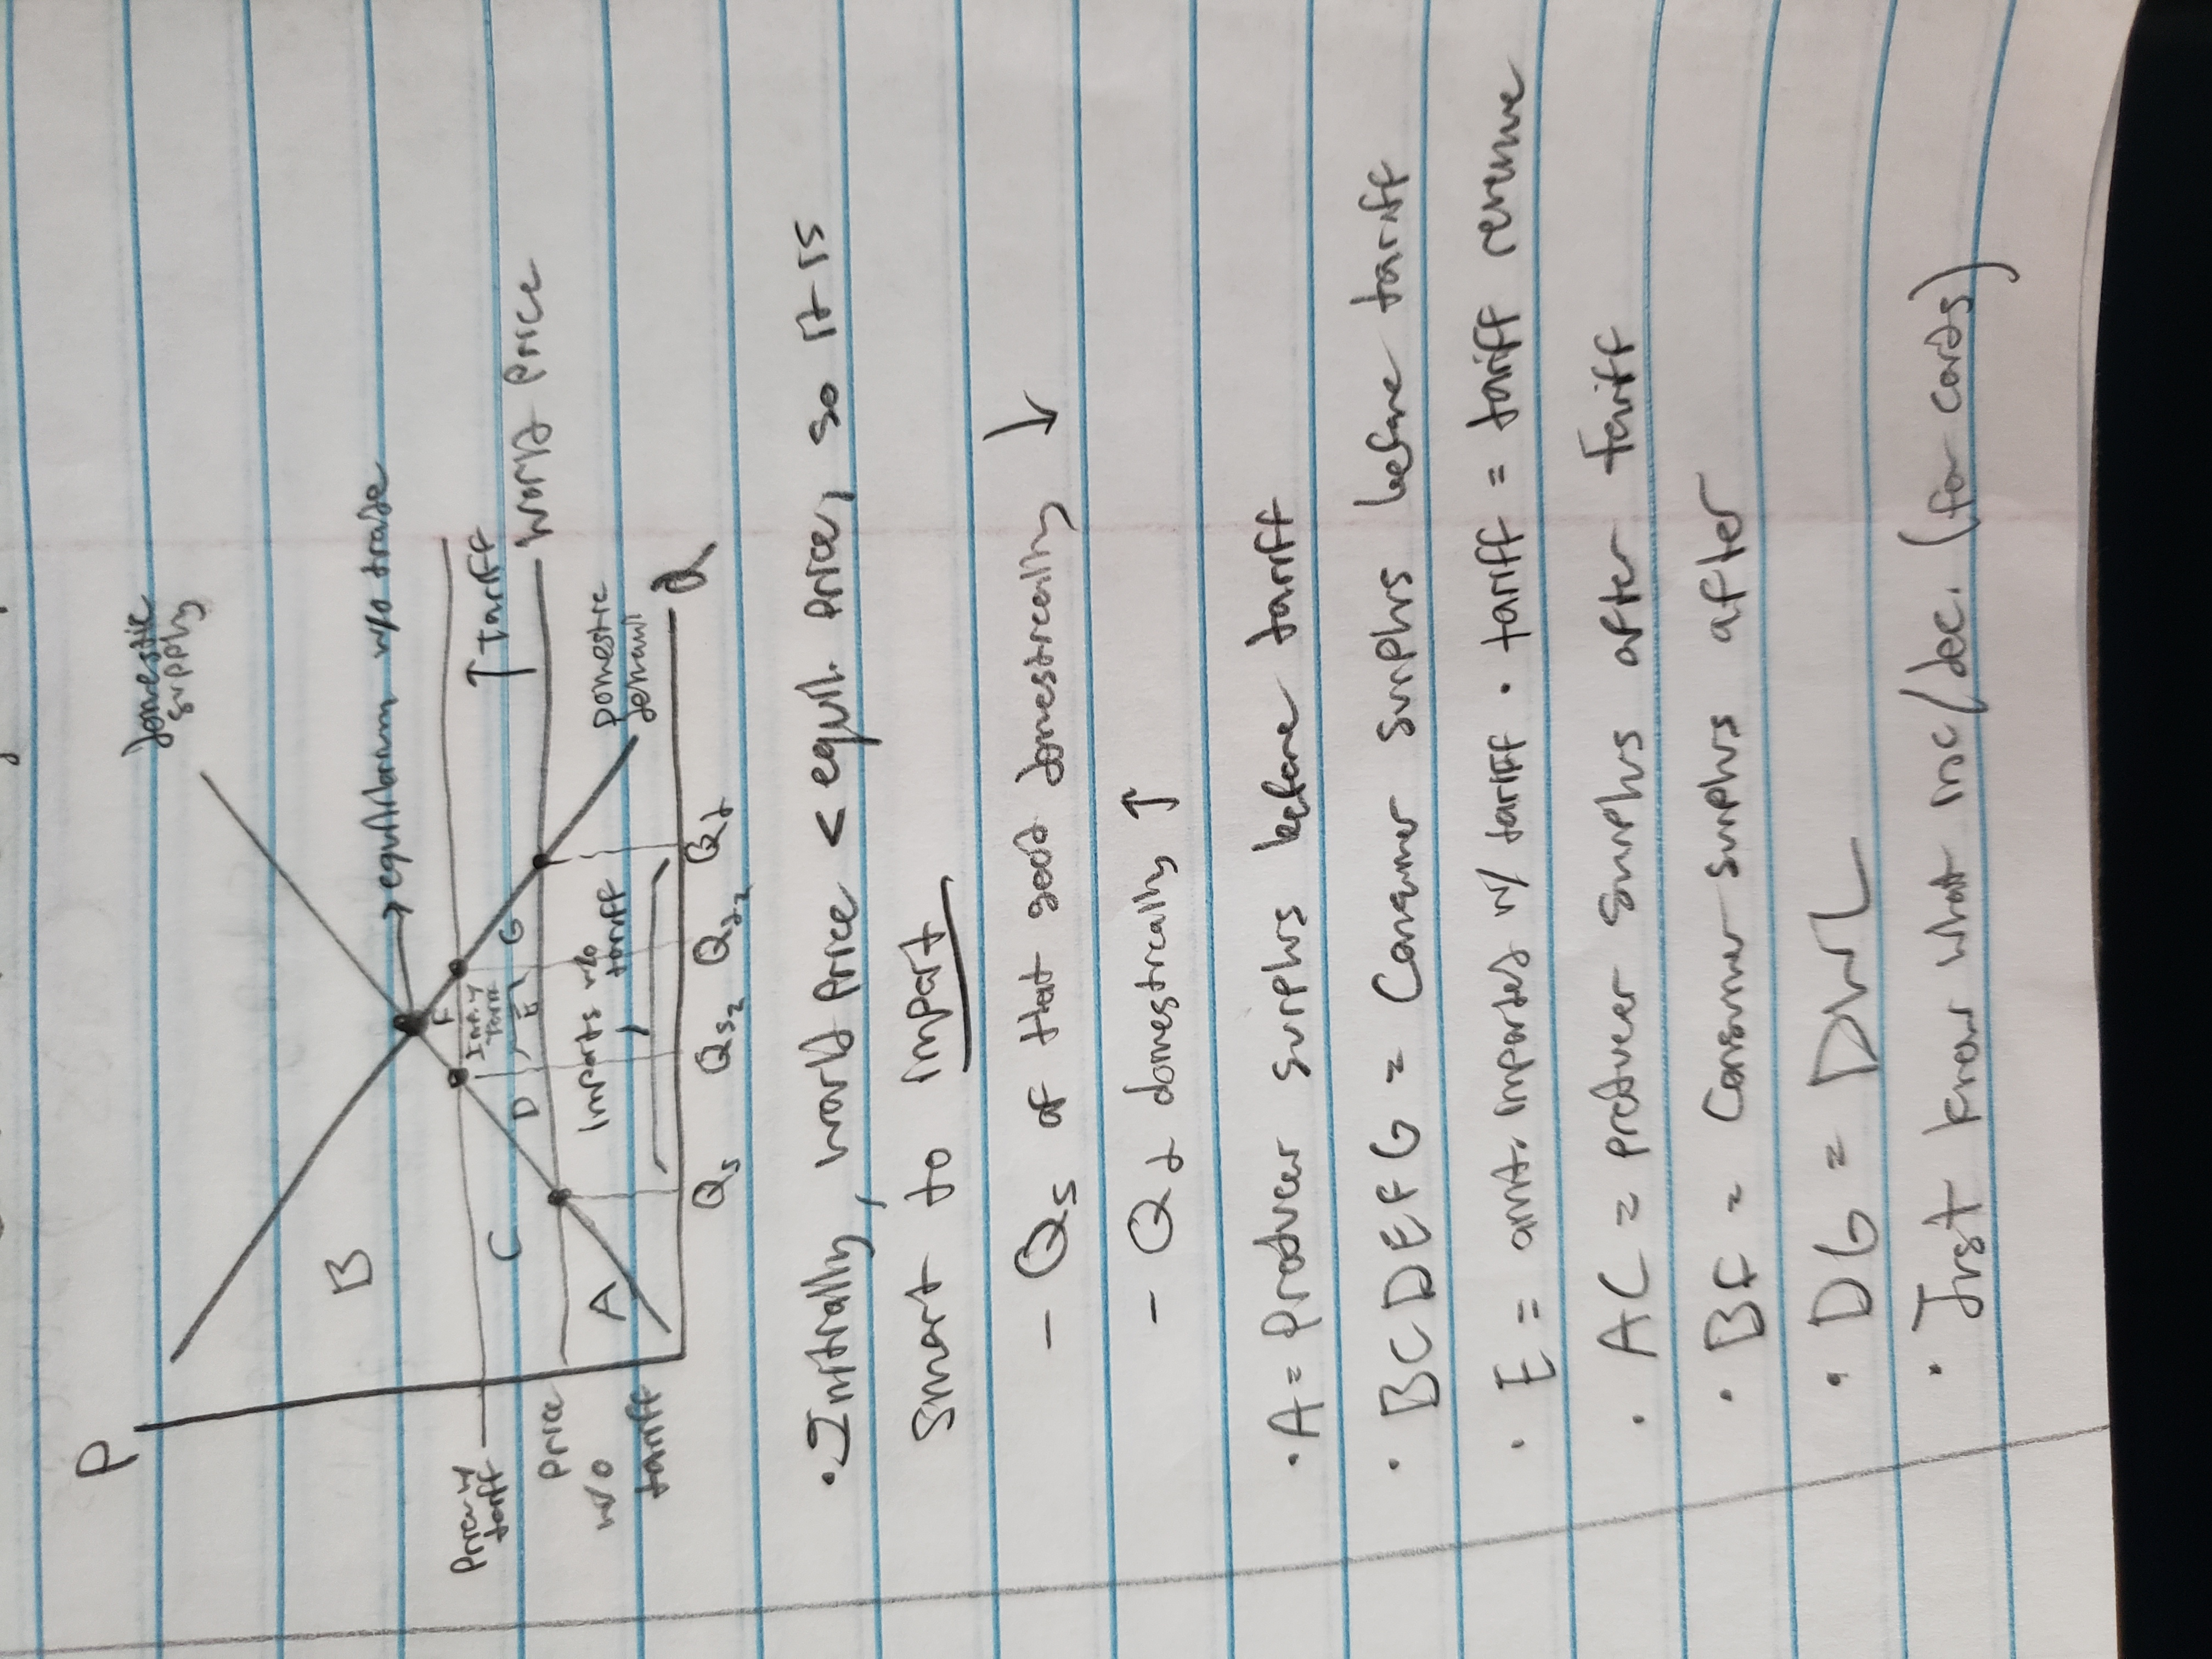
tariffs and effects
tax on foreign goods that are sold domestically
raises price of imported goods by amount of tariff
decreases domestic consumer surplus
increases domestic producer surplus
government gets tariff revenue
creates DWL, total surplus falls
tariff on a graph
two other trade mechanisms
import quota
limit on quantity of imports
export subsidy
lowers domestic cost of production
both tariffs and quotas….
Raise domestic price
Reduce imports
Reduce domestic consum. surplus
Increase domestic prod. surplus
Reduce total surplus (create DWL)