AIS Ch 3 Flowcharting
1/51
There's no tags or description
Looks like no tags are added yet.
Name | Mastery | Learn | Test | Matching | Spaced | Call with Kai |
|---|
No analytics yet
Send a link to your students to track their progress
52 Terms
Documentation
Narratives, flowcharts, diagrams, and other written materials that explain how a system works
Many people learn more and learn it more quickly by studying the DFD, BPD, or flowchart of a system than by reading a narrative description of the same system. Save both time & money, add value.
All accountants should at least be able to read and understand system documentation
includes the who, what, when, where, why, and how of data entry, data processing, data storage, information output, and system controls
Narrative description
Written, step-by-step explanation of system components and how they interact
supplement documentation
Human Readable Documentation Tools
Business process diagram (BPD)
Data Flow Diagram (DFD)
Flowchart (document, system, program)
Machine readable documentation tools
XRBL
Blockchain
Business Process Diagram (BPD)
A visual way to describe the different steps or activities in a business process
do not specify how (i.e., by means of what technology) a process activity occurs
Unlike flowcharts, you do not need to show the documents as they flow through the system or show where they are stored
BPD structure/setup
usually two columns & however many rows (aka "swim lanes")
first column= employee name/departments involved
second column=activities performed by each employee/dpt
depict the major steps in a process sequentially, reading from left to right and top to bottom
Guidelines for Preparing BPDs
1. Identify and understand the business processes.
2. Ignore certain items (don't need to show where docs stored/what technology used)
3. Decide how much detail to include
4. Organize diagram (2 col, rows/swim lanes, etc)
5. Enter each business process on diagram
6. Draw rough sketch of BPD
7. Draw final copy of BPD
BPD Symbols: Circle
start/begin
BPD Symbols: bolded circle
end
BPD Symbols: rounded edge rectangle
activity in a process
brief explanation of activity inside rectangle
BPD Symbols: diamond
decision
explanation of decision inside diamond
BPD Symbols: solid arrow
shows flow of data
BPD Symbols: dotted arrow
annotation info
helps explain a process further
Data Flow Diagram (DFD)
A graphical description of the flow of data within an organization, including data sources/destinations, data flows, transformation processes, and data storage
all elements should be named descriptively, DFDs don't show timing of movement
don't show whether data stored in computer or on paper
diff levels
---level 0 DFD, Level 0 because there are zero meaningful decimal points—1.0, 2.0, etc.
---level 1 DFD process 2.0-expands process 2.0 and has one meaningful decimal place—2.1, 2.2, etc.
Guidelines for drawing a data flow diagram (DFD)
1. Understand the system
2. Ignore certain aspects of the system (Only very important error paths are included; unimportant error paths are ignored)
3. Determine system boundaries (determine what to include/exclude)
4. Develop a context diagram
5. Identify data flows
6. Group data flows (Data elements that always flow together should be grouped together and shown as one data flow until they are separated.)
7. Identify transformation processes (Place a circle wherever work is required to transform one data flow into another)
8. Group transformation processes (Transformation processes that are logically related or occur at the same time and place should be grouped together)
9. Identify all files or data stores
10. Identify all data sources and destinations
11. Name all DFD elements (active and descriptive names, update, edit, record, prepare, reconcile)
12. Subdivide the DFD (5-7+ processes on a pg? subdivide into higher then lower processes)
13. Give each process a sequential number (low to high)
14. Refine the DFD (work through it many times, top-bottom, left-right)
15. Prepare a final copy (Do not allow data flow lines to cross each other)
What to put on final copy of DFD, flowcharts, or BPD
name of preparer
date
name of the chart
on every page
DFD Symbols: Data source
The entity that produces or sends the data that is entered into a system
square

DFD Symbols: Data destination
The entity that receives data produced by a system
square

Data Flow Diagram Symbols: Data flows
curved arrow on left

DFD Symbols: Transformation processes
circle

DFD Symbols: Data stores
= two horizontal parallel lines

DFD Symbols: Internal control
triangle- yellow inside, red border
highway warning symbol

DFD: Data flow
movement of data among processes, stores, sources, and destinations
DFD: Processes
Actions that transforms data into other data or information
DFD: Data store
place or medium where system data is stored
Context diagram
Highest-level DFD (data flow diagram); a summary-level view of a system, showing the data-processing system, its input(s) and output(s), and their sources and destinations
Flowchart
analytical technique that uses a standard set of symbols to describe pictorially some aspect of an IS in a clear, concise, and logical manner
design to read top-bottom, left-right
Including all exception procedures and error routines clutters the flowchart and makes it difficult to read and understand.
Document flowcharts
Illustrate the flow of documents and data among areas of responsibility within an organization
Divide a document flowchart into columns with labels to make easier to read
Show the final disposition of all documents to prevent loose ends that leave the reader dangling.
Guidelines for preparing flowcharts
1) Understand the system
2) Identify the entities to be flowcharted
3) Organize flowchart (show where docs originate & are stored, data processes & storage & where sent, show data from database passing through process first (computer processing))
4) Clearly label all symbols
5) Page connectors (clearly number the pages and use off-page connectors to move from one page to another)
6) Draw a rough sketch of the flowchart
7) Draw a final copy of the flowchart
4 types of flowchart symbols
input/output
processing
storage
flow/miscellaneous
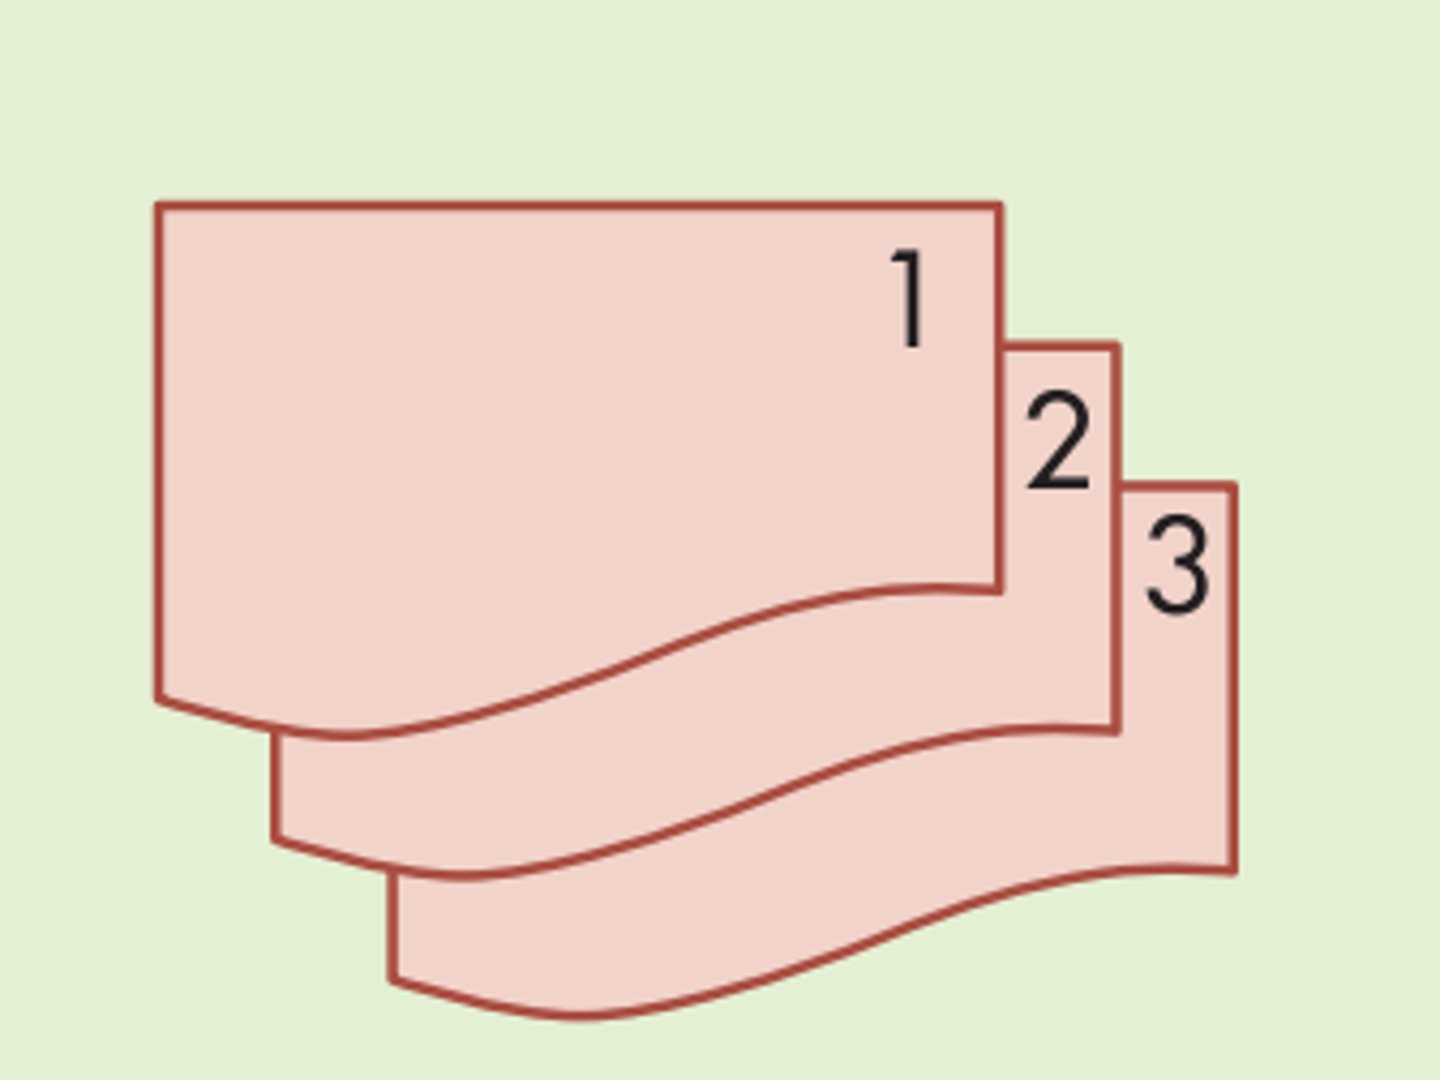
Flowchart symbols: document (input/output)

Flowchart symbols: multiple documents (input/output)
Flowchart symbols: electronic output (input/output)
info displayed by an electronic output
(terminal, monitor, or screen)

Flowchart symbols: electronic data entry (input/output)
ex: computer, tablet, phone, terminal

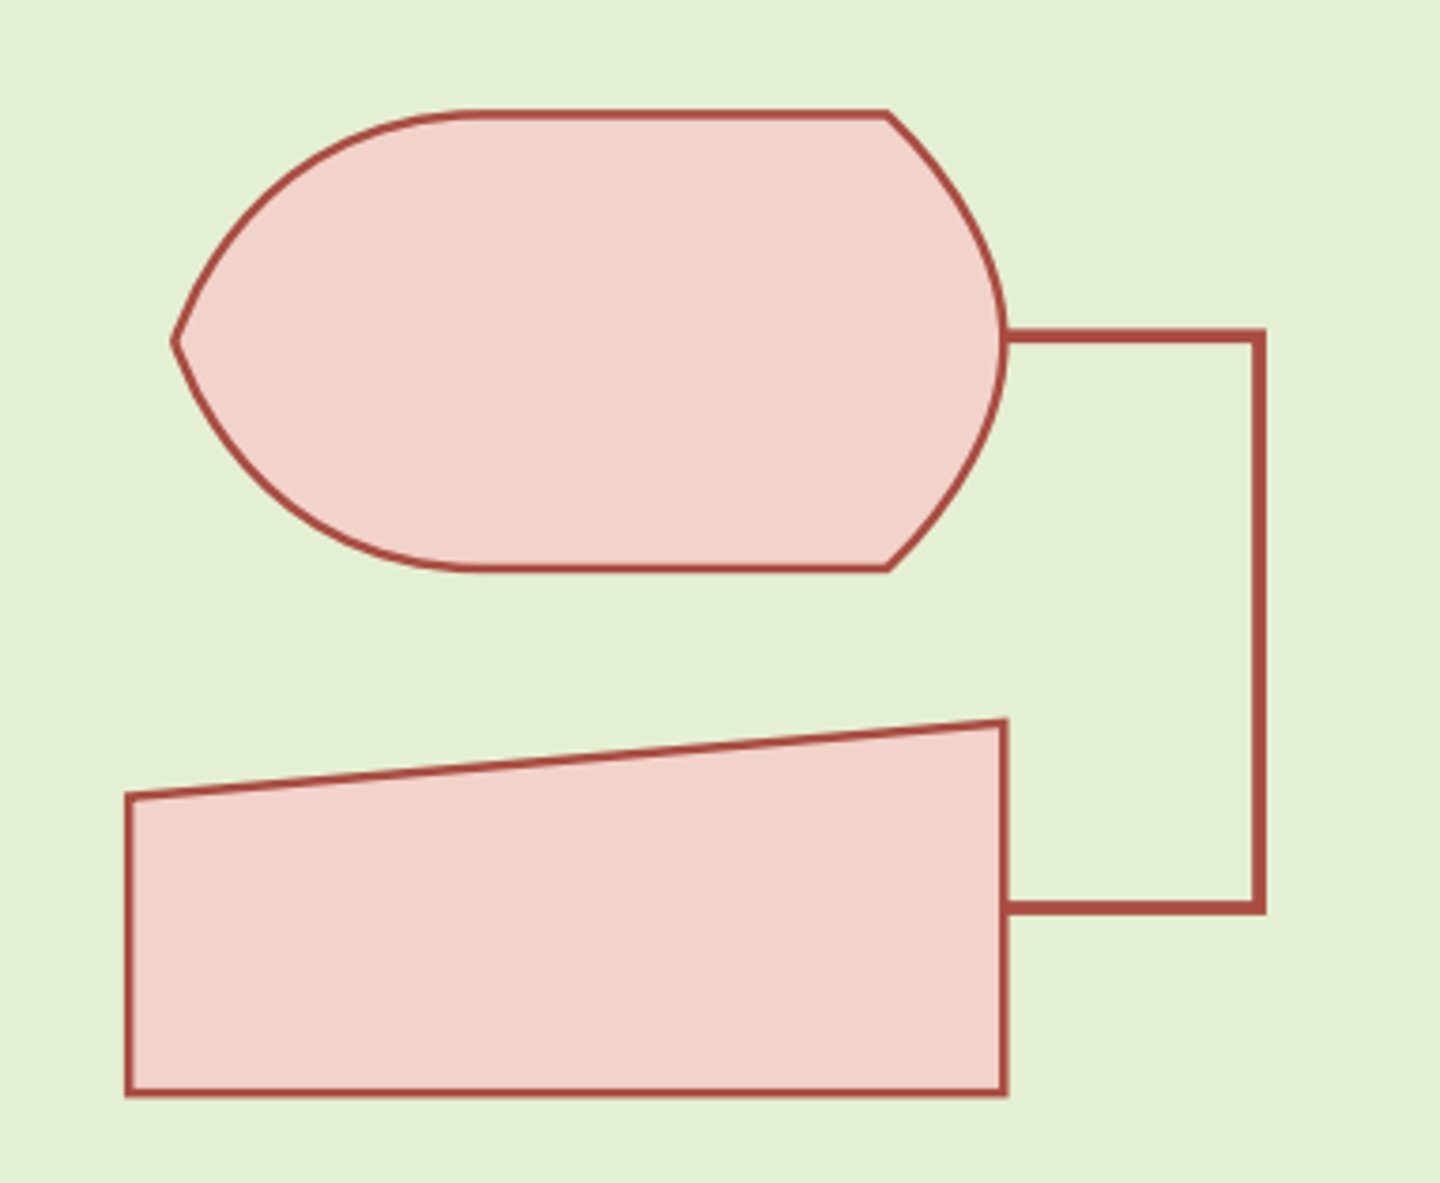
Flowchart symbols: electronic input & output device (input/output)
used together when electronic device is the same for both input & output
Flowchart symbols: computer processing (processing)
solid rectangle
change in data/info

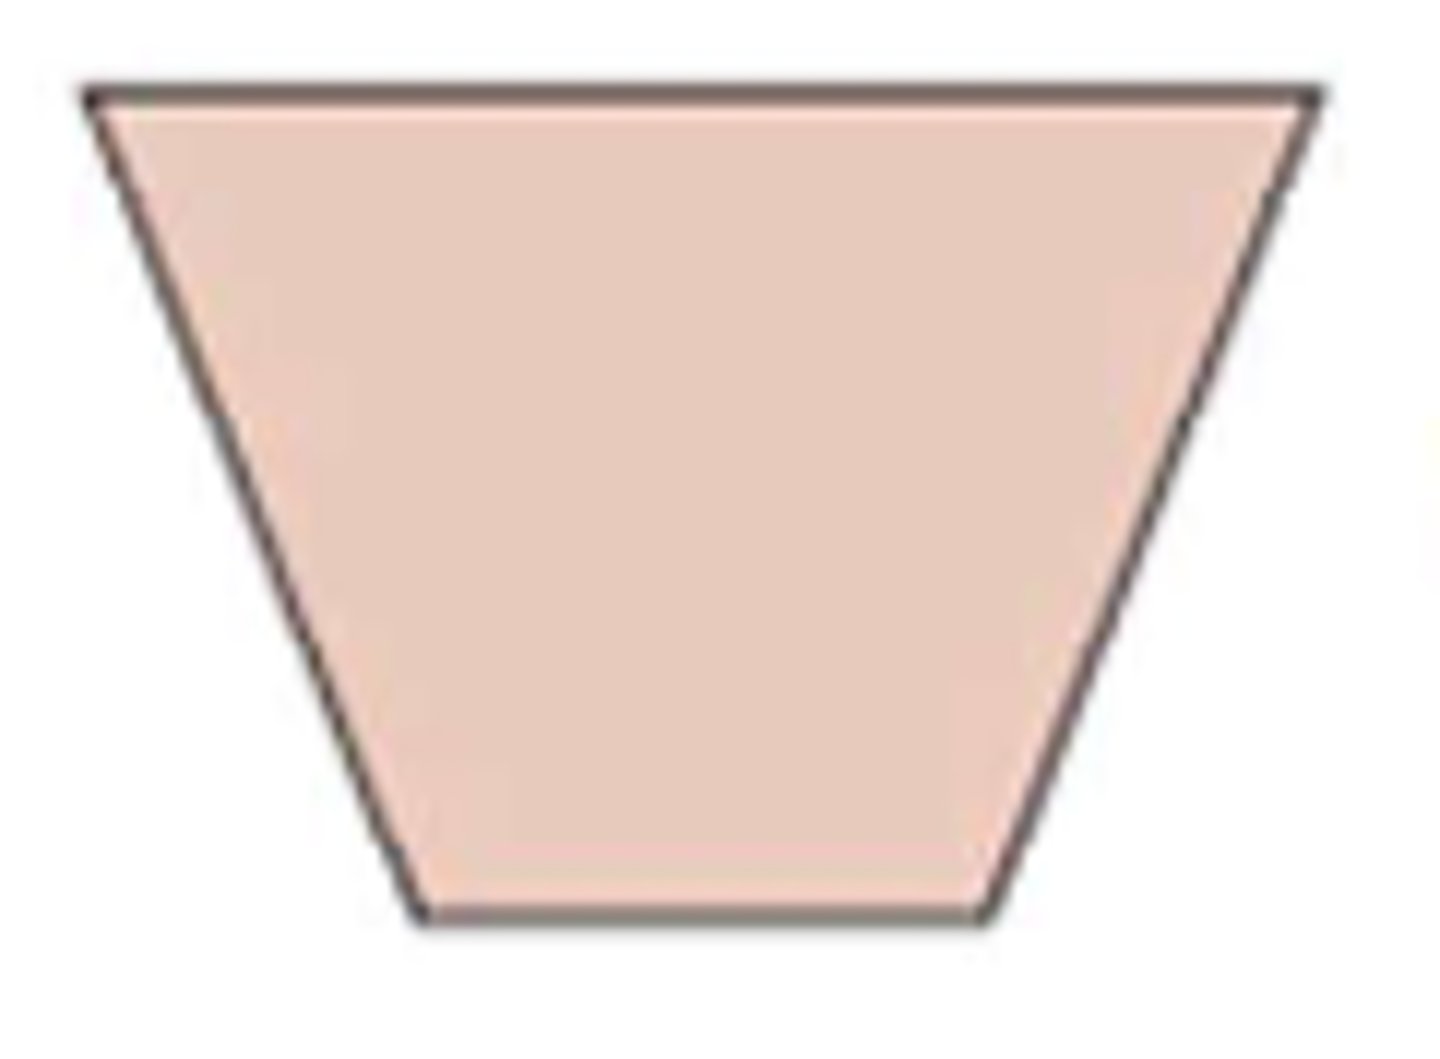
Flowchart symbols: manual operation (processing)
upside down trapezoid
operation performed manually
Flowchart symbols: database (storage)
cylinder

Flowchart symbols: magnetic tape (storage)
data stored on magnetic tape (type of backup storage medium)

Flowchart symbols: paper document file (storage)
upside down triangle with N
letter=way to order the files
n=numerically
a=alphabetically
d=by date

Flowchart symbols: journal/ledger (storage)
parallelogram

Flowchart symbols: document/processing flow (flow/miscellaneous)

Flowchart symbols: communication link (flow/miscellaneous)
zig zag arrow
transmission of data from one geographic location to another via communication lines

Flowchart symbols: on-page connector (flow/miscellaneous)
circle
connects flows to avoid lines crossing pages

Flowchart symbols: off-page connector (flow/miscellaneous)
upside down pentagon
entry from, or exit to, another page

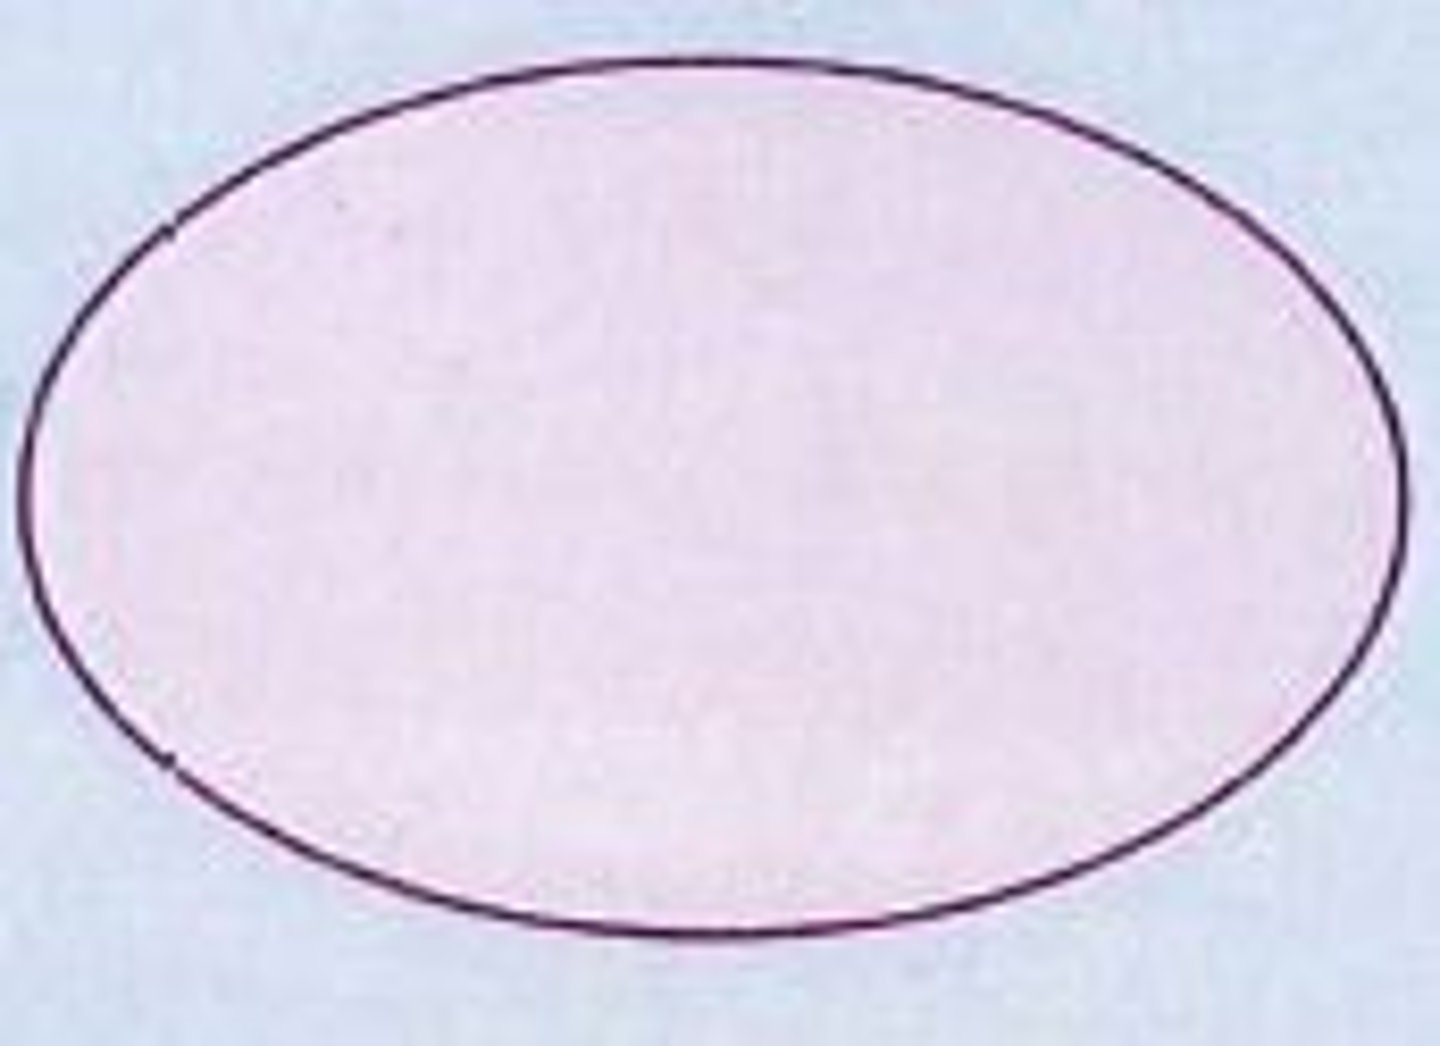
Flowchart symbols: terminal (flow/miscellaneous)
long oval
beg, end, or pt of interruption in a process
also represents external party
Flowchart symbols: decision (flow/miscellaneous)
diamond

Flowchart symbols: annotation (flow/miscellaneous)
sideways field goal
add clarifying/descriptive comments to a process
Internal control flowchart
Used to describe, analyze, and evaluate internal controls, including identifying system strengths, weaknesses, and inefficiencies
System flowchart
Depicts the relationships among *system input, processing, storage, and output
Program flowchart
Illustrates the sequence of logical operations performed by a computer in executing a program
A program flowchart describes the specific logic used to perform a process shown on a system flowchart
Remittance advice
a copy of the sales invoice returned with a customer's payment that indicates the invoices, statements, or other items being paid
explains what the pmt is for