Esri ArcGIS Pro Foundation Certification Review Test
 Call Kai
 Learn
Learn Practice Test
 Spaced Repetition
 Match
Match Flashcards
 Knowt Play
1/64

Earn XP
Description and Tags
Comprehensive vocabulary flashcards covering Esri ArcGIS Pro interface, coordinate systems, projections, data models, and spatial analysis per the lecture notes.
Name | Mastery | Learn | Test | Matching | Spaced | Call with Kai | Chat |
|---|
No analytics yet
Send a link to your students to track their progress
65 Terms
ArcGIS Pro User Interface Components
The three main components are the ribbon, views, and dockable panes.
Web Map
A web-based interactive visualization of geospatial content in two dimensions that contains data layers and basemaps.
Web Layer
A web-based sharing format that only contains the data layers without the basemaps.
Oblate Ellipsoid
The mathematical shape used to describe the earth.
Geographic Coordinate System (GCS)
Uses a three-dimensional spheroidal model to identify points or areas on the surface of the earth using a network of intersecting lines of latitude (parallels) and longitude (meridians) called the graticule.
Projected Coordinate System (PCS)
Transforms locations from the spheroidal earth to a flat map by converting latitude and longitude coordinates to planar coordinates (X,Y).
Graticule
The imaginary grid created from the intersecting lines of latitude and longitude drawn onto globes.
Spheroid
The mathematical model that estimates the size and shape of the earth; differences generally become visible at a scale of 1:5,000,000.
Datum
Defines the position of the spheroid relative to the center of the earth and provides a frame of reference for measuring locations on the surface of the earth.
Local Datum
A spheroid that is only accurate at a specific location where it aligns with the earth's surface.
Cylindrical Projection
A projection type used when the map area extends north–south; it represents meridians as straight vertical lines and parallels as straight horizontal lines intersecting at right angles.
Conic Projection
A projection type used when the map area extends east–west; it contacts the globe along a single latitude line called the standard parallel.
Azimuthal Projection
A projection type used when the map has equal extent in all directions; a point is tangent to the globe with longitude lines radiating outward from that point.
Conformal Projections
A type of map projection that preserves shape but distorts area.
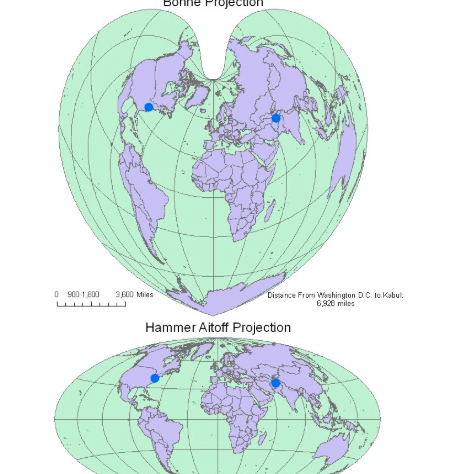
Equal-area Projections
A type of map projection that preserves area but distorts shape.
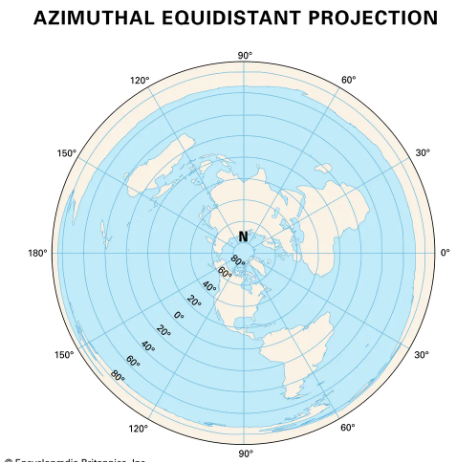
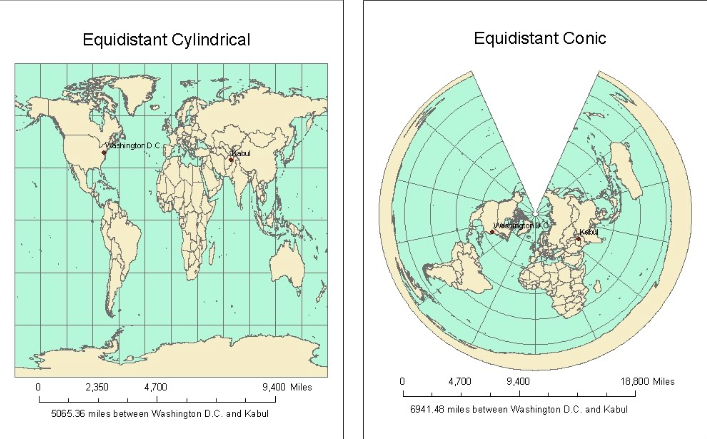
Equidistant Projections
A type of map projection that preserves true scale between one or two points to every other point on the map, or along every meridian.
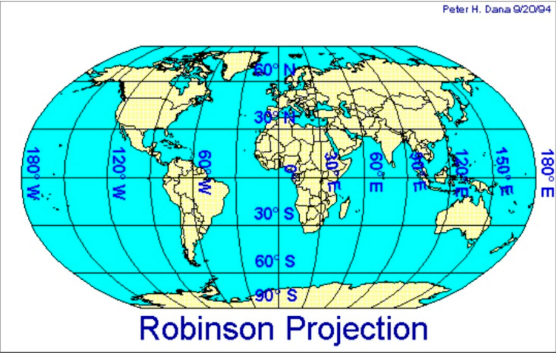
Compromise Projections
A type of map projection that preserves none of the four spatial properties (shape, area, distance, or direction) but distorts all of them slightly to minimize overall distortion.
Geocoding
The process of transforming a location's description, such as coordinates, an address, or a place-name, into a location on the earth's surface.
Locator
A tool that ties the location descriptions in input data to geographic coordinates to place features on a map.
Composite Locator
A locator made of multiple other locators rather than a single table of reference data.
Vector Data
A data model composed of discrete points, lines, and polygons, consisting of both geometry and attributes.
Raster Data
A data model composed of a grid of equally sized cells or pixels, often used for continuous data or imagery.
Metadata
Specific information describing data characters, such as quality and source, often referred to as ‘data about data.’
Discrete Data
Data representing real-world features that have well-defined boundaries.
Continuous Data
Data representing real-world phenomena that do not have well-defined boundaries, such as elevation or temperature.
Large Scale Map
A map with a scale larger than 1:500,000 (e.g., 1:17,000) that appears zoomed-in and shows more detail for a specific location.
Small Scale Map
A map with a scale smaller than 1:1,000,000 that appears zoomed-out and covers a large geographic area.
Snapping
The process of moving a feature to coincide with another point's or feature's coordinates when the pointer is within a specified distance.
Static Map
A stationary graphic representation of spatial relationships that can be printed or produced as a digital file, containing map layouts and layout elements.
Web Scene
A web-based interactive visualization of geospatial content in three dimensions that can be viewed from different perspectives.
Nominal Measurement
A qualitative level of measurement containing simple names or categories with no inherent order.
Ordinal Measurement
A qualitative level of measurement where data can be ordered (e.g., low, medium, high) but differences between values cannot be measured.
Interval Data
Quantitative data with consistent intervals between values but no true zero point.
Ratio Data
Quantitative data with consistent intervals and a true zero point, such as population density.
Natural Breaks (Jenks)
A classification method where both the intervals between class breaks and the number of observations within each class are unequal.
Quantile
A classification method where the intervals between class breaks are unequal, but the number of observations within each class is equal.
Sequential Color Scheme
A quantitative color scheme that trends in one direction (light to dark), where lighter colors represent lower values and darker colors represent higher values.
Diverging Color Scheme
A two-way color scheme show quantitative data that has a middle or average value and progresses toward two extremes.
Euclidean Distance
Distance measured on a 2D Cartesian (x,y) plane, representing the shortest path from point A to B.
Geodesic Distance
Distance measured on a curved surface (geoid), used for measuring across large distances on the earth.
Intersect
An overlay method where only the features or portions of features that overlap in all input layers are written to the output feature class.
Union
An overlay analysis method where all features and their attributes from all input feature classes are written to the output feature class.
Spatial Join
An overlay method that writes target features and the joined attributes from the join features to the output feature class based on spatial relationship.
Project Package
A sharing format that includes maps, data, styles, tasks, toolboxes, and layouts for use in ArcGIS Pro.
Regression model equation: What does the dependent (Y) variable represent ?
The dependent variable (Y) in a regression model represents the phenomenon that you are trying to understand.
Regression model equation: What does the independent, or explanatory, variables (X) represent ?
The independent, or explanatory, variables (X) are the continuous variables that are used to model the dependent variable values.
Regression model equation: What does the regression coefficients (β) represent ?
The strength and the type of relationship that the explanatory variable has to the dependent variable. A β value exists for each explanatory variable.
Regression model equation: What does residuals (ε) represent ?
The unexplained portion of the dependent variable, represented in the regression equation as the random error.
Steps for performing Geographically Weighted Analysis
Correct answer: Evaluate a linear regression model, Perform GWR, Visualize results, Analyze results, Make predictions
A healthcare specialist wants to understand how multiple environmental factors affect the rates of asthma across the country. After performing global regression and what type of analysis in ArcGIS Pro, which action should the specialist perform?
Smart Mapping
Automatically identifies a field to symbolize and also suggests an appropriate symbology.
Which ArcGIS Online capability ensures that content is accessed by the correct people?
Which of the following describe why you would create a web app in ArcGIS Online?
When you are comparing regression models using the same dependent variable, which output statistic is useful because it takes model complexity into account when measuring overall model performance?
AICc (corrected Akaike Information Criterion)
AICc (corrected Akaike Information Criterion)
A version of the standard AIC used for statistical model selection.
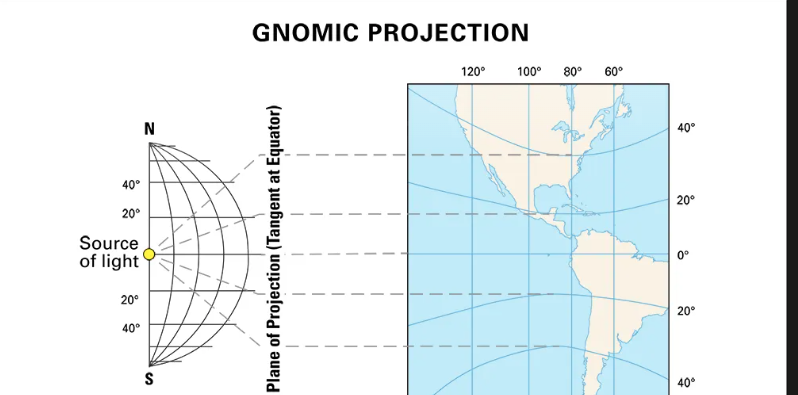
Gnomonic projections
Preserve the shortest route (distance and direction) but cannot preserve area.
Which two statements about projected coordinate systems are true?
A projected coordinate system gives linear measurements on a planar surface from a predefined starting point.
A projected coordinate system is represented by a graticule of intersecting parallels (latitude) and meridians (longitude).
A projected coordinate system's coordinates are measured in linear units, such as feet or meters.
A projected coordinate system uses a three dimensional spheroidal model to identify specific locations on the earth.
To create a map that has minimal distortion but does not perfectly preserve any of the four spatial properties, which type of projection should be used?
Compromise
What three surfaces are developable surfaces for creating map projections?
Cylinder, cone, plane
Three main components of geocoding
Input data, a locator, and reference data
How is x,y data used to locate a feature on a map?
The x value represents the east-west location and the y value represents the north-south location.
Float and Double field types represent what?
Decimal Numbers
Which two formats are for vector data?
Shapefiles
TIFF files
Raster datasets
Point feature classes
Shapefiles & Point feature classes

Which three sources are potential sources of GIS data?
MP4 videos
Business intelligence databases
MP3 datasets
Oracle databases
Microsoft Excel spreadsheets