Econ 2105 Exam 1
1/72
There's no tags or description
Looks like no tags are added yet.
Name | Mastery | Learn | Test | Matching | Spaced |
|---|
No study sessions yet.
73 Terms
Look again at Figure 3.1, which depicts the annual number of hours worked against GDP per capita in the US, France and the Netherlands, between 1870 and 2000. Which of the following is true?
Between 1870 and 2000, French people have managed to increase their GDP per capita more than ten-fold while more than halving the number of hours worked.
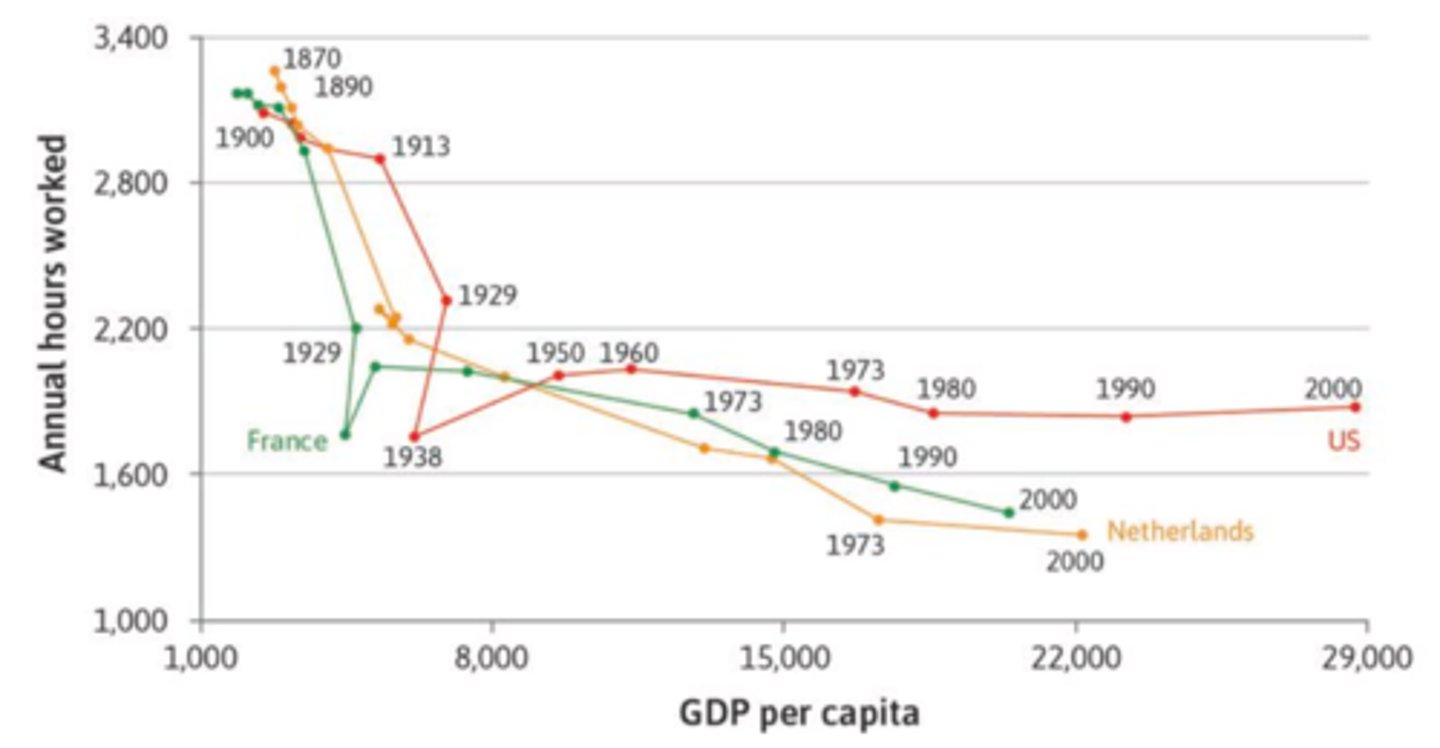
Figure 3.5 shows Alexei's production function, with the final grade (the output) related to the number of hours spent studying (the input).Which of the following is true?
The marginal product and average product are approximately the same for the initial hour.
Figure 3.6 shows Alexei's indifference curves for free time and final grade. Which of the following is true?
Alexei is indifferent between the grade of 84 with 15 hours of free time, and the grade of 50 with 20 hours of free time.
What is the marginal rate of substitution (MRS)?
The amount of one good that the consumer is willing to trade for one unit of the other.
The slope of the indifference curve.
You are a taxi driver in Melbourne who earns A$50 for a day's work. You have been offered a one-day ticket to the Australian Open for A$40. As a tennis fan, you value the experience at A$100. With this information, what can we say?
The economic rent of the day at the Open is A$10.
Look at Figure 3.5 which shows Alexei's production function: how the final grade (the output) depends on the number of hours spent studying (the input).Free time per day is given by 24 hours minus the hours of study per day. Consider Alexei's feasible set of combinations of final grade and hours of free time per day. What can we conclude?
The feasible frontier is a mirror image of the production function above.
The marginal product of labour at 10 hours of study equals the marginal rate of transformation at 14 hours of free time.
Figure 3.10a shows Alexei's feasible frontier and his indifference curves for final grade and hours of free time per day. Suppose that all students have the same feasible frontier, but their indifference curves may differ in shape and slope depending on their preferences.Use the diagram to decide which of the following is (are) correct.
Alexei will choose a point where the marginal rate of substitution equals the marginal rate of transformation.
The figures show Alexei's production function and his corresponding feasible frontier for final grade and hours of work or free time per day. They show the effect of an improvement in his studying technique, represented by the tilting up of the two curves.Consider now two cases of further changes in Alexei's study environment:Case A. He suddenly finds himself needing to spend 4 hours a day caring for a family member. (You may assume that his marginal product of labour is unaffected for the hours that he studies.)Case B. For health reasons his marginal product of labour for all hours is reduced by 10%.
For case A, Alexei's feasible frontier shifts to the left.
For case B, Alexei's feasible frontier rotates downwards, pivoted at the intercept with the horizontal axis.
Figure 2.1 shows an index of average real wages of skilled workers in London between 1264 and 2001. What can we conclude from this graph?
The average real wage increased by around 600% between 1850 and 2001.
Which of the following is an economic rent?
The extra profit that a successful innovator makes on bringing a new product to the market before its competitors.
Figure 2.3 shows different technologies for producing 100 metres of cloth.From the graph, what can we conclude?
Technology B dominates technology D.
Look at the three isocost lines in Figure 2.8.Based on this information, what can we conclude?
Isocosts MN and FG represent the same price ratio (wage/price of coal) but different total costs of production.
Look again at Figure 2.12 which depicts isocost lines for the 1600s and the 1700s in Britain.Which of the following is true?
The comparison between isocost line FG and the parallel isocost going through B suggests that an innovation rent was earned in 1700s Britain when firms moved from technology B to A.
Look again at Figure 2.14b which depicts the production function of grain for farmers under average growing conditions with the currently available technology.We can ascertain that:
A discovery of new high-yielding crop seeds would tilt the production function curve higher, pivoted anti-clockwise at the origin.
If there is an upper limit on the amount of grain that can be produced, then the curve will end up horizontal for large numbers of farmers.
Look again at Figure 2.1 and Figure 2.19 showing graphs of real wages in England between 1300 and 2000.You are also told the following facts:During the bubonic plague of 1348 and 1351, between one-quarter and one-third of Europe's population died.In the seventeenth and eighteenth centuries, the wages of unskilled workers relative to the incomes of land owners were only one-fifth of what they had been in the sixteenth century.What can we conclude from this information?
According to the Malthusian model, the fall in the population due to the bubonic plague would have led to an increase in the average productivity of workers, causing the observed rise in the real wage post-plague.
Look again at Figure 2.20, which plots real wages against population in England from the 1280s to the 1860s.According to Malthus, with diminishing average product of labour in production and population growth in response to increases in real wages, an increase in productivity will result in a larger population but not higher real wages in the long run. Based on the information above, which of the following statements is correct?
The Malthusian model does not take into account the possibility of a persistent positive technology shock that may offset the diminishing average product of labour.
What does UK GDP per capita measure?
the total output of the UK's economy, divided by the country's population
The GDP per capita of Greece was $22,494 in 2012 and $21,966 in 2013. Based on these figures, the growth rate of GDP between 2012 and 2013 (to two decimal places) was:
-0.0235
Which of the following variables have followed the so-called 'hockey-stick trajectory' that is, little to no growth for most of history followed by a sudden and sharp change to a positive growth rate?
GDP per capita
labour productivity
atmospheric CO2
Which of the following are examples of private property?
computers belonging to your college
shares in a company
Which of the following are examples of markets?
auction websites such as eBay
touts selling tickets outside concert halls
sale of illegal arms
Look again at Figure 1.10, which shows a graph of GDP per capita for West and East Germany, Japan and Spain between 1950 and 1990. Which of the following statements is correct?
Spain was able to grow at a higher growth rate than Germany between 1950 and 1990.
Look again at Figure 1.11. Which of these conclusions is suggested by the graph?
The contrasting performances of Botswana and Nigeria illustrate that rich natural resources alone do not guarantee higher economic growth, but that higher quality institutions (government, markets and firms) may also be necessary.
The GDP in current US$ for selected countries and the world are given below in $ billions (source: World Bank). Based on this information, which of the following statements is correct?
Of the four countries, Nigeria was the only country that had a higher growth rate than that of the world over the 15 years.
Which of the following are examples of capital goods?
Buildings.
Intellectual property.
Patents.
Raw materials.
The following are the 2016 GDP per capita in current US$ and purchasing power parity (PPP) of the US, Iceland, and Singapore (taken from http://data.worldbank.org). Based on this information, which of the following statements are correct?
Using the PPP measure of GDP per capita reflects the real purchasing power of the country.
Let SG$ X be the amount of Singapore dollars that can be bought for 1 US$ at the current market exchange rate. Then SG$ X would buy much more goods and services in Singapore than 1 US$ would do in the US.
An individual's well-being can be partly measured by:
Goods and services that are provided by the government, such as healthcare and education.
The quality of her social and physical environment, such as friendship and clean air.
Her disposable income.
Goods and services that are produced within the household, such as meals and childcare.
Eden, a country, produces just two output goods: apples and snakeskin handbags. The quantities produced and the prices of the two goods in 2016 and 2017 (in $) are given below. Based on this information, which of the following statements is correct?
Nominal GDP growth rate between 2016 and 2017 was 9.1%.
In the following diagram you are given two technologies, A and B, which can produce 100 metres of cloth. Technology A uses 1 worker and 4 tonnes of coal, while technology B uses 4 workers and 2 tonnes of coal. The diagram also depicts three examples of isocosts, NM, GF and JH. The wage cost and the price of coal are denoted by w and p, respectively. Which of the following statements is correct?
When w = $20 and p = $10, the cost of using technology A is $60.
The following graph shows wages relative to the cost of capital in England and France from 1580 to 1830. Based on this information, which of the following statements is correct?
On a graph with the number of workers on the horizontal axis and the amount of capital on the vertical axis, the graph for England represents a steepening of the isocost lines.
The following figure is an index (base 1850) of average real wages of skilled workers in London between 1264 and 2001. Based on this information, which of the following statements is correct?
The shape of the graph would be the same even if a different year was used as the base year.
The following figures show the real wage index in England from 1750 to 2000, and the explanation of how England escaped the Malthusian trap. Based on this information, which of the following statements is correct?
The graph demonstrates the importance of higher bargaining power in order for workers to benefit from higher labour productivity.
The following table gives different technologies that produce 100 metres of cloth. Based on this information, which of the following statements is correct?
You would never choose technology B.
Production of cloth requires two inputs: L workers and R tonnes of coal. The following diagram depicts the isocost associated with production. You are also given that the wage (w) is $20 and the price (p) of coal is $30. Which of the following statements is correct?
The isocost suggests that the cost of using 6 workers and 2 tonnes of coal is the same as that of using 3 workers and 4 tonnes of coal.
You currently work for 40 hours a week at wage rate of GBP 12 an hour. Your free hours are defined as the number of hours not in work, which in this case is 24 hours x 7 days - 40 hours = 128 hours per week. Suppose that you are happy to keep your total weekly income constant. Then:
To have 12.5% more free time, your wage rate needs to increase by GBP 8.
The figure shows a student's feasible frontier and her indifference curves for her final exam grade and the hours of free time per day. Based on this information, which of the following statements is correct?
Any points above IC3 are strictly preferred to the student's final choice but are unattainable.
The figure shows a student's feasible frontier and her indifference curves for final exam marks and the hours of free time per day. The table also gives the marginal rate of substitution (MRS) and the marginal rate of transformation (MRT) for the points shown in the figure. Based on this information, which of the following statements is correct?
At A, one hour of free time is equivalent in value to 3 grade points. However, 1 extra hour of studying leads to 9 extra grade points. She should therefore study more.
The following table shows the hours of free time and consumption per day across five different countries in 2013. The diagram below shows this data, along with hypothetical indifference curves. Based on this information, which of the following statements is correct?
There is evidence that the US workers value free time more relative to consumption compared to South Korean workers.
The table shows the study time, study environment and the resulting grade (average GPA) for 84 students. Based on this information, which of the following statements are correct?
Holding environment constant, high study time leads to a better grade.
More students spend a longer time studying if their environment was bad compared to if their environment was good.
The figure shows a student's production function with the final grade (the output) related to the number of hours spent studying (the input). Which of the following statements regarding the average product of labour (APL) is correct?
The APL is decreasing beyond 15 hours of study.
You are given the following table for a student's production function with the final grade (the output) related to the number of hours spent studying (the input). Which of the following options correctly fills in a missing number?
14
The figure shows the indifference curves of a student for the two 'goods', free time and final grade. Based on this information, which of the following statements is correct?
At A, the student is willing to give up 34 grade points for five extra hours of free time.
Eden, a country, produces just two output goods: apples and snakeskin handbags. In 2014 the prices of apples and handbags were $10 and $24, respectively. In 2015, the prices increased to $12 and $25. The quantities produced of the two goods were 100 and 20, respectively, in both 2014 and 2015. From this information, we can conclude that:
The nominal GDP growth rate between 2014 and 2015 is 14.9%.
The real GDP is unchanged between 2014 and 2015.
The nominal GDP in 2014 is $1,480.
Which of the following statements are correct?
In economics, a model is a simplified representation (diagrammatical or physical) that helps us to understand what is going on by focusing attention on what is important.
An economic rent is the benefit you receive above what you would have earned from your reservation option.
The following diagram depicts the production function of the farmers, where diminishing average product of labour is assumed. At A the average product of labour is 500,000/800 = 625 kg of grain per farmer. At B the average product of labour is 732,000/1,600 = 458 kg of grain per farmer. If you know that the grain output for 2,800 farmers is 894,000kg, then which of the following statements are correct?
The slopes of the rays from the origin to the production function decrease along the curve, indicating that the average product of labour is decreasing.
If the production function curve is an upward-sloping straight line, then there is no diminishing average product of labour.
The average product of labour is diminishing when:
The marginal product of labour is negative.
The marginal product of labour is smaller than the average product of labour.
The production function is concave.
The country of Shangri-La has only two inhabitants, Mr. High and Mr. Low. Mr. High's nominal income is twice as large as Mr. Low's. The personal price index of Mr. High from 2015 to 2016 is 2 (that is, the price index of the bundle of goods he consumes doubles), and from 2016 to 2017 it is 1/2. The personal price index of Mr. Low from 2015 to 2016 is 5, and from 2016 to 2017 it is 1/5. Which of the following statements are true:
The price index of Shangri-La from 2015 to 2016 is 3.
The price index of Mr. High from 2015 to 2017 is 1.
The following diagram depicts the production function of grain, where diminishing average product of labour is assumed. At A the average product of labour is 500,000/800 = 625 kg of grain per farmer. At B the average product of labour is 732,000/1,600 = 457.5 kg of grain per farmer. If you know that the grain output for 2,800 farmers is 896,000kg, then which of the following statements is/are correct?
When the labour input is 2,800, the average product of labour is 320 kg.
If the production curve is an upward-sloping straight line, the average product of labour is constant.
The following graphs show the world population in millions from 1000 to 2010 and the world population growth rate in the 20th century. Based on this information, which of the following statements is correct?
There has been a 600% increase in the world population over the past 200 years.
Which of the following are classified as firms?
Companies employing unpaid student interns as well as paid workers.
Which of the following statements regarding democracy as a political system is always true?
Virtually all adults are eligible to vote in an election.
Consider a world of just two individuals, Greta and Carlos, who each need both of two goods, apples and wheat, to survive. They differ in how productive they are in growing apples and wheat. Based on this information, which of the following statements is correct?
Carlos has a comparative disadvantage in producing apples.
The following table shows the nominal GDP (in current millions of US dollars) and the population (in thousands) of the US, China, and Luxemburg in 2015 (source: The World Bank). Based on this information which of the following statements is correct?
Luxembourg's GDP per capita was 12.6 times that of China's.
Which of the following statements regarding Malthusianism are correct?
Malthus held that a sustained increase in income per capita would be impossible.
According to Malthusianism, the rise in productivity of labour would be offset by population growth
The following table describes the production function of cloth. Based on this information, which of the following statements is correct?
As the number of workers is increased from 100 to 500, the average product of labour falls by 20%.
Which of the following statements regarding the Malthusian model are correct when there is a positive one-off technological shock (such as an improved seed)?
Income initially rises but then falls to the subsistence level in equilibrium.
The following diagram plots the path of the UK's real wage index against its population over the years 1280- 1600. Based on this information, which of the following statements are correct?
The graph shows a negative correlation between the real wage index and the UK population.
The UK population consistently shrunk during the 14th century.
The graph is consistent with the Malthusian trap story that high real wages encourage population growth, while a larger population forces real wages to fall back to subsistence level.
Which of the following statements is correct?
Equilibrium is a self-perpetuating situation that does not change, unless a force for change is introduced from the outside and alters the basic data describing the situation.
Which of the following statements is correct?
If you are paid a fixed salary independent of your output, then you may be tempted to put in less effort. This is an example of an economic incentive.
Production of cloth requires two inputs: L workers and R tonnes of coal. The isocosts are given by the equation: c = wL + pR for different total costs c, where w is the wage rate and p is the price of coal. If w = 10, p = $20 and the cost associated with a particular isocost is c = $40, which of the following statements are correct? (Assume that the number of workers is on the horizontal (x) axis and the tonnes of coal is on the vertical (y) axis).
The intercept of the isocost on the y-axis is 2.
The isocost goes through the point (L, R) = (2, 1).
Consider indifference curves for consumption of milk and chocolates (you may assume that both are 'goods'.) The indifference curves are drawn with number of chocolate bars on the horizontal axis and pints of milk on the vertical axis. Consumer A has a much stronger preference for chocolates relative to milk than consumer B. Compared to B's indifference curves, A's indifference curves are:
Steeper.
The diagram shows a student's indifference curves for hours of free time per day and final grade. Based on this graph, which of the following statements is correct?
The marginal rate of substitution at B is smaller than 9.
You have two choices for how you are going to spend Saturday evening. You can go to the pub with your friends, which will cost you GBP 30 for the evening. The pleasure you anticipate from this experience is worth GBP 50 to you. Or, you can go to the theatre. The ticket will cost you GBP 50, but you value the experience at GBP 60. Based on this information, which of the following statements is correct?
The economic cost of going to the pub is GBP 40.
The following diagram shows a farmer's choice between free time and grain before (A) and after (B) an improvement in technology. Based on this information, which of the following statements are correct?
If the MRS of the indifference curve at B is larger than the MRS of the indifference curve at A, then this gives the farmer an incentive to take more free time after the technology improvement.
The farmer may choose a point on either side of B after the technology improvement.
The figure depicts the annual number of hours worked against GDP per capita in the US, France, and the Netherlands between 1870 and 2000. Which of the following is true?
The Great Depression in 1929 had the effect of reducing both hours worked and output in both the US and France.
The figure shows a student's production function with the final grade (the output) related to the number of hours spent studying (the input). Which of the following statements regarding marginal product of labour (MPL) are correct?
The MPL is the slope of the tangent line.
Beyond the first hour, the MPL is strictly less than the average product of labour.
Currently, you work for 40 hours per week for a wage of GBP 20 an hour. Your free hours are defined as the number of hours per week not spent working, which in this case is (24 hours x 7 days) - 40 hours = 128 hours per week. Suppose now that your wage rate has increased by 25%. If you are happy to keep your total weekly income constant, then:
Your total number of free hours per week will increase by 6.25%.
Consider an individual's indifference curves for the consumption of two goods (things you would like to have more of). In this case, which of the following statements are true?
The indifference curves are downward-sloping.
The following diagram is the feasible set of a student, showing the combinations of her final grade and the hours of free time per day. Based on this information, we can say that:
The marginal rate of transformation at A is 3, meaning that the student can 'transform' one hour of free time into 3 extra points on her grade.
After finishing university, Rani has three choices, listed in order of preference: (1) study for a MSc at UCL, (2) work at Barclays, or (3) take a gap year. Her opportunity cost of studying at UCL includes which of the following:
The income she would have earned at Barclays.
Which of the following characterise capitalism as an economic system?
Many forms of production are organized by and take place in firms
Production is undertaken for the purposes of making a profit.
The country of Eden produces just two goods, apples and snake-skin handbags. In 2014 the prices of apples and handbags were 10 and 24, respectively. In 2015, the prices increased to 12 and 25. The quantities produced of the two goods were unchanged in both 2014 and 2015, at 100 and 20. From this information, we can conclude that:
The nominal GDP in 2014 is 1,480.
The real GDP is unchanged between 2014 and 2015.
The nominal GDP growth rate between 2014 and 2015 is 14.9%.
The following diagram depicts the production function of the farmers, where diminishing average product of labour is assumed. If you know that that for 2,800 farmers, the grain output is 894,000 kilos, then.
The decreasing slopes of the rays from the origin to the production function along the curve indicate the decreasing average product of labour.
If the production function curve is an upward-sloping straight line, then there is no diminishing average product of labour.