stats exam one
1/57
There's no tags or description
Looks like no tags are added yet.
Name | Mastery | Learn | Test | Matching | Spaced | Call with Kai |
|---|
No analytics yet
Send a link to your students to track their progress
58 Terms
stats
set of mathematical procedures for organizing, summarizing, and interpreting information
population
entire set of individuals of interest
sample
set of individuals of interest selected from the population
variable
characteristics that can vary in values for different individuals. no manipulation or calculation
data
measurements and observations of variables
dataset
collection of data or list of numbers
score/raw score
single measurement/observation
statistic
value that describes a sample
parameter
value that describes a population
descriptive stats
used to summarize, organize, simplify data
inferential stats
allow us to use samples to make generalizations about the population
sampling error
error that exists between sample stats and population parameters
independent variable
manipulated by experimenter before observation of DV
dependent variable
observed variable. not manipulated
discrete variable
no values exists between different levels of variable. only whole numbers
continuous variable
infinite number of values exist between different levels of variables. can be decimals
nominal
categories are mutually exclusive and not ordered. species of animal
ordinal
order matters but the difference is between values is not informative. place in a race
interval
order matters but difference between values is informative. temperature- there no such thing as no temperature
ratio
interval variable and true definition of zero. zero pieces of candy eaten
frequency table
organizes a dataset by illistrating the frequency of each value for a variable
bar graph
used to graph nominal and ordinal data. x-axis (categories) y-axis (numbers)
histogram
used to graph interval and ratio data x-axis (frequency) y-axis (values)
normal curve
one peak, symmetrical, most values fall under
skewed curve
scores tend to pile up on one end of scale
positive (right) skew
tail is on right end of scale. curve is on left
negative (left) skew
tail is on left end of scale. curve is on right
kurtosis
heaviness of the tails of a distribution
leptokurtic
higher peak, heavier tails
playkurtic
flatter peak, lighter tail
central tendency
stats measure that attempts to determine the single value that is most represented of a set of scores (can be 2 scores)
measures of central tendency
mean, median, mode
mean
average of all scores. sum of all scores divided by number of scores
population mean formula
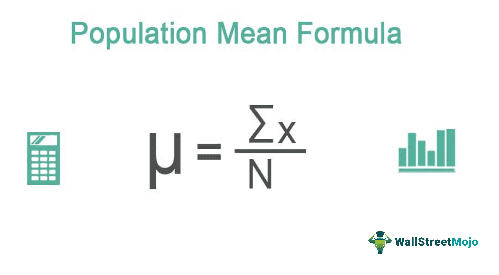
sample mean formula
M= sum of all (X)/ n
median
midpoint of all scores. used when extreme scores/skewness of distribution
mode
score that has the greatest frequency/ use when nominal and discrete variables
measures of variability
measure of differences among scores in a dataset. degree to which scores are spread out or clustered together. range, SD, variance
range
distance covered by scores in a distribution. calculate smallest score from largest score
standard deviation
determines how far the average score in a dataset is from the mean
variance formula
SD squared
standard deviation formula
square root of variance
deviation
distance between a score and the mean
variance formula population
sum of all (x- mu) squared/ N
z scores
indicated the location of each raw score within a distribution. how many SD above or below the mean a score is (can be positive or negative)
magnitude
how near (smaller) or far (larger) the raw score is from the mean
z score formula
= x- mu/ sigma
z score distribution
every raw score has been transformed into corresponding z score. shape always stays the same
mean of z distribution is
0
SD of z score distribution is
1
sample size symbol
n
population size symbol
N
sample mean symbol
M
population mean symbol
μ
sample standard deviation symbol
s
population standard deviation symbol
σ
sample variance symbol
s²
population variance symbol
σ²