Lecture 5 - Short Term Patterns
1/69
There's no tags or description
Looks like no tags are added yet.
Name | Mastery | Learn | Test | Matching | Spaced |
|---|
No study sessions yet.
70 Terms
Short term patterns
Small number of bars or candlesticks forming the pattern
Basis for short term patterns is to:
Anticipate a sudden move
Take advantage of a period when prices have reached an emotional extreme
Setup
Occurs when certain known factors needed to establish the pattern have occured, and the trader is waiting for the action signal to occur
A short term reversal pattern should only be considered necessary when:
prices are at some sort of support or resistance level, or trend line
The ____ complex the pattern, the _____ frequently it is going to occur
more, less
Principal Data used in short term patterns
Open, close, high, low
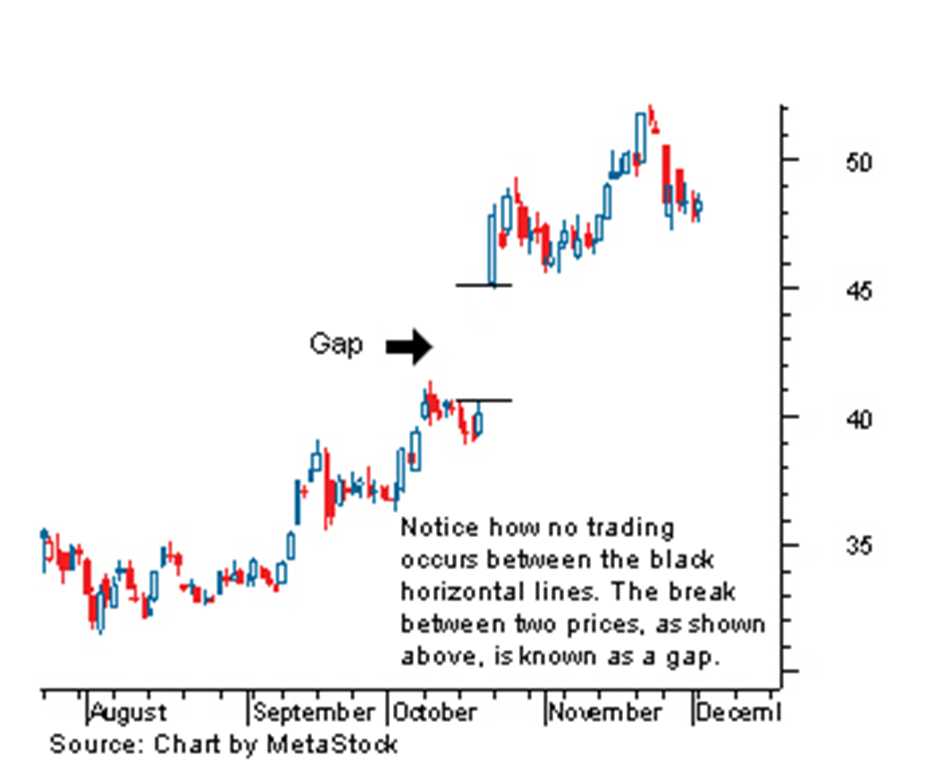
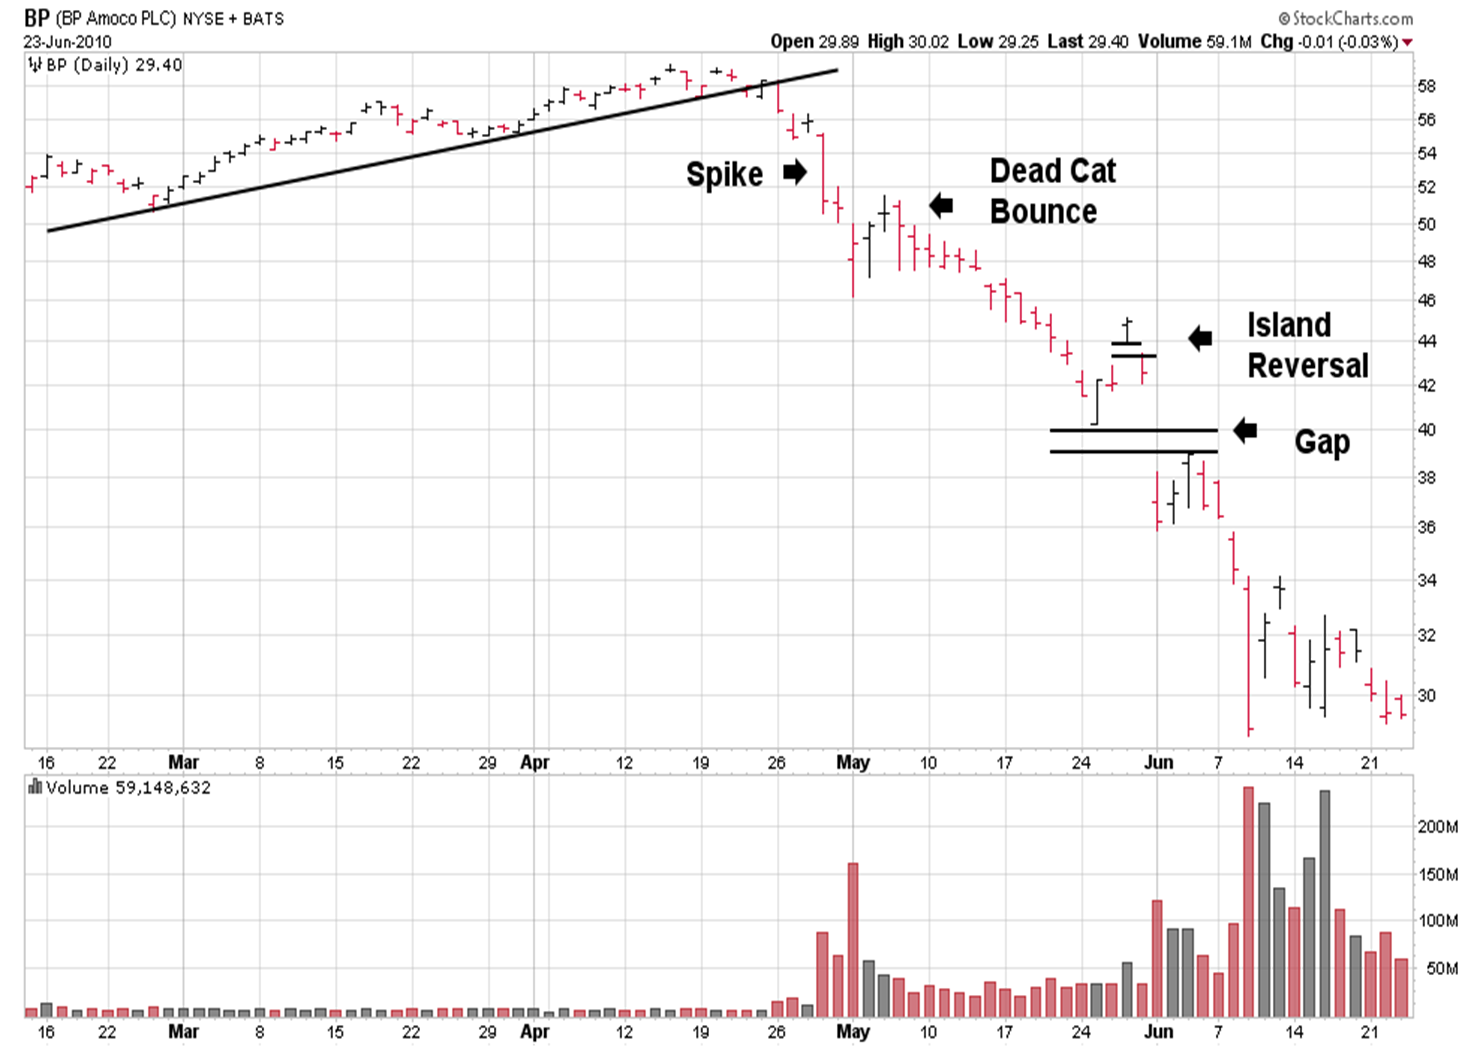
Gaps
Occur when either the low for the current bar is above the high of the previous bar or the high for the current bar is lower than the low of the previous bar
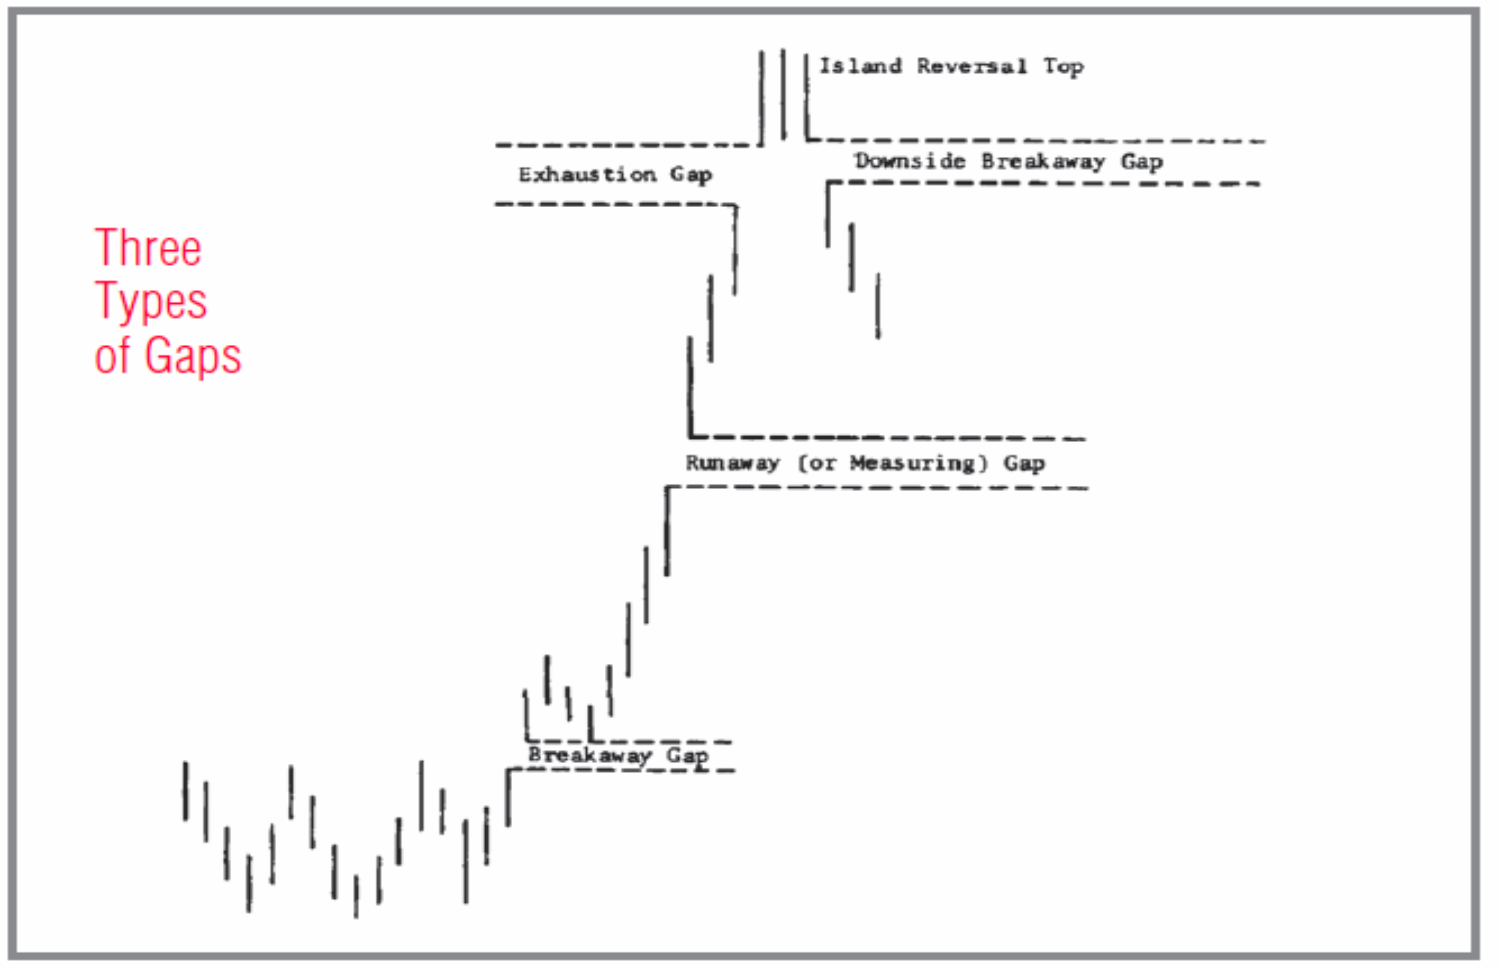
4 Types of Gaps
Opening Gap
Breakaway Gap
Runaway Gap
Exhaustion Gap
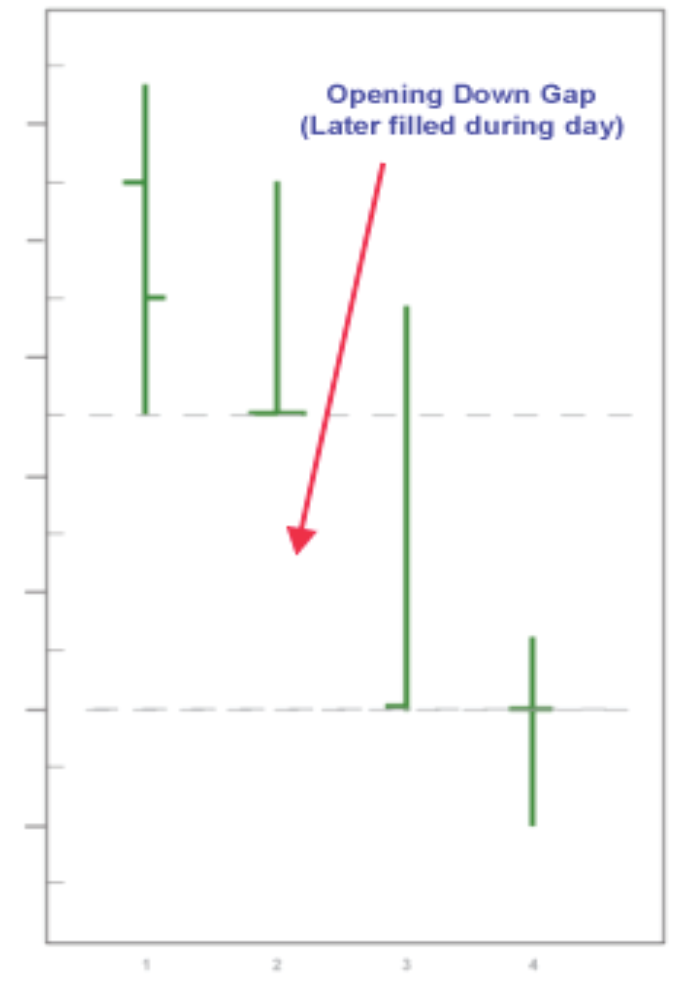
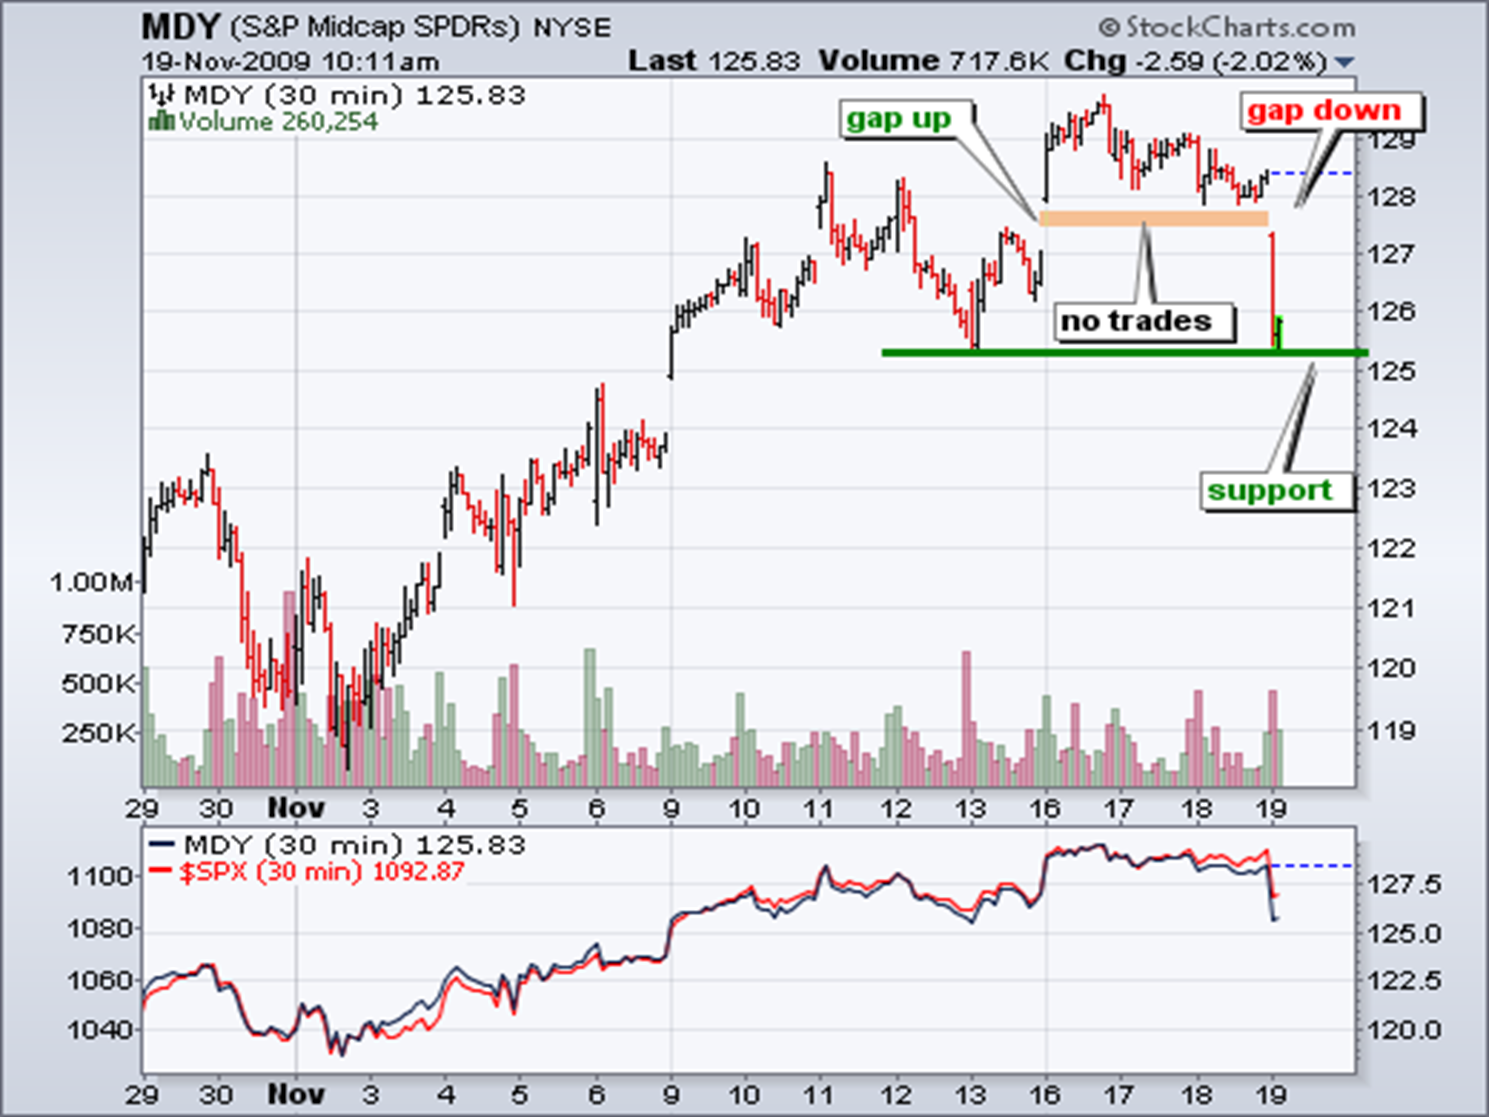
Opening Gaps
Occur when the opening price for the day is outside the range of the previous day
Opening gap rule
If the gap is not filled within the first 30 minutes of trading, chances are that the trend will continue if the direction of the gap
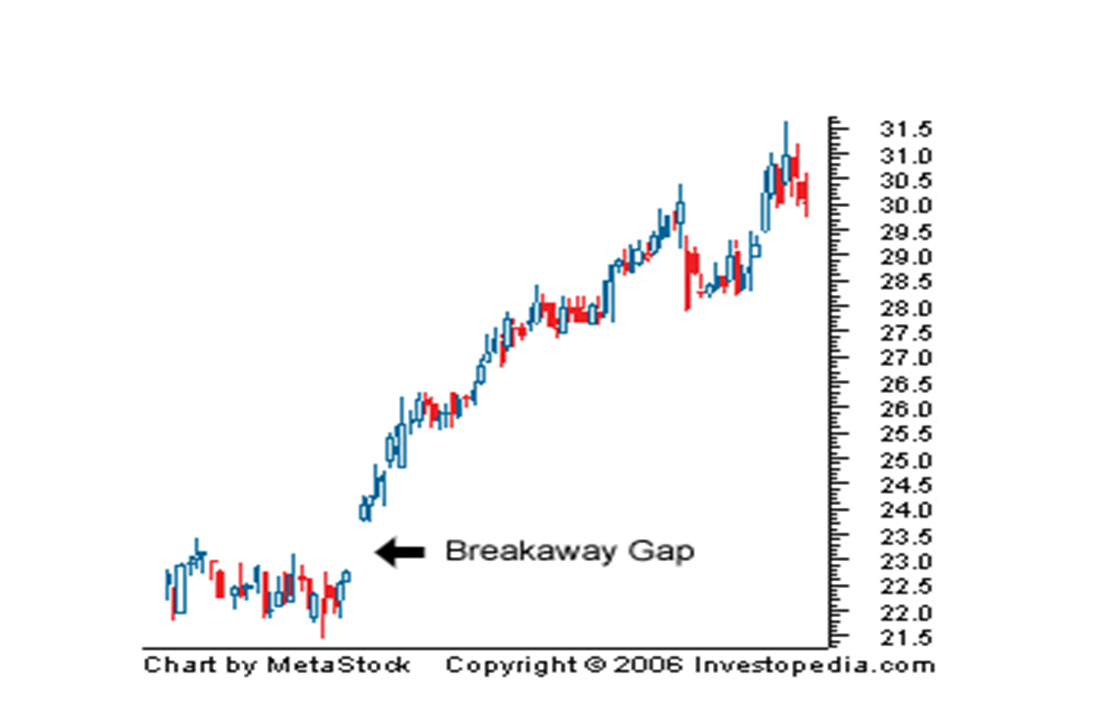
Breakaway Gap
Occurs at the beginning of a trend, most profitable gaps
Upward gaps are usually accompanied by heavy volume
Start of a new trend
Opening Gap graph
Breakaway Gap graph
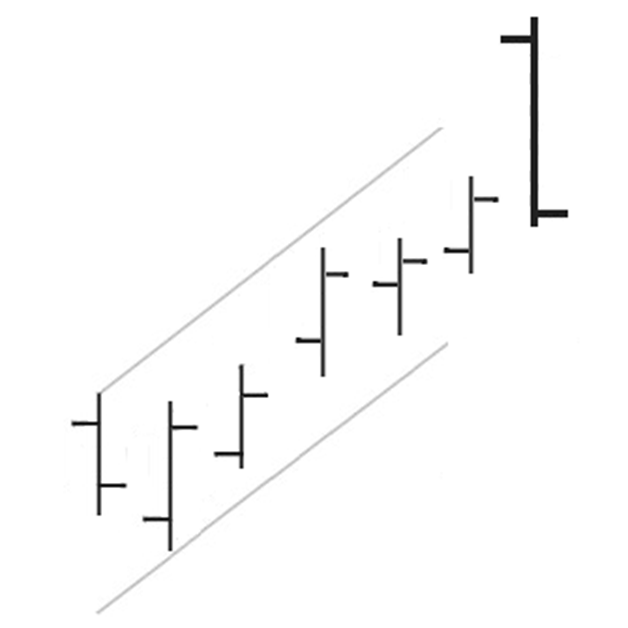
Runaway Gaps
Occurs along the trend - also called measuring gaps as they occur in the middle of a price fun
Runaway Gap graph
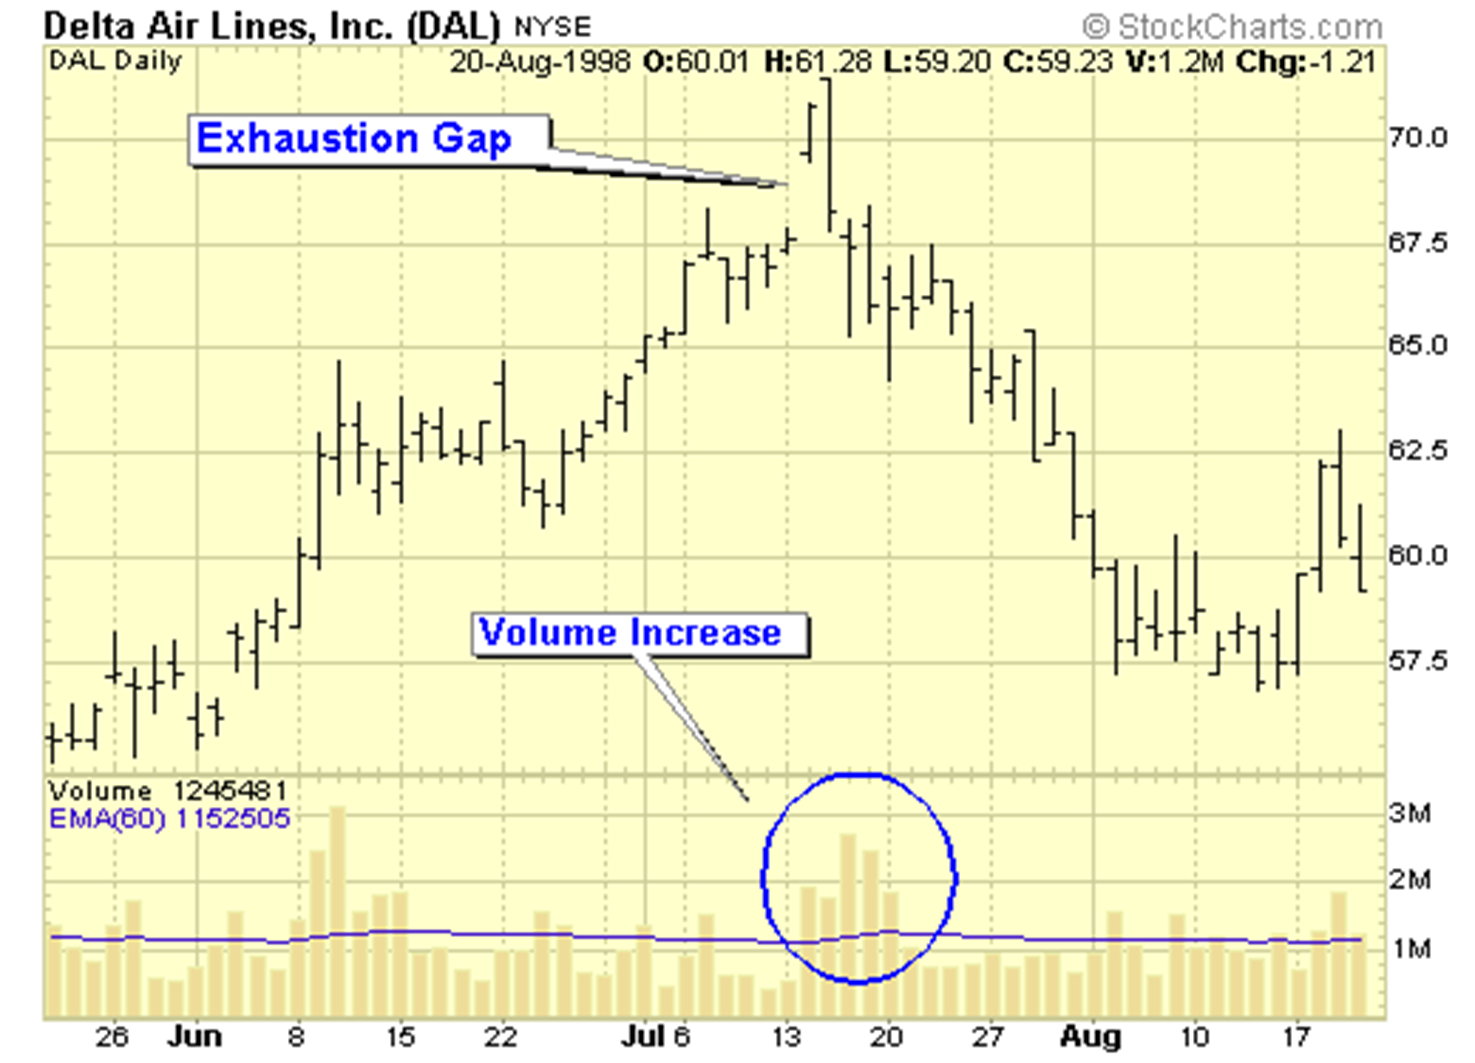
Exhaustion Gaps
Occur at the end of the moves but are not recognized at that time, because they have the same as runaway gaps
If gap is later closed, it is likely an exhaustion gap
If a gap fills after a long runaway trend, you can assume it is this gaps
Exhaustion Gap graph
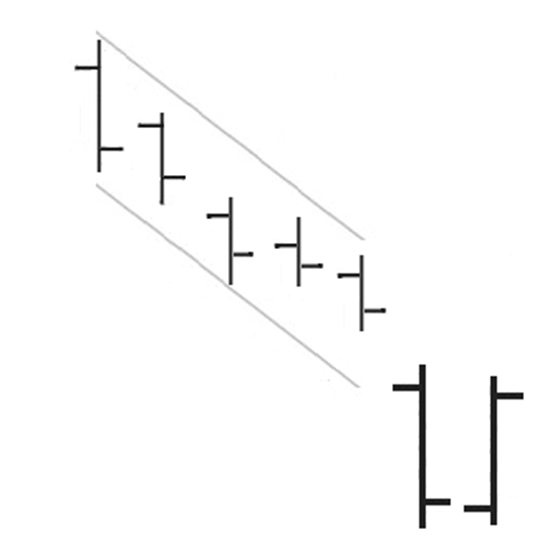
Island Reversal
Can occur at either the top or bottom and only occurs after a relatively lengthy trend
Requires 2 gaps at roughly the same price: first in the direction of the trend (exhaustion gap) and the second in the reverse direction (breakaway gap)
Volume inside the gap is low normally
Island Reversal graph
Summary of Classic Gaps
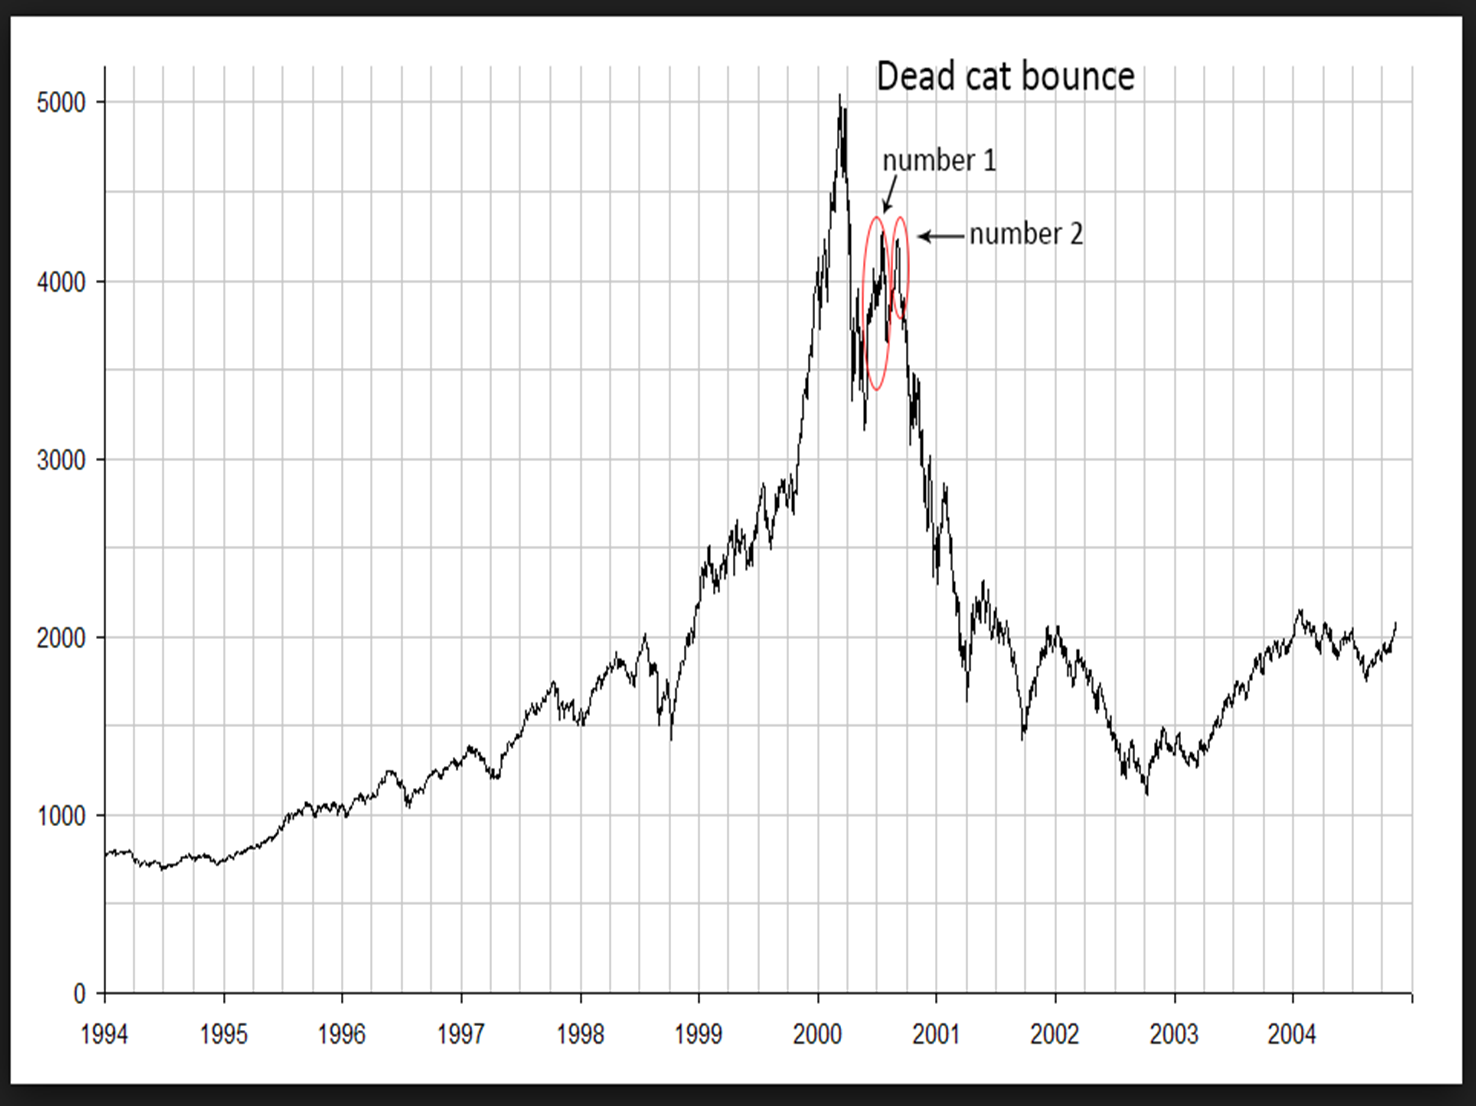
Dead Cat Bounce
Term for a failed rally after a sharp decline
Short rally lasting from several days to up to 2 weeks, following an event decline (game changing event, loss of patent, filing for bankruptcy protection, etc…)
Event that declines that precede the dead cat bounce is 20%
Should not go back to its peak
Dead Cat bounce graph
Spikes
Similar to gaps except that the empty space associated with a gap is a solid line
One long bar, crazy motion (wide range/large long range bar)
Also occur on dissemination of news
Normally takes place at the end of a gap
Graph that has Spike, Dead Cat Bounce, Island Reversal and Gap
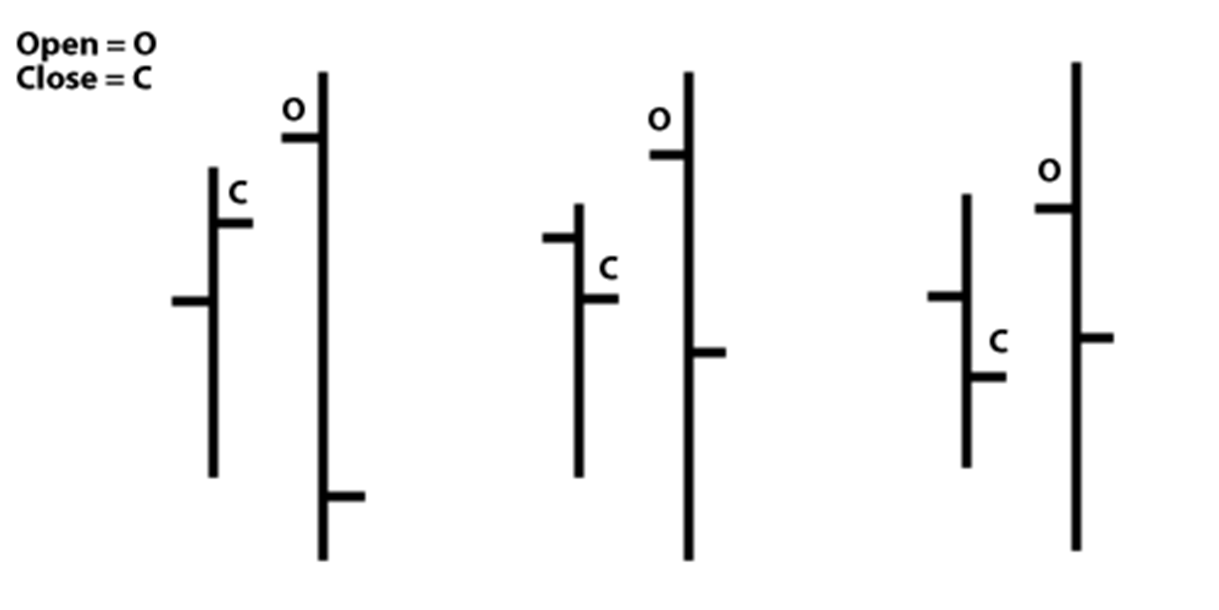
One Bar Reversal Pattern
When a trading bar high is greater than the previous bar high and the close is down from the previous bar close
Occurs at bottoms
One Bar Reversal Pattern graph
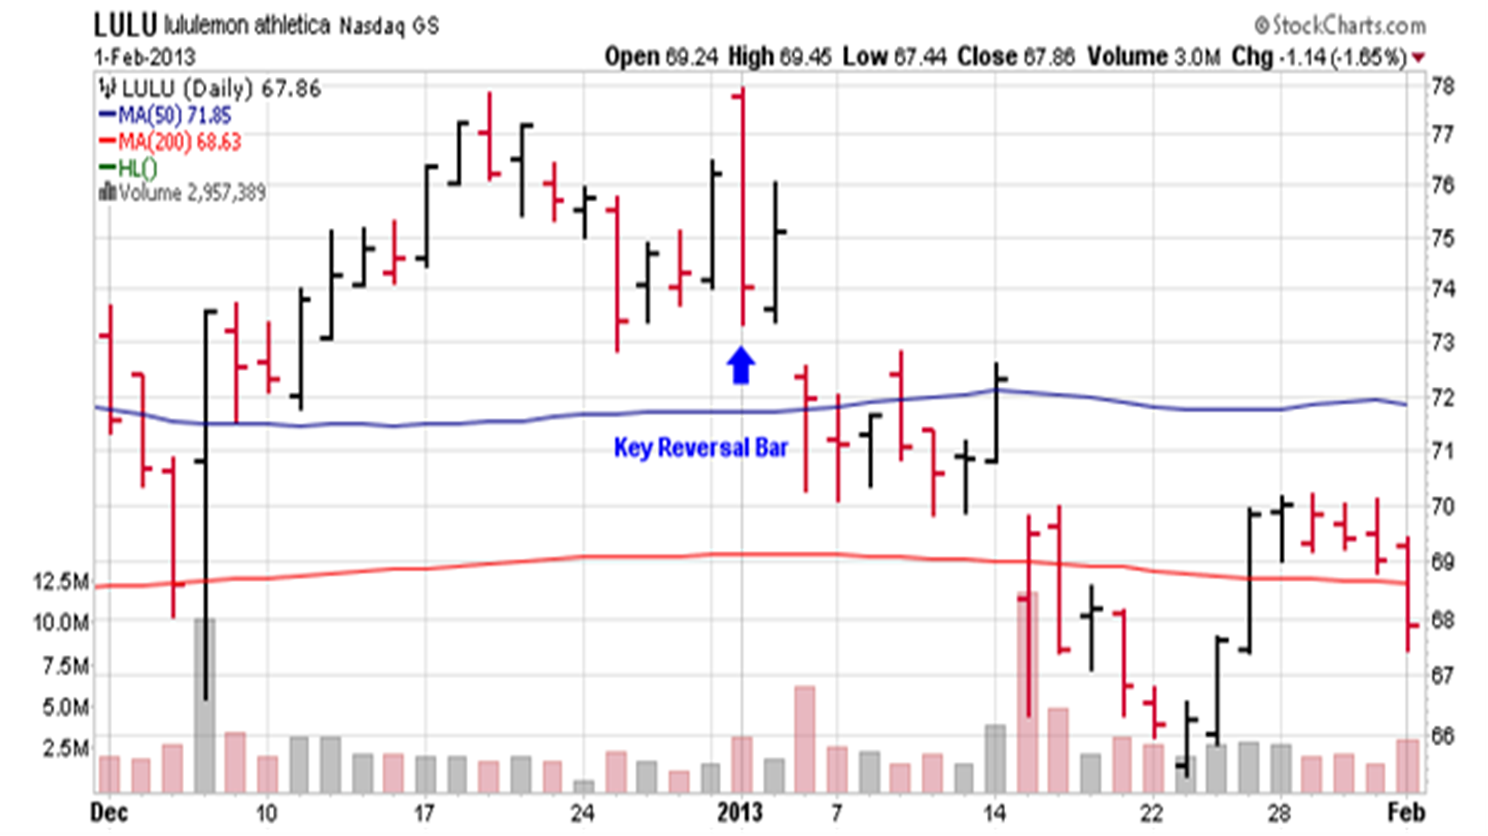
Key Reversal Day
One day chart pattern where prices sharply reverse during a trend
The wider the price ranges on the day and the heavier the volume, the greater the odds that a reversal is taking place
Key Reversal Bar
Two Bar Reversal Pattern
Classic signal of trend exhaustion
First bar should exhibit a dramatic continuation of the inbound trend, closing close to the bar’s extreme end
Second bar completely negates the first bar, with the open price on the second bar bring close to the close of the first bar and the close of the second bar being close to the open of the first bar
Two Bar Reversal Pattern Graph
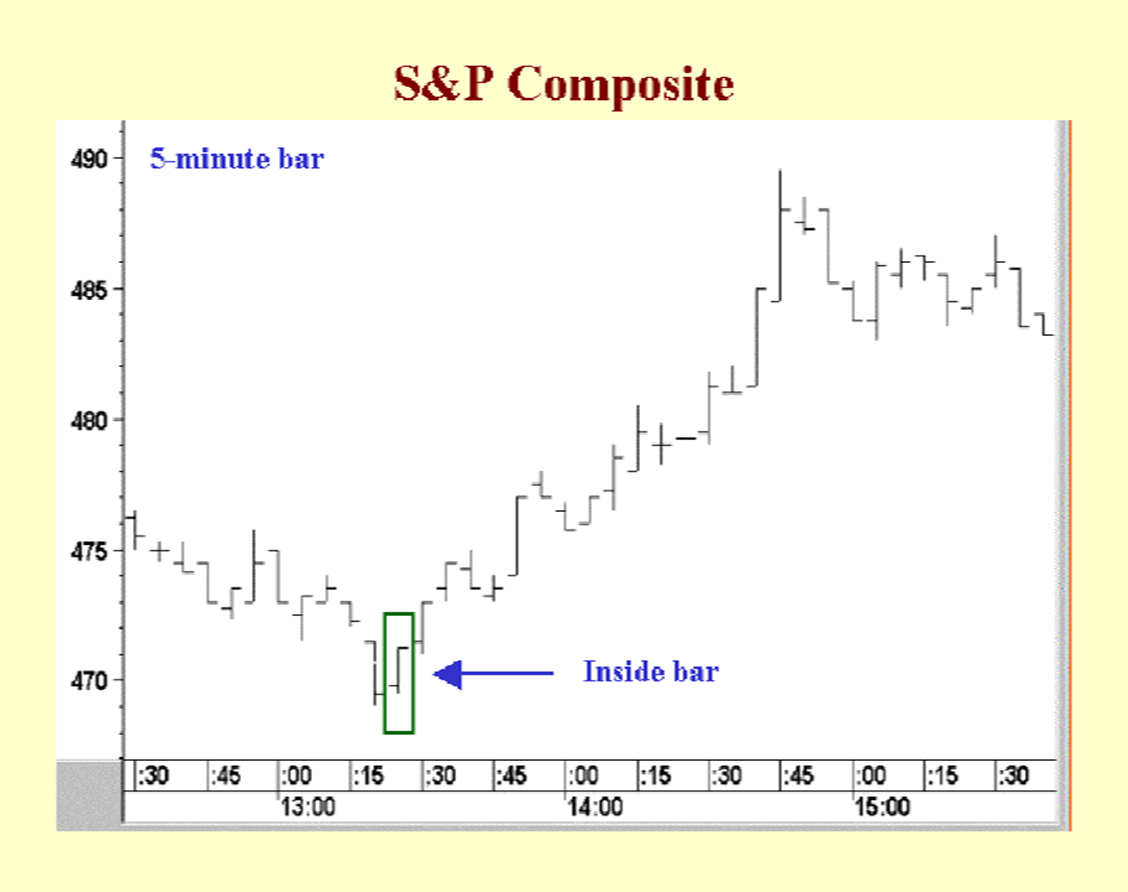
Inside Bar
Bar with a range that is smaller than and within the previous bar’s range
Reflects a momemtum in the trend - a pause, a period of directionless equilibrium, waiting for something to happen that will signal the next trend direction
Context of the pattern’s location of more important than the pattern configuation
Inside Bar Graph
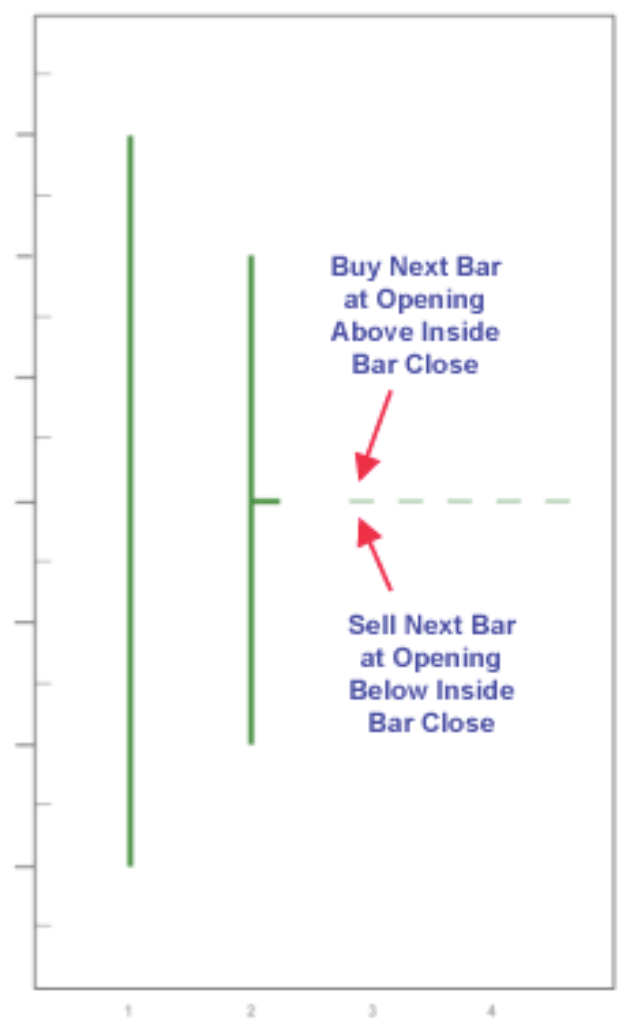
Inside Bar Indicators
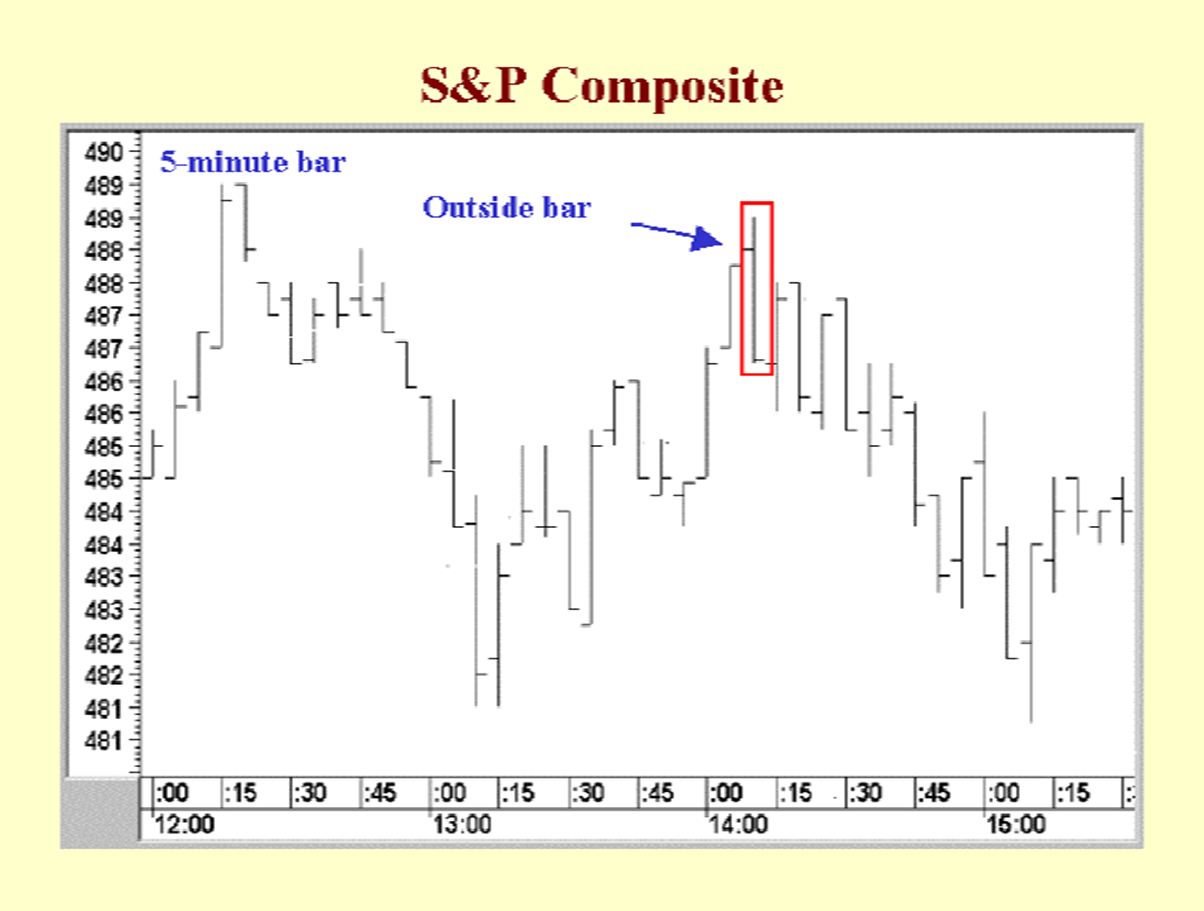
Outside Bar
Occurs when the high is higher than the high of the previous bar and the low is lower than the low of the previous bar
Outside Bar Graph
Bullish Outside Bars
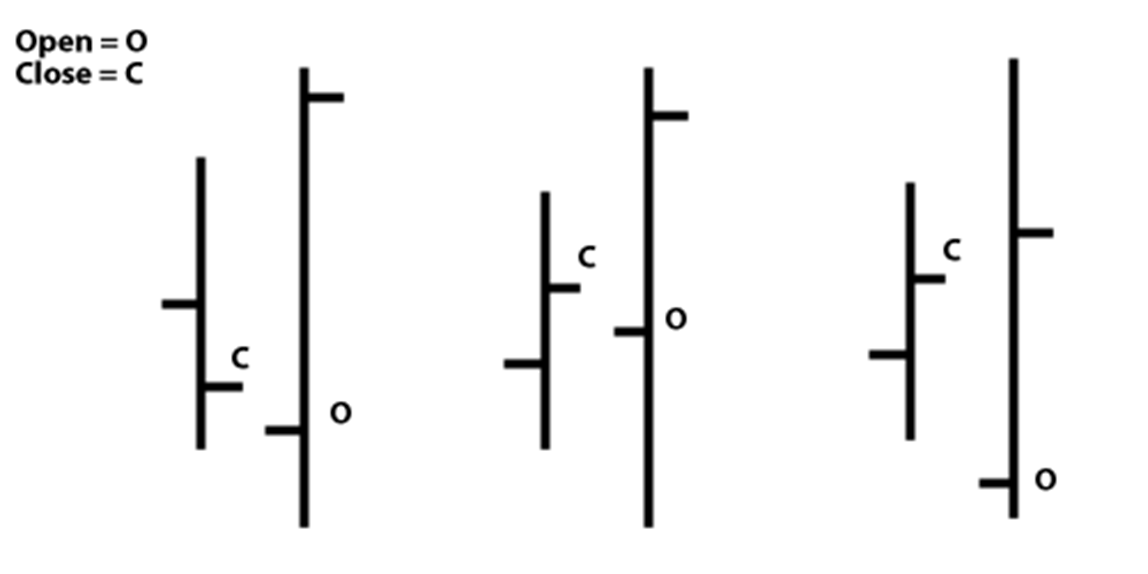
Bearish Outside Bars
1 Bar Candlestick Formations
Doji
Dragonfly Doji
Gravestone Doji
Spinning top
Hammer
Hanging Man
Shooting Star
Inverted Hammer
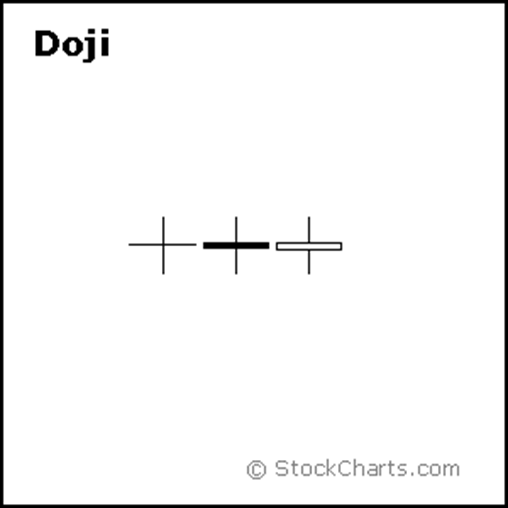
Doji
Pattern formed when open and close are identical, or nearly identical
Suggests market is in equilibrium and affefted by indecision
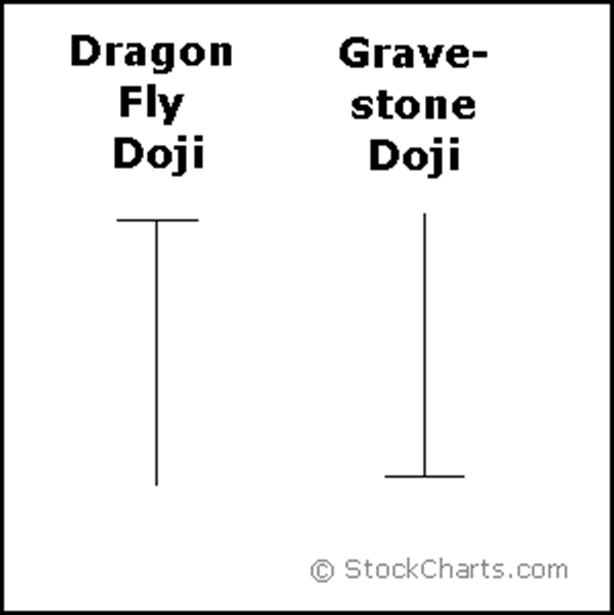
Dragonfly Doji
Doji where by the open and close are at the top of the period’s range
BULLISH CANDLE
Gravestone Doji
Doji where by the open and close are at the bottom of the period’s range
BEARISH CANDLE
Normal Doji Graph
Dragonfly and Gravestone Doji
Spinning Top
Candle with a long upper shadow, a long lower shadow and small real body
Represents indecision
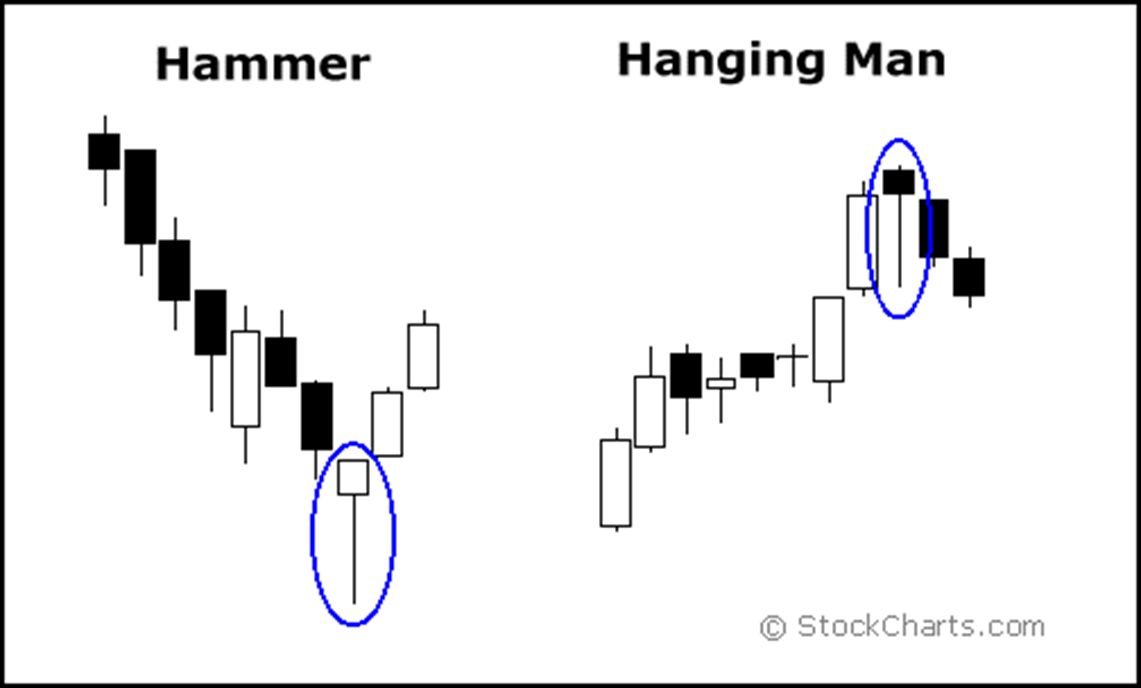
Both the Hammer and Hanging man are candlesticks in which:
The real body is located at the upper end of the trading range with the open and closes in the top 1/3 of the bar’s trading range
Hammer
Bullish reversal pattern that comes after a downtrend
Lower shadow must be at least 2 times longer than the real body
Hanging Man
Bearish reversal pattern that must come after an extended rally
Hammer and Hanging Man graph (refer to body)
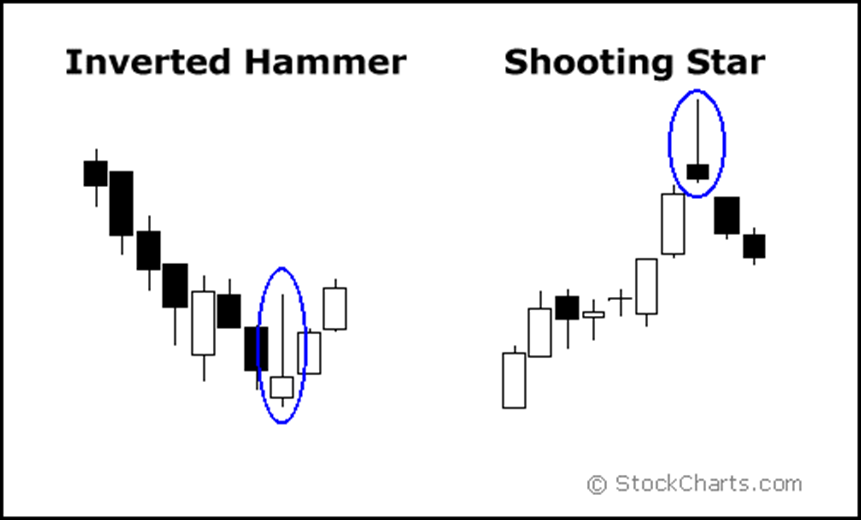
Shooting Star (upside down hanging man)
Bearish Reversal pattern that comes after a rally
Inverted Hammer
Bullish reversal pattern that comes after a decline
Inverted Hammer and Shooting Star Graph
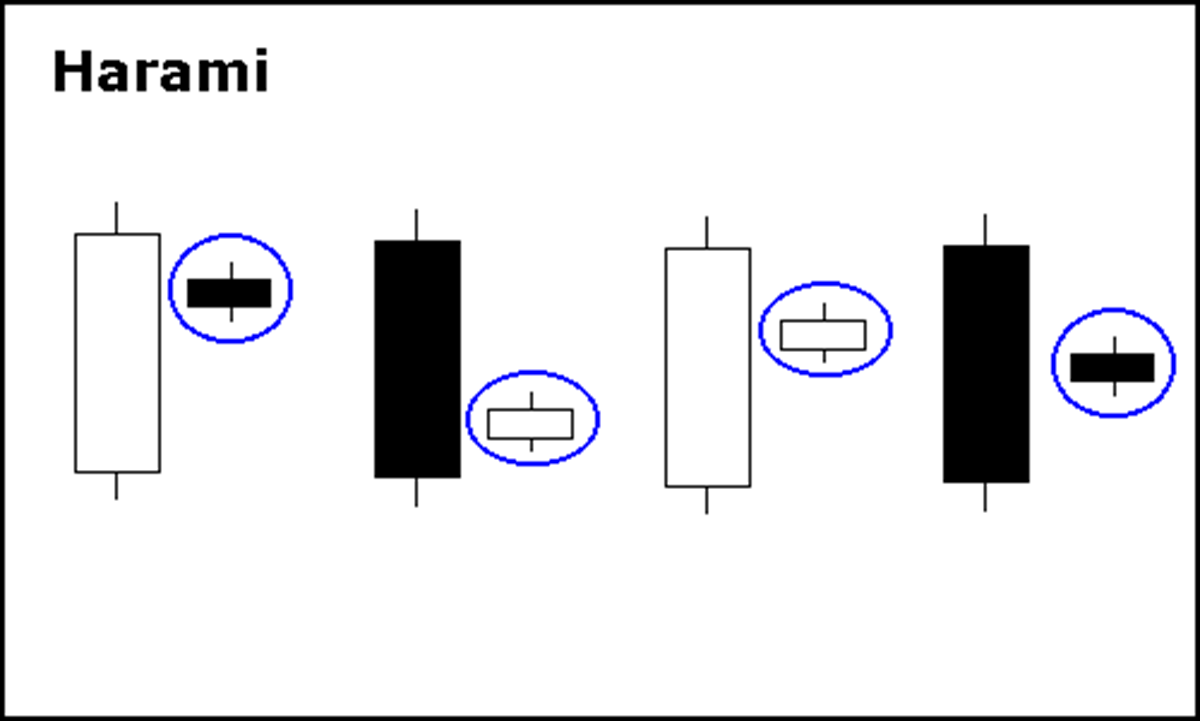
Harami
2 day pattern consisting of a large body of either color, followed by a small body of either color that is completely within the boundaries of the large body
Reversal patterns that represent price action indicesion that goes from high volatility to one of lower volatility
Harami Graph
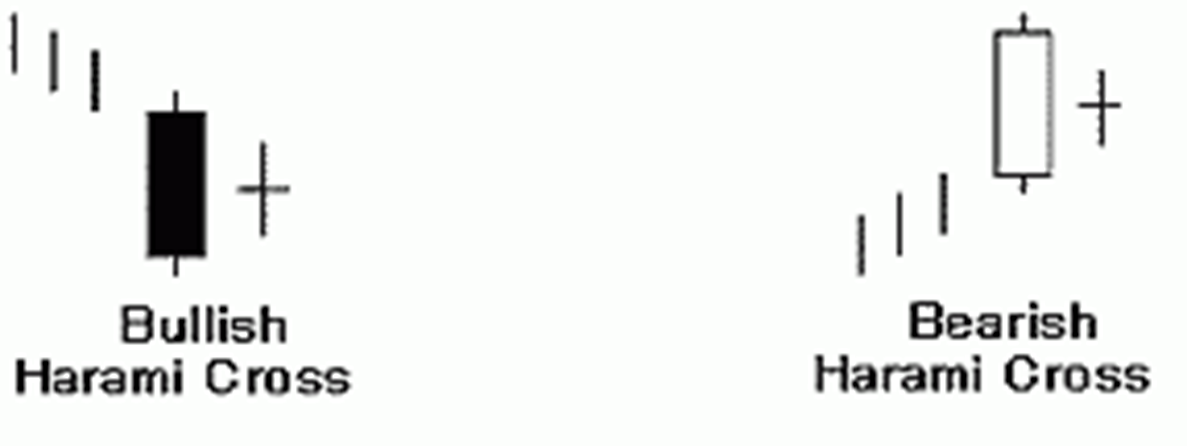
Harami Cross
Even stronger reversal signal as the second candle is replaced by a Doji
This implies a greater indicesion, and an even stronger signal of an impending end to prevailing trend
Harami Cross Graph
2 Bar Candlestick formations
Engulfing Patterns
Bullish Engulfing
Bearish Engulfing
Dark Cloud Cover
Piercing Pattern
Star Patterns
Morning Star
Evening Star
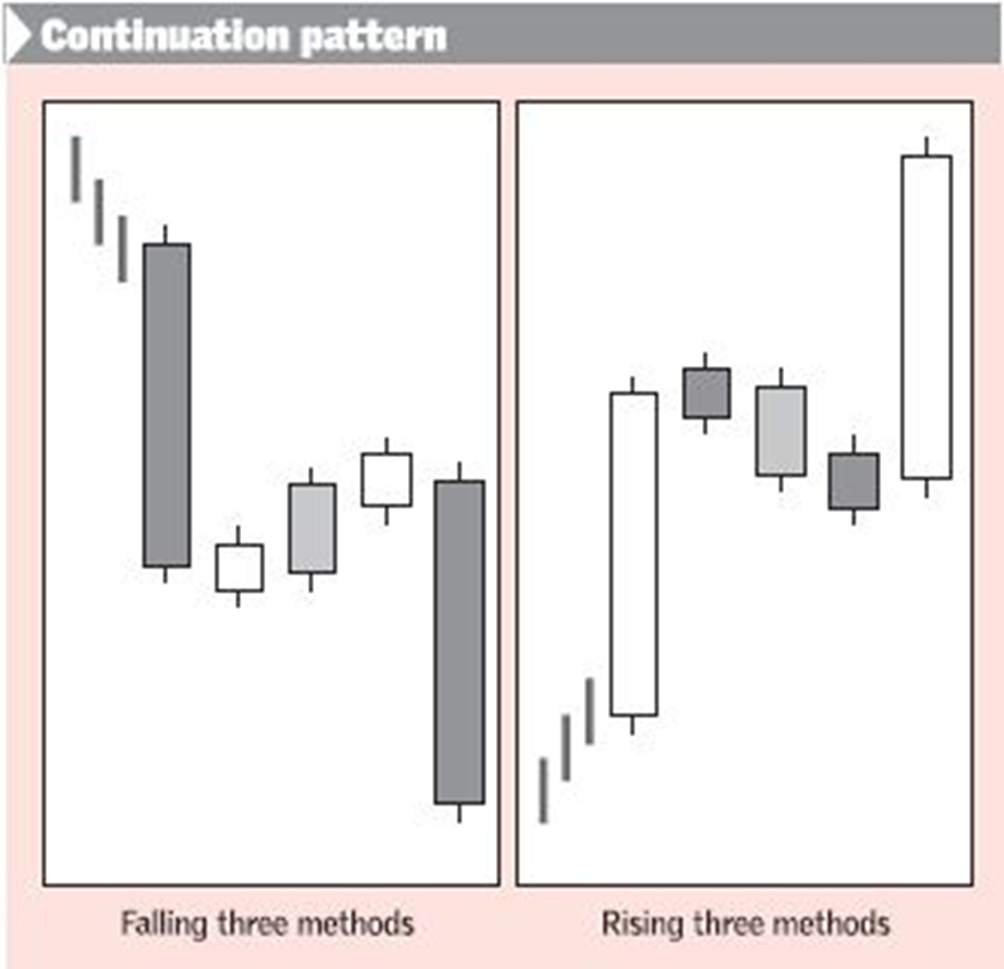
Continuation Patterns
Rising Three Method
Falling Three Method
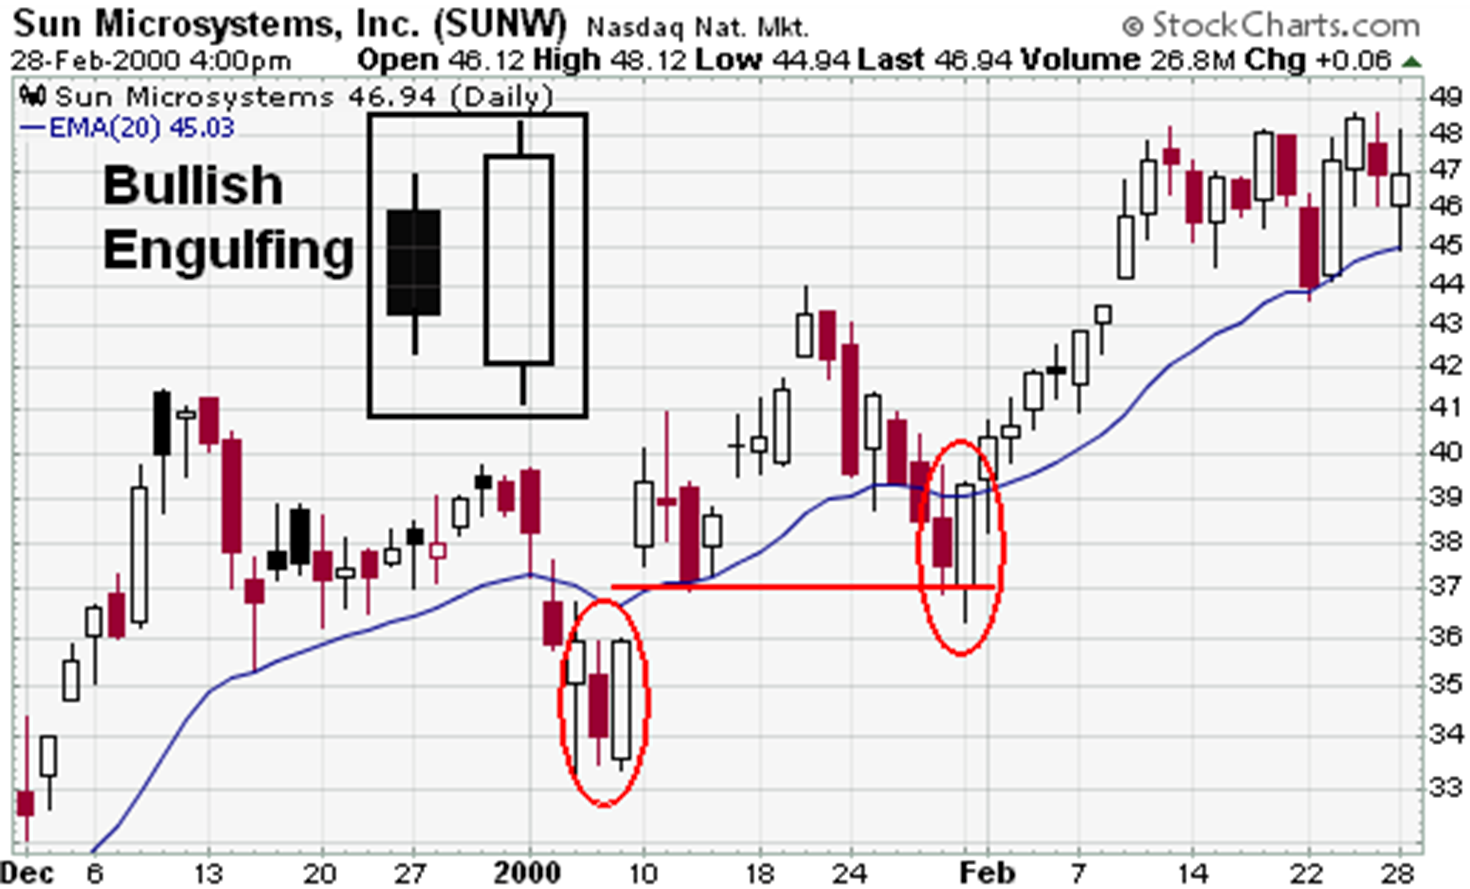
Bullish Engulfing
2 candle reversal pattern that comes at the end of a clearly defined downtrend
Body is made up of a large white candle that completely engulfs the real body of a smaller black candle found at the bottom of a downtrend
Bullish Engulfing Graph
Bearish Engulfing
Occurs at the end of a clearly defined uptrend, and is made up of a large black candle that completely engulfs a previous smaller white candle
Dark Cloud Cover
2 candle bearish reversal pattern
Large white candle followed by a large dark candle
Second dark candle should open above the previous day’s close and it should close at least halfway into the real body of a previous white candle
Dark Cloud Cover Graph

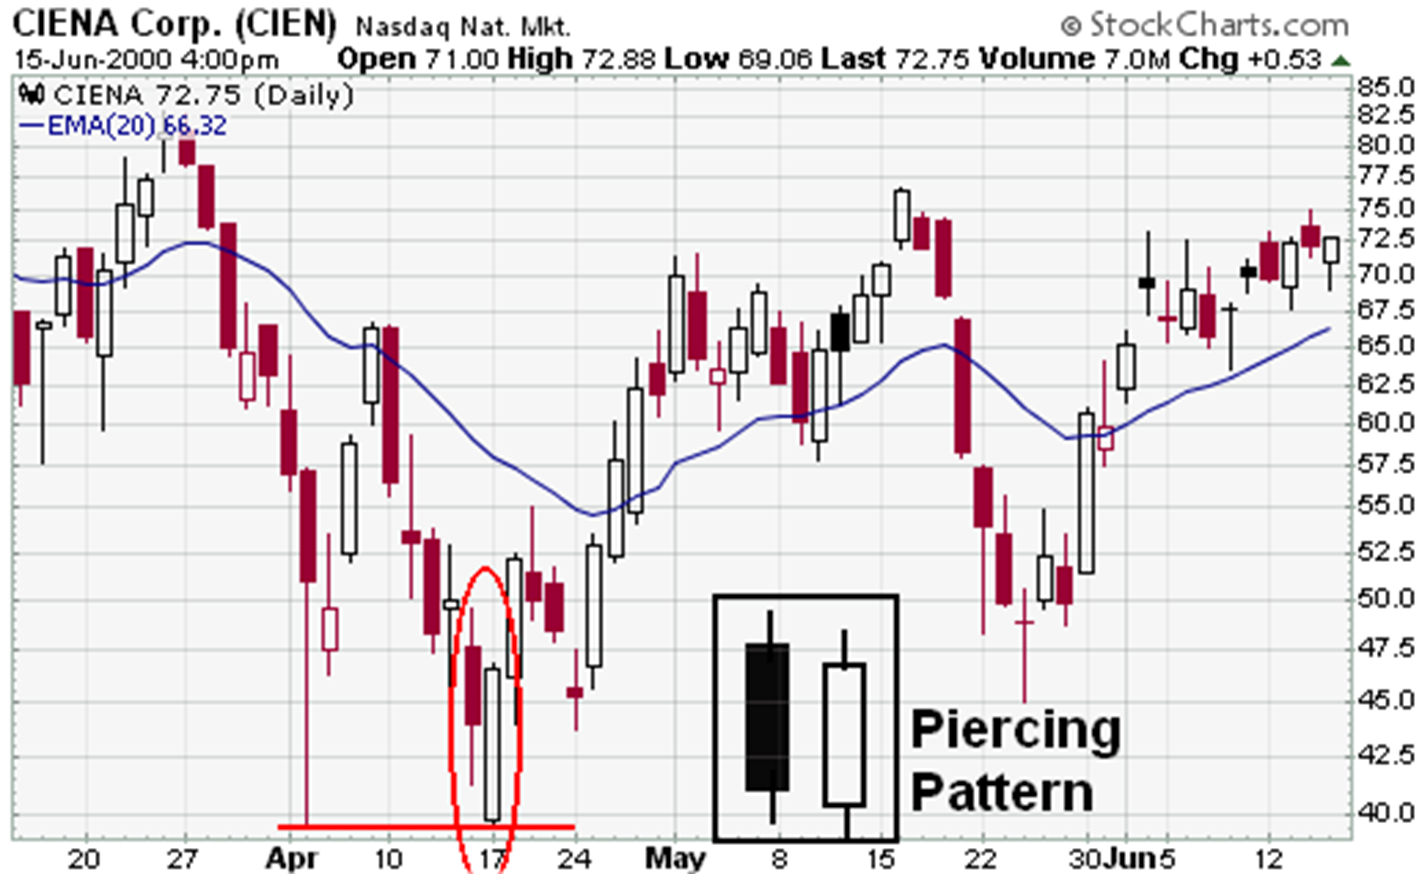
Piercing Pattern
Opposite of Dark Cloud
2 day bullish reversal pattern that occurs at the bottom of a clearly defined downtrend and is made up of alarge candlestick followed by a large white candlestick
White candlestick must open below the previous candlestick’s close and close at least halfway into the dakr candlestick’s real body
Piercing Pattern graph
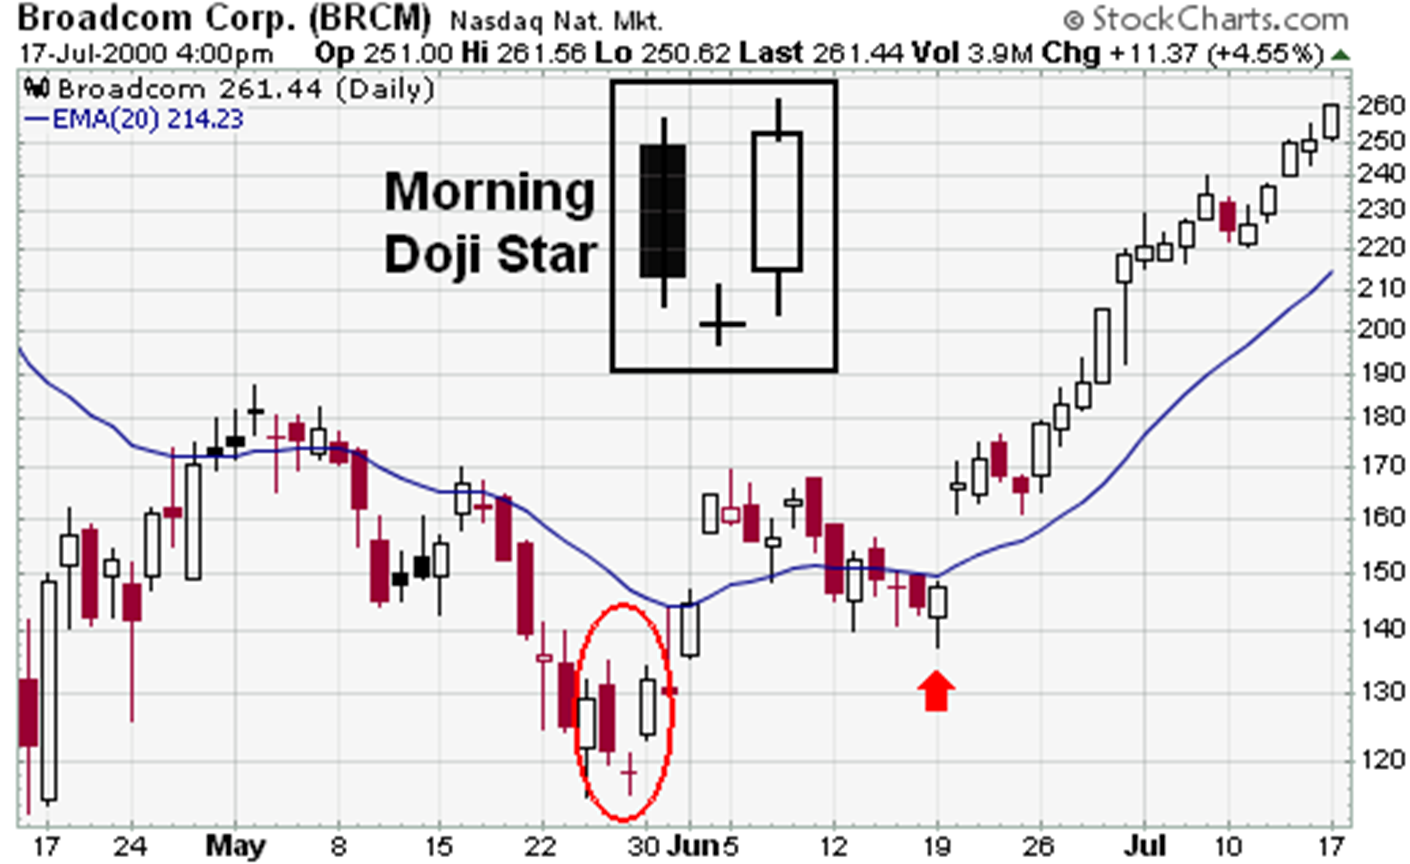
Morning Star
3 candle bullish reversal pattern that occurs at the end of a downtrend (market bottom)
Long black candlestick, small star candlestick, then white candlestick that gaps below the close of rpevious candlestick
Morning Star graph
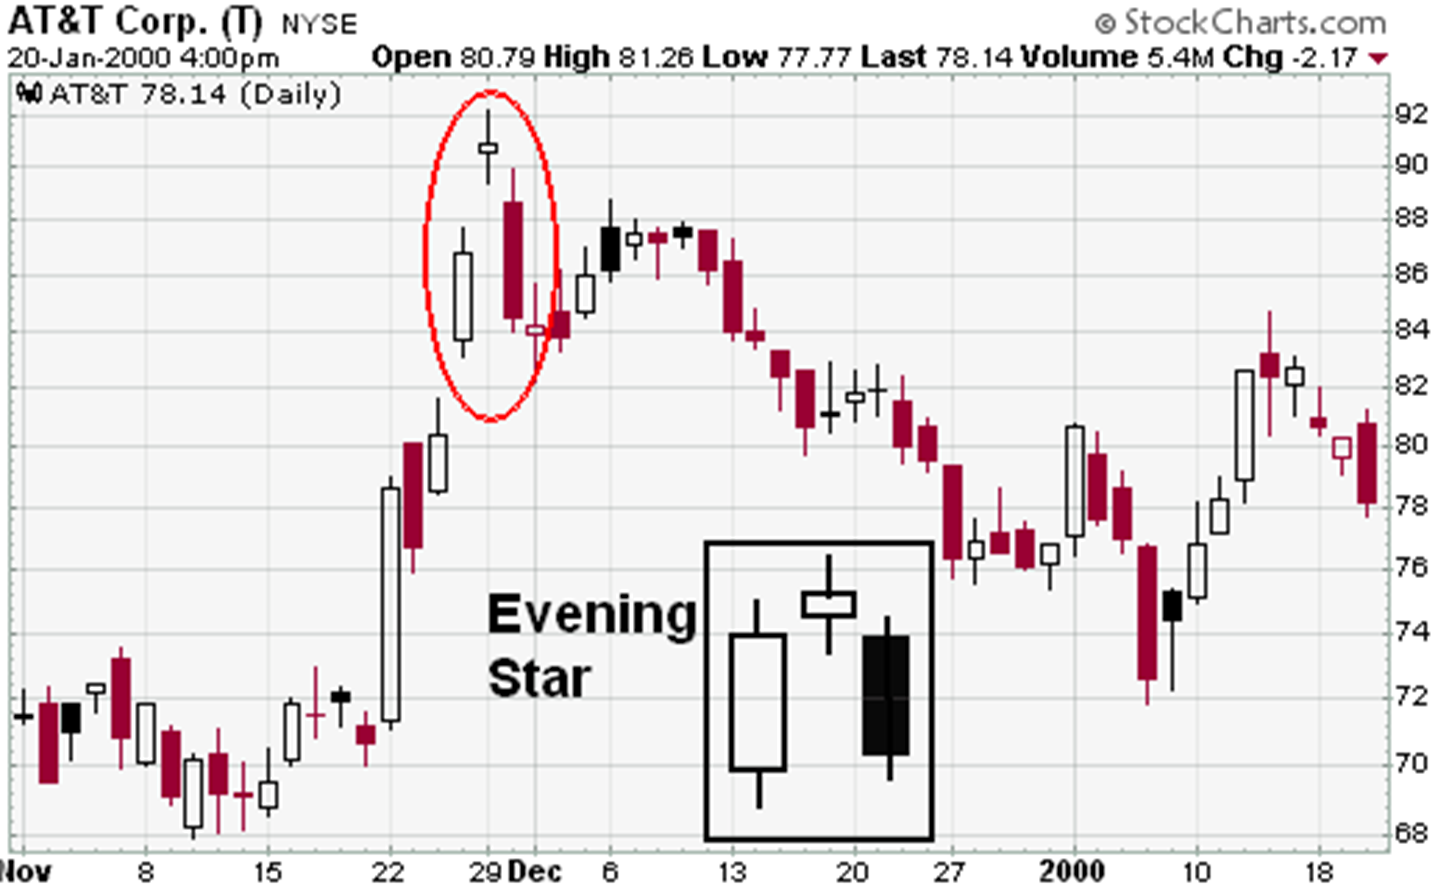
Evening Star pattern
3 candle bearish reversal pattern that occurs at the end of an uptrend
Evening Star graph
Rising Three Method
Bullish continuation pattern which:
Long white body is followed by 3 small body days, each contained within the range of the high and low of the first day
Falling Three Method
Bearish continuation pattern in which
A long black body is followed by three small body days, each contained within the range of the high and low of the first day
Continuation Patterns