Chapter 8: Forecasting

0.0(0)
studied byStudied by 0 people
learnLearn
examPractice Test
spaced repetitionSpaced Repetition
heart puzzleMatch
flashcardsFlashcards
Card Sorting

1/13

encourage image

There's no tags or description

Looks like no tags are added yet.

Study Analytics
Name
Mastery
Learn
Test
Matching
Spaced

No study sessions yet.

14 Terms

1
New cards

What is the purpose of forecasting?

knowt flashcard image
2
New cards

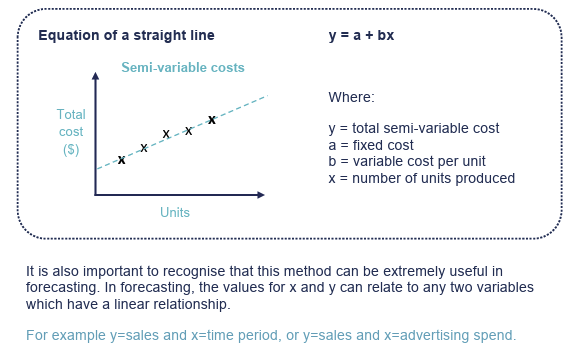
What is the equation of a straight line in when breaking down semi-variable costs and what do the variables stand for. What does the graph look like? Is this useful for forecasting?

knowt flashcard image
3
New cards

The accuracy of forecasting is affected by the need to adjust historical data and future forecasts to allow for price or cost inflation.

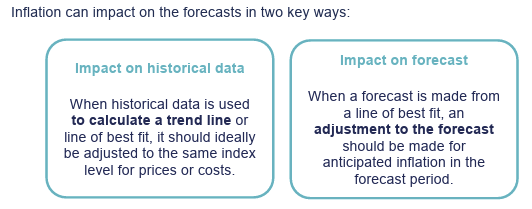
What are the two key areas inflation has an impact on forecasts?

knowt flashcard image
4
New cards

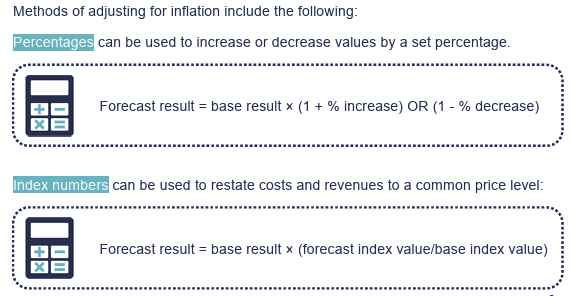
What are the two methods of adjusting inflation:

  • Percentages

  • Index numbers

knowt flashcard image
5
New cards

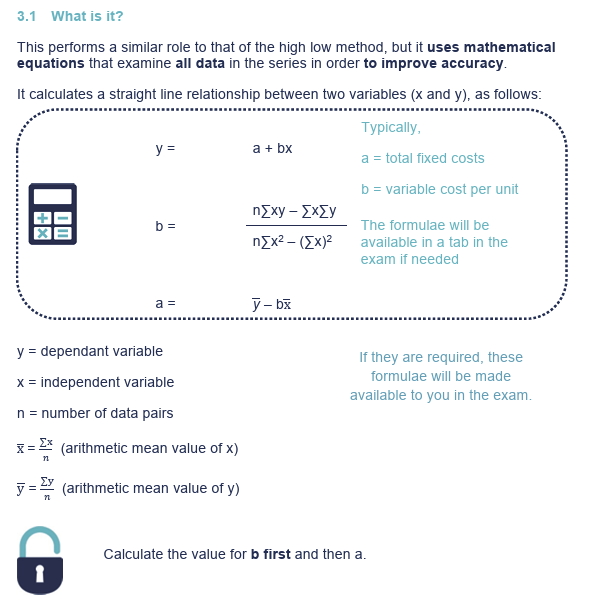
What is linear regression? What is the key rule that always applies?

knowt flashcard image
6
New cards

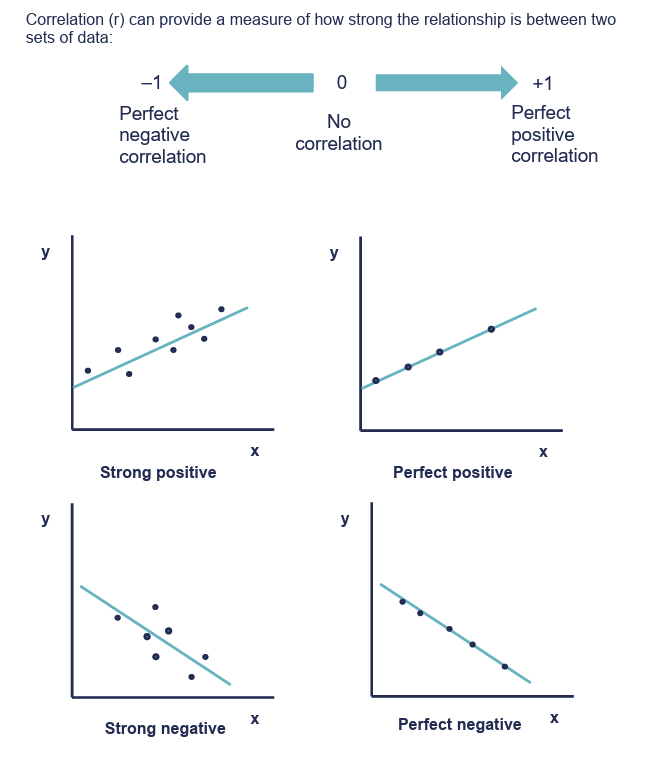
What does correlation provide a measure of?

What would the numbers -1,0 and 1 show?

knowt flashcard image
7
New cards

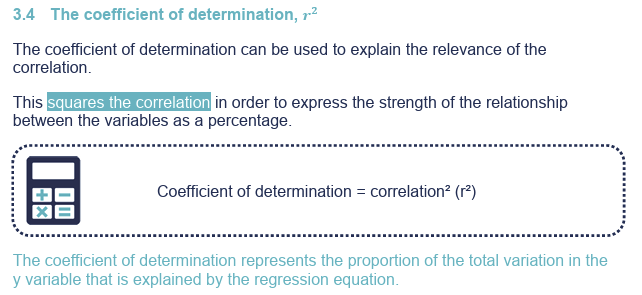
What does the coefficient of determination show and how is it calculated?

knowt flashcard image
8
New cards

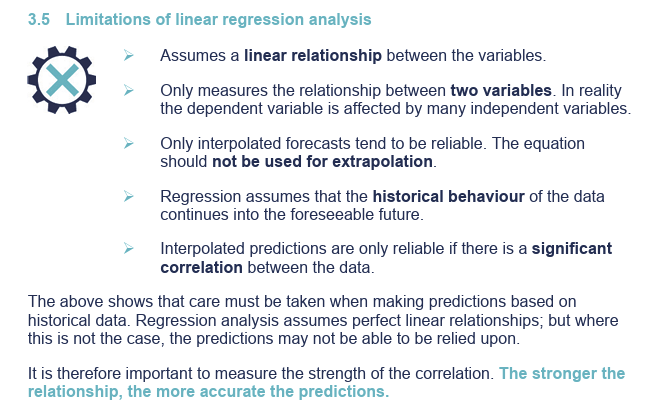
What are some limitations of linear regression analysis?

“Only interpolated forecasts tend to be reliable” - 📊 Example

Suppose you use linear regression to model the relationship between study hours and exam score, based on data from students who studied 0 to 10 hours:

Hours Studied

Exam Score

0

50

2

60

5

75

8

85

10

90

Let’s say the regression line is:

Score=50+4×Hours\text{Score} = 50 + 4 \times \text{Hours}Score=50+4×Hours


Interpolation

If you predict the score for someone who studied 7 hours, you're interpolating:

Score=50+4×7=78\text{Score} = 50 + 4 \times 7 = 78Score=50+4×7=78

This is reasonable, since it's within the data range (0 to 10 hours).


Extrapolation

If you use the same model to predict the score for 20 hours of study:

Score=50+4×20=130\text{Score} = 50 + 4 \times 20 = 130Score=50+4×20=130

But an exam score can't go beyond 100%, so this prediction is unrealistic. The model assumes the same trend continues forever, which is not valid outside the original data range.

<p>“Only interpolated forecasts tend to be reliable” - <span data-name="bar_chart" data-type="emoji">📊</span> Example </p><p>Suppose you use linear regression to model the relationship between <strong>study hours</strong> and <strong>exam score</strong>, based on data from students who studied <strong>0 to 10 hours</strong>:</p><p> </p><table style="min-width: 50px"><colgroup><col style="min-width: 25px"><col style="min-width: 25px"></colgroup><tbody><tr><th colspan="1" rowspan="1"><p>Hours Studied</p></th><th colspan="1" rowspan="1"><p>Exam Score</p></th></tr><tr><td colspan="1" rowspan="1"><p>0</p></td><td colspan="1" rowspan="1"><p>50</p></td></tr><tr><td colspan="1" rowspan="1"><p>2</p></td><td colspan="1" rowspan="1"><p>60</p></td></tr><tr><td colspan="1" rowspan="1"><p>5</p></td><td colspan="1" rowspan="1"><p>75</p></td></tr><tr><td colspan="1" rowspan="1"><p>8</p></td><td colspan="1" rowspan="1"><p>85</p></td></tr><tr><td colspan="1" rowspan="1"><p>10</p></td><td colspan="1" rowspan="1"><p>90</p></td></tr></tbody></table><p> </p><p>Let’s say the regression line is:</p><p> Score=50+4×Hours\text{Score} = 50 + 4 \times \text{Hours}Score=50+4×Hours </p><div data-type="horizontalRule"><hr></div><p> <span data-name="check_mark_button" data-type="emoji">✅</span> Interpolation </p><p>If you predict the score for someone who studied <strong>7 hours</strong>, you're interpolating:</p><p> Score=50+4×7=78\text{Score} = 50 + 4 \times 7 = 78Score=50+4×7=78 </p><p>This is <strong>reasonable</strong>, since it's within the data range (0 to 10 hours).</p><p> </p><div data-type="horizontalRule"><hr></div><p> <span data-name="cross_mark" data-type="emoji">❌</span> Extrapolation </p><p>If you use the same model to predict the score for <strong>20 hours</strong> of study:</p><p> Score=50+4×20=130\text{Score} = 50 + 4 \times 20 = 130Score=50+4×20=130 </p><p>But an exam score can't go beyond <strong>100%</strong>, so this prediction is <strong>unrealistic</strong>. The model assumes the same trend continues forever, which is <strong>not valid outside the original data range</strong>.</p>
9
New cards

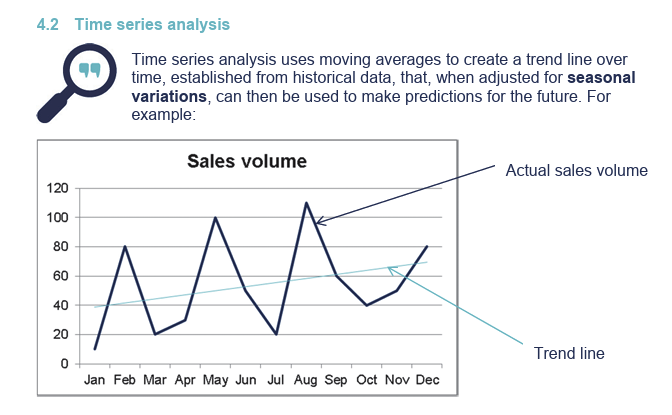
What is time series analysis?

knowt flashcard image
10
New cards

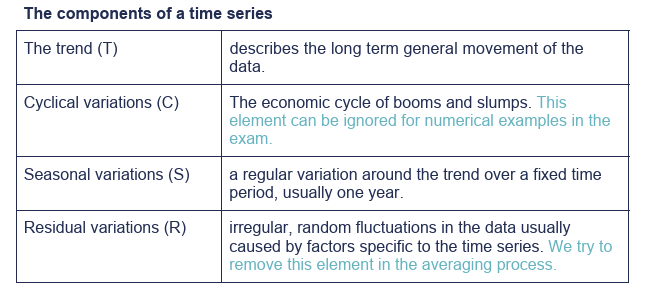
Explain the components of a time series:

  • The trend

  • Cyclical variations

  • Seasonal variations

  • Residual variations

knowt flashcard image
11
New cards

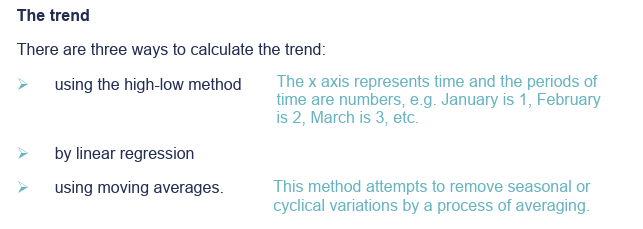
What are the 3 ways of calculating the trend? Explain what the last method attempts to do.

knowt flashcard image
12
New cards

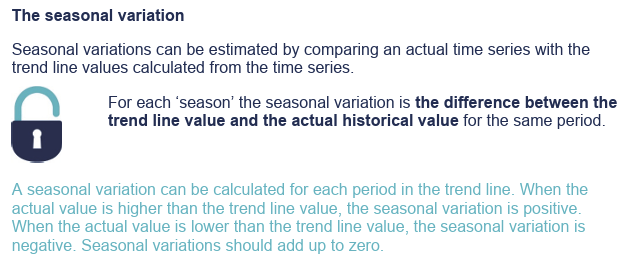
How are seasonal variations estimated? What happens when the actual value is higher/lower than the trend line value? What should seasonal variations add up to?

knowt flashcard image
13
New cards

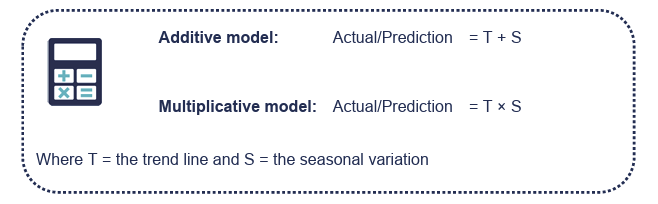
How are time series used to forecast prepared under the additive model and the multiplicative model?

knowt flashcard image
14
New cards

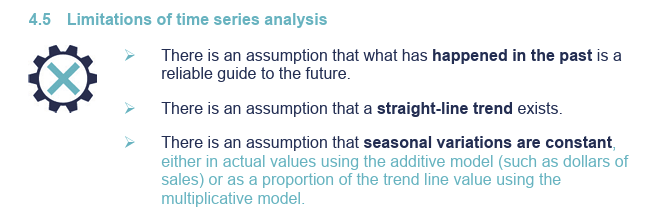
What are some of the limitations of time series analysis?

knowt flashcard image