Review-Ch 11 statistics
1/22
Earn XP
Description and Tags
Inference for regression
Name | Mastery | Learn | Test | Matching | Spaced | Call with Kai | Chat |
|---|
No analytics yet
Send a link to your students to track their progress
23 Terms
T statistic (for regression line)
tests whether the slope of the true regression line is 0
if rejecting that the slope of the true regression line is 0 → regression line will be useful in PREDICTING y given x
if not rejecting → plausible that the positive/negative trend seen is solely due to CHANCE variation that ALWAYS results when you have ONLY 1 sample
Confidence Interval(regression line)
helps to DECIDE whether the linear relationship is statistically significant & practical significance
___the average increase/decrease in___population
If claim is not in the interval →not supported claim
If Confidence interval has…
All positive values → evidence for positive association
All negative values → evidence for negative association
BOTH positive and negative values → no evidence for an association
B1
the slope of the true regression line
Bo
the y intercept
BIO
Hypothesised slope
b1
slope(estimate from a sample)
df(regression line)
n-2, because a sampling distribution is a t-distribution
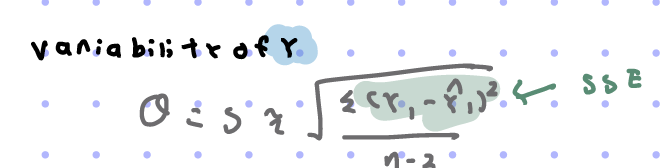
S: Standard error(regression)
spread around the regression line
the difference BETWEEN predicted(estimates) and the actual scores are measured with this residual standard deviation
SSE
Sum of squared errors
Slope(Interpretation)
for every 1 increase/decrease in x, there is a predicted increase/decrease in y
The slope(* correlation sign is same as slope sign) of a regression line is in the middle of the Confidence Interval
r
Correlation coefficient, can be from -1 to 1
r²
coefficient of determination
“__% of the variation in y can be attributed/accounted for by the variation in x
Significance Test(Regression line)
CONDITIONS
approximately normal distribution of y for a fixed value of x…
The means lie on a line
Standard deviation is CONSTANT across ALL x values
ONE of below
SRS from a bivariate(2) population
OR
independent random sample with ( x,y ) values given
roughly linear scatterplot
Residual plot has no pattern/curvature
Residual distribution looks approximately normal or uniform(on x axis ALONE)
STEPS
name test: t-test for the slope of a population regression line
1) Conditions
2)Hypothesis
let B represent the slope of ___between x and y
Ho: B=0
HA: B≠,<,> 0.
3) Test stat, p-value
t=(b1-BIO)/sb1
4)COnclusion
smaller p value→STRONGER evidence against the null hypothesis bc farther from α → “sufficient evidence”
Confidence Interval(Regression Line)
CONDITIONS
approximately normal distribution of y for a fixed value of x…
The means lie on a line
Standard deviation is CONSTANT across ALL x values
ONE of below
SRS from a bivariate(2) population
OR
independent random sample with ( x,y ) values given
roughly linear scatterplot
Residual plot has no pattern/curvature
Residual distribution looks approximately normal or uniform(on x axis ALONE)
STEPS
1) Conditions
2) Computations
CI=b1+- t* sb1
df= n-2
t*=invt(% thingy, df)
3) Interpret in Context
“We are __% sure that the true slope of the line of regression between x var and y var lies BETWEEN the interval ( , )”
“Out of 100 such Confidence Interval, when constructed from random samples. The expected true value B1 to be #(as a number) of them”
line of mean/averages
uy=bo+ b1x
Variability
size of on depends on…
Sample Size(n)
Variability in y
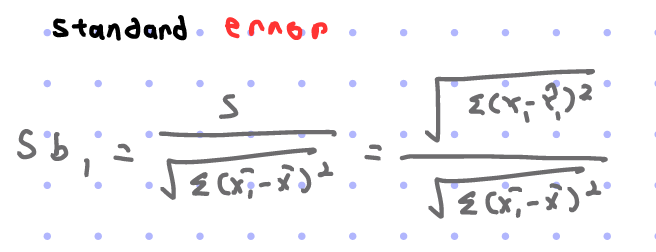
Standard error
The slope varies less when…
Sample size larger
values of y tend closer to the regression line
values of x more spread out
Power transformation
y=axb
the base is what changes
(log x, log y)
Exponential model
y=aby
the exponent is what changes
( x, log y)
Ln transformations
(ln x, ln y)
the LSRL is ln(y var)=a+b(ln(y var)
which also EQUALS y var=ea+xb
“Cubic or more” transformation
see if Confidence Interval capturers 3(n) or not
CI could potentially be too big/small
General conclusions
if the slope was actually BIO only a (p-value number) chance of getting a slope as far or FARTHER than b1 is from BIO for an SRS of units
if a transformation is made→include it in the LSLR equation & conclusion
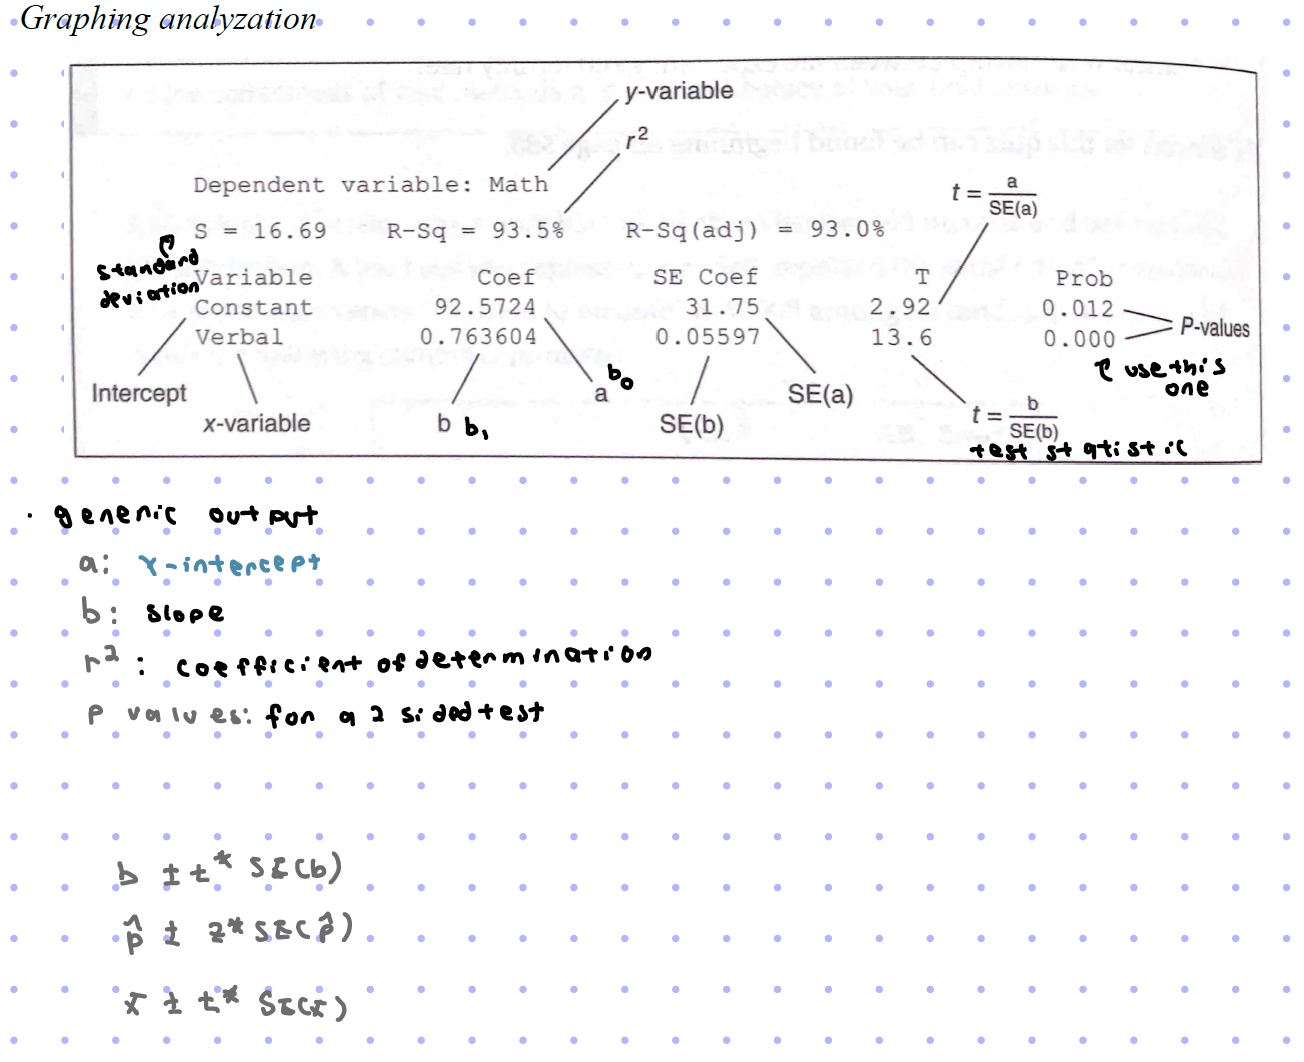
Graphing Analyzation
Scatterplot
If there are gaps/empty space in the middle suggest 2 clusters→ If analyzed separately could result in other answers
Graphing calculator
if HA is 1 sided→p value on calculator graph /2
S=standard deviation
constant(intercept) coef= bo
x variable coef =b1$