Exam 2 USE
 Call Kai
 Learn
Learn Practice Test
 Spaced Repetition
 Match
Match Flashcards
 Knowt Play
1/216

There's no tags or description
Looks like no tags are added yet.
Name | Mastery | Learn | Test | Matching | Spaced | Call with Kai | Chat |
|---|
No analytics yet
Send a link to your students to track their progress
217 Terms
what is an electrocardiogram (ECG/EKG)
records the electrical activity of the heart.
ECG does not
directly measure contraction, instead it measures the electrical impulses that cause the heart to contract
electrical conduction pathway
SA node→ Inernodal pathways→ AV node→ bundle of his→ right and left bundle branchecs→ purkinje fibers→ ventricular muscle
explain the electrical conduction pathway of the heart
electrical activity begins in the SA node, the natural pacemaker of the heart. The impulse spreads across both atria, causing depolarization. The signal then reaches the AV node, where it is briefly delayed to allow the ventricles time to fill. Next, the impulse travels through the bundle of His, into the right and left bundle of branches, and finally through the Purkinje fibers, causing ventricular depolarization and concentration
SA node location and function
upper right atrium near the superior vena cava. natural pacemaker
SA node normally fires between
60-100 b/min
AV node location and purpose
lower right atrium. Delays the electrical impulse
why does the AV node delay the electrical impulse?
To allow the atria to finish contracting before the ventricles begin
SA vs AV
SA= Starts the heartbeat
AV= Allows ventricles to fill
Bundle of His
carries electricity from the AV node into the inter ventricular septum.
Bundle Branches
carry electricity down each side of the septum
purkinje fibers
spread electricity rapidly throughout both ventricles resulting in rapid, coordinated ventricular contraction
P wave
atrial depolarization, causing atrial contraction
QRS complex
ventricular depolarization, causes ventricular contraction
what else happens in the QRS complex
atrial repolarization but is hidden because the QRS complex is larger
T wave
ventricular repolarization. the ventricles relax and prepare for the next beat
why isnt atrial repolarization seen on the ECG.
atrial repolarization occurs at the same time as ventricular depolarization. Because the ventricles generate a much larger electrical signal, the small atrial repolarization wave is hidden within the QRS complex.
depolarization
the cardiac cells becomes electrically activated leading to contraction
repolarization
the cardiac cells return to its resting electrical state leading to relaxation
depolarization= contract
repolarization= relax
PR interval
measured from the beginning of P wave to the beginning of the QRS represents.
PR interval represents
time required for electrical conduction from the atria to the ventricles. (includes AV delay)
QRS duration represents
time needed for ventricular depolarization. normally very short
QT interval represents
total time for ventricular depolarization and repolarization
why is the AV node delay important
the AV node delays electrical conduction so the atria can completely empty blood into the ventricles before ventricular contraction begins. Without this delay, ventricular filling would be reduced, decreasing stroke volume
electrical events always comes before mechanical events (exampls)
electrical signal→ muscle contraction. p wave→ atrial contraction. QRS→ ventricular contraction. T wave→ ventricular relaxation
HR from ECG
300 / number of large boxes between R wave
HR example from ecg
1 box = 300bpm. 2 boxes = 150 bpm. 3 boxes = 100bpm. 4 boxes 75 bpm. 5 boxes = 60 bpm
why is the QRS complex larger than the p wave
the ventricles contain much more muscle mass than the atria. becuase more cardiac muscle is depolarizing, the electrical signal is much larger, producing the larger QRS complex
common ECG sequence
SA node fires→ p wave→ atria contract→ AV delay→ QRS→ ventricles contract→ T wave→ ventricles relax
what does an ECG measure
the electrical activity of the heart
Does an ECG measure contraction?
No, it measures the electrical signal that causes contraction
what is the natural pacemaker
SA node
what does the p wave represent..
atrial depolarization..
What does the QRS complex represent..
ventricular depolarization..
what does the T wave represent..
ventricular repolarization..
what electrical event is hidden in the QRS complex..
Atrial repolarization..
why is the AV node important
It delays conduction to allow ventricular filling
what structure carries impulses rapidly through the ventricles
purkinje fibers
what does the PR interval represent
conduction time from the atria to ventricles
what does the QT interval represent
total ventricular depolarization and repolarization time
why is the QRS larger than the P wave
the ventricles have more muscle mass
what occurs immediately after ventricular depolarization
ventricular contraction
what is the electrical axis
overall direction that the electrical impulse travels through the ventricles during depolarization
Mean QRS axis
Overall average direction of ventricular depolarization.
vector has
direction and magnitude
why does the left ventricle dominate
thicker walls, more muscle, more electrical activity
the hexaxial reference system
divides the heart into angles
Lead I angle
0
Lead II angle
+60
Lead III angle
+90
The qudrant method steps
look at only 2 leads (Lead I and Lead aVF)
is lead I positive or negative
is lead aVF positive or negative
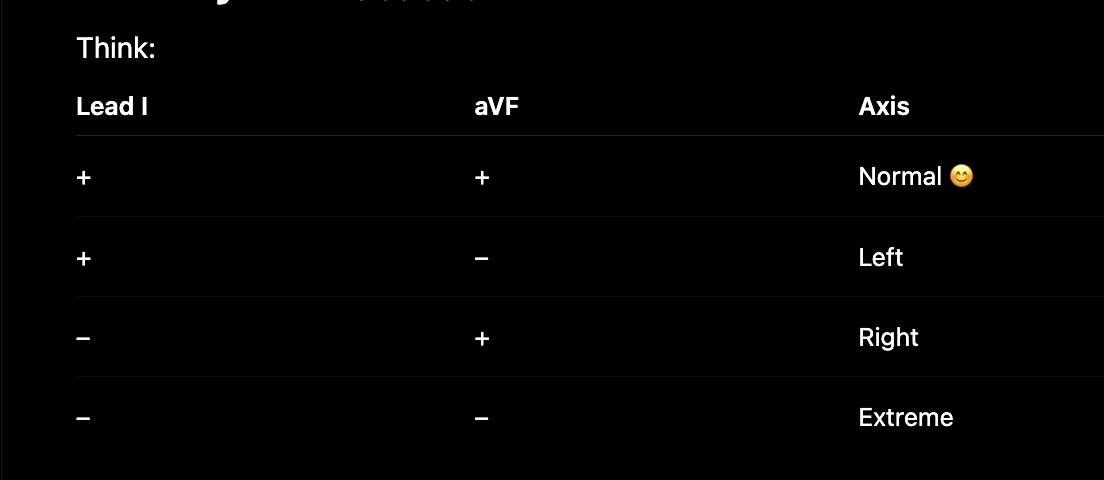
The qudrant method example
Lead I (positive) + Lead aVF (positive)= normal axis
Lead I (positive) + Lead aVF (negative)= left axis deviation
Lead I (negative) + Lead aVF (positive)= right axis deviation
Lead I (negative) + Lead aVF (negative)= Extreme NW axis
look
3 lead method (little more accurate)
uses Lead I, lead II, aVF Rule
Rule
Lead I Positive-> Check Lead II. If Lead II is Positive= Normal Axis
Lead I Positive-> Lead II Negative= Left Axis Deviation
Lead I Negative-> Look at aVF, Positive= Right Axis
Negative=Extreme Axis
Isoelectric lead method
Find the lead whose QRS is most equally positive and negative (the smallest net deflection).
That lead is called the isoelectric lead.
The Mean QRS Axis will be approximately 90° (perpendicular) to that lead.
Then use another lead (often Lead I) to determine which of the two possible directions is correct.
why is an isoelectric lead
the ecg lead in which the positive and negative portions of the QRS complex are nearly equal, resulting in a net amplitude close to zero. The mean QRS axis lies approx. 9- degrees from this lead
left axis deviation (LAD)
QRS axis Between -30 degrees and -90 degrees
common causes of LAD
left ventricular hypertrophy, left bundle branch block, left anterior fascicular, inferior myocardial infraction
Right Axis deviation (RAD)
QRS complex between + 90 degrees and +18- degrees
common causes of RAD
right ventricular hypertrophy, pulmonary hypertension, chronic lung disease
why does axis shift?
the electrical axis shifts toward the side of the heart producing the greatest electrical force.
why does left ventricular hypertrophy cause Left axis deviation
left ventricular hypertrophy increases the amount of muscle in the left ventricle. more muscle produces a larger electrical signal during ventricular depolarization. Because the left ventricle dominates the electrical activity, the mean QRS Axis shifts toward the left
what is the mean QRS axis
the average direction of ventricular depolarization
which chamber mainly determines the normal QRS axis
left ventricle
why does the left ventricle dominate the electrical axis
it has the greatest muscle mass
what two leads are used in the quadrant method
Lead I and aVF
Lead I positive, aVF positive
normal axis
Lead I positive, aVF negative
left axis deviation
Lead I negative, aVF positive
right axis deviation
Lead I negative, aVF negative
Extreme NW axis
what is an isoelectric lead?
the lead with nearly equal positive and negative QRS deflections
The mean QRS Axis is approx. how many degrees from the isoelectric lead
90
what causes left axis deviation
increases left sided electrical forces, such as left ventricular hypertrophy or left anterior fascicular block
what does Lead I measure
electrical activity along the 0 degree axis
what does lead II represent
+60 degrees
what angle does lead aVF represent
+90 degrees
why do vectors add together
because electrical activity occurring in similar directions combine into one larger resultant factor
cardiovascular disease progression
poor lifestyle/genetics→ high bp & cholesterol→ atherosclerosis develops→ coronary artery disease→ reduced blood flow→ angina→ complete blockage→ myocardial infraction→ heart failure
hypertension
chronically elevates arterial blood pressure. forces the heart to work harder to pump blood
why is hypertention called the “silent killer”
many people have no symptoms until significant damage has already occured
Risk factors of CVD non-modifiable
age, family history, genetics
Risk factors of CVD modifiable
obesity, smoking, high sodium diet, physical inactivity, diabetes, high cholesterol, stress
why is hypertension dangerous
high pressure damages the inner lining of arterioles→ inflammation develops→ plaque forms more easily→ atherosclerosis accelerates
why is hypertension dangerous detailed
hypertension causes chronic damage to the walls of blood vessels. This damage promotes inflammation and plaque formation, increasing the risk of coronary artery disease, heart attack, stroke, kidney disease, and heart failure. Becuase many people have no symptoms, hypertention is often called the silent killer
atherosclerosis
the buildup of fatty plaques inside arteries
plaques contain
cholesterol, lipids, calcium, inflammatory cells, fibrous tissue
what happens in atherosclerosis?
healthy artery→ damage to endothelium → LDL cholesterol enters vessel wall→ inflammation→ macrophages consume LDL→ foam cells develop→ Fatty streak→ plaque→ narrow artery→ reduced blood flow
explain how atherosclerosis develops
atherosclerosis begins with damage to the endothelial lining of an artery. LDL cholesterol enters the damaged area and becomes oxidized. White blood cells (macrophages) engulf the cholesterol and become foam cells, creating fatty streaks. Over time, smooth muscle cells and fibrous tissue accumulate, forming plaques that narrow the artery and reduce blood flow.
Coronary artery disease (CAD)
occurs when coronary arteries become narrowed by atherosclerosis. as a result, the heart muscle receives less oxygen
symptoms of COD
chest pain, shortness of breath, fatigue
Angina
chest pain caused by temporary myocardial ischemia (heart muscle is alive just not receiving enough oxygen
stable angina
occurs during exercise. Improves with rest. predictable
unstable angina
occurs unexpectedly. Can occur at rest. Medical emergency. often due to plaque rupture.
difference between stable and unstable angina
stable angina occurs when increased oxygen demand during exercise exceeds blood supply because of a narrowed coronary artery. Symptoms improve with rest. Unstable angina occurs when plaque rupture and clot formation suddenly reduce blood flow. symptoms may occur at rest and indicate a high risk for myocardial infraction
myocardial infraction (heart attack)
complete blockage of a coronary artery → no oxygen reaches part of the myocardial→ cardiac muscle dies
common cause of MI
plaque ruptuure→ blood clot→ complete obstruction
symptoms of MI
chest pain, left arm, jaw, shoulder, back pain, shortness of breath, sweating nausea
Explain what happens during a myocardial infarction.
A myocardial infarction usually occurs when an atherosclerotic plaque ruptures inside a coronary artery. A blood clot rapidly forms and blocks blood flow. Without oxygen, cardiac muscle cells begin to die. The longer blood flow is interrupted, the more permanent damage occurs.
ischemia
reduced blood flow, muscle is still alive, potentially reversible