A Level Bio RP's
1/8
There's no tags or description
Looks like no tags are added yet.
Name | Mastery | Learn | Test | Matching | Spaced |
|---|
No study sessions yet.
9 Terms
CP1 - Daphnia
Make up a range of solutions containing different concentrations of caffeine. Make sure to include a control containing no caffeine at all.
Using a pipette, extract a single Daphnia and transfer into the dimple on a cavity slide.
Place the slide onto the microscope stage and observe until you can clearly see the beating heart.
Using a different pipette, add one drop of the caffeine solution to the slide.
Count the number of heartbeats in 20 seconds using a stopwatch. Multiply the data by tree to calculate the number of heartbeats in one minute.
Repeat the experiment using the same concentration of caffeine. Ensure that you use a different Daphnia for each repeat.
Repeat the experiment using the other caffeine solutions of varying concentrations and the control solution.
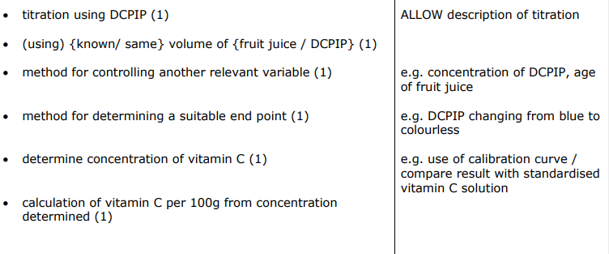
CP2 - Vitamin C
Create a 1 mg cm-3 vitamin C solution. Prepare serial dilutions of 0.5, 0.25, 0.125 and 0.0625 mgcm-3
Measure out a set volume of DCPIP using a measuring cylinder and pour into a test tube.
Dropwise, add vitamin C solution to the test tube and gently shake for 30 seconds. Keep adding drops of the vitamin solution and shaking until the blue colour disappears.
Record the number of drops added to cause the colour change.
Repeat twice more with each vitamin C concentration and calculate a mean.
Repeat with serial dilutions.
Draw a graph showing volume of vitamin C solution against concentration and connect data points with a curve of best fit. This is known as a calibration curve.
Now, test your unknown solution using the method above and use the calibration curve to determine its concentration.
Control variables: temperature, volume of DCPIP, time spent shaking the solution.
CP3 - Membrane permeability
Prepare eight cylinders of beetroot of equal size. Make these samples as similar as possible, e.g. by cutting from the same part of each plant. Rinse each piece to remove any pigment released during cutting.
If you are investigating the effect of temperature, prepare eight water baths of varying temperatures ranging from 0 - 70oC. Leave for 20 minutes.
Prepare a series of test tubes containing the same volume of water (e.g. 10 cm3). Place the tubes in different water for five minutes.
Place a single sample of beetroot into each of the eight test tubes. Leave for 15 minutes.
Use forceps to remove the pieces of beetroot from each tube. Keep the coloured liquid and transfer into a cuvette.
Use a colorimeter to measure how much light is absorbed by each liquid. The darker the solution (i.e. the more permeable the membrane), the more light is absorbed.
Draw a graph plotting absorbance against temperature.
CP4 - Enzymes
1. Dilute stock solution of trypsin with distilled water to produce 4 concentrations. Set up a control and use it to set the colorimeter absorbance to zero.
2. To another cuvette, add 2 cm3 of milk suspension and 2 cm3 of the stock trypsin solution. Mix, place in the colorimeter and measure absorbance at 15 second intervals for 5 minutes.
3. Rinse the cuvette with distilled water.
4. Repeat step 3 at all trypsin concentrations.
Mitosis
1. Warm 1M HCl to 60°C in a water bath.
2. Cut a root tip using a scalpel and add to the HCl. Leave for 5 minutes.
3. Remove from HCl and wash with cold distilled water.
4. Dry and place on a slide. Macerate with needle to spread out the cells.
5. Add a few drops of stain to make chromosomes visible.
Plant stems
Cut a thin section of the plant stem using a scalpel. Take care when using the sample and remember to cut away from you.
Place the tissue sample into water to prevent it from drying out.
Place the tissue sample into a small dish containing the stain. A common stain that is used to view vascular bundles is toluidine blue O (TBO) which stains lignin blue/green which will enable you to visualise the xylem and sclerenchyma fibres. The phloem cells and remaining tissue will appear a pink/purple colour.
Rinse the tissue samples in water and place each one onto a microscope slide.
tensile strength
Set up a clamp stand and attach the plant fibre that you’d like to measure. Tie a weight to the end of the fibre.
Add more weights, one at a time, until the plant fibre breaks. Record the mass of weights that the fibre was carrying before it snapped.
Repeat with different samples of the same fibre at least three times then calculate a mean.
plant mineral def
Prepare a nutrient broth and add the same volume to three test tube. Add varying concentrations of mineral ions to each of the three test tubes.
Record the mass of three plant seedlings - these should all be of the same plant species and the same age. Place plant seedlings on top of each test tube so that their roots are suspended in the broth. You may need to support the seedling with some cotton wool to prevent it from falling into the test tube.
Cover the test tube in foil - this will prevent light from reaching the broth and facilitating the growth of other organisms such as algae.
Place the test tubes near a light source and leave to grow for a certain period of time (i.e. 1 week). Ensure the amount of light intensity each plant receives is the same. Other control variables include temperature and humidity.
Record the new mass of each plant and calculate the change in mass over the one week period.
Repeat the experiment at least three times and calculate the mean change in mass of the plants for each nutrient broth.
The seedling which shows the largest change in mass will be the one that was placed in a nutrient broth with the optimum concentration of mineral ions.
antimicrobrial
Dry out the plant by leaving in the sun until the water has evaporated out then grind using a pestle and mortar.
Soak the ground plant tissue in ethanol - this will extract the antimicrobial substances which are soluble in ethanol.
Filter the solution to remove the pieces of plant tissue. Keep the solution containing the dissolved plant extract.
Prepare a nutrient broth containing bacteria and add the same volume of the broth to a series of Petri dishes.
Using a sterile plastic spreader, spread the bacterial broth evenly across the Petri dish. Remember to keep the lid on the Petri dish wherever possible.
Using sterile forceps, place a disc of filter paper into each antibiotic solution then place far apart on the Petri dish. It is important to keep all control variables (soaking time and size of the disc) the same for each antibiotic.
Incubate the Petri dishes at 25 oC for 24 - 48 hours. It is important that the temperature is not higher (anywhere around 37 oC) since this would pose the risk of growing human pathogens.
Measure the area or the diameter of each clear zone.
Repeat the experiment at least three times and calculate the mean area of the clear zone for each antibiotic.