macro terms
1/196
There's no tags or description
Looks like no tags are added yet.
Name | Mastery | Learn | Test | Matching | Spaced | Call with Kai |
|---|
No analytics yet
Send a link to your students to track their progress
197 Terms
scarcity
problem arising from human wants exceeding resources able to satisfy them; forces us to make choices among alternatives based on incentives
economics
social science that studies the choices individuals, businesses, governments,and societys make to cope with scarcity, the incentives that influence them, and the arrangements coordinate them
microeconomics
study of choices that individuals and businesses make and the way these choices interact and are influenced by governments
macroeconomics
study of total effects that choices of individuals, businesses, and government makes on the national/global economy
How do choices end up determing what/how/for whom
Goods and services how they are produced, what is produced, and who they are produced for
social interest
choices made that are best for society
self interest
choices made that are the best for the individua
rational choice
choice maximizing self-interest
consumption goods
goods and services bought my individuals to provide enjoyment and contribute to a standard of living
capital goods
goods bought by businesses to increase productivity
4 factors of production
the resources used to produce goods and services, including land, labor, capital, and entrepreneurship.
land
gifts of nature used to produce goods and services; natural resource such as minerals, water, plants, animals
labor
work and time devoted to produce goods and services; depends on human capital
entrepreneurship
human resources that organizes labor, land, and capital
capital
tools, instruments, machines, buildings, and other items produced in the past now used for making goods and services
payments to the factors of production
(rent for land, interest for capital, wages for labor, profit/loss for entrepreneurs)
marginal benefit and cost
cost; opportunity cost for a one unit increase in an activity
benefit; what is gained when you get one more unit of something
comparative advantage
the ability of a person to perform an activity or produce a good/service at a lower opportunity cost than someone else
absolute advantage
when an entity is more productive than another
opportunity cost
given up/gained; best thing given up for something else
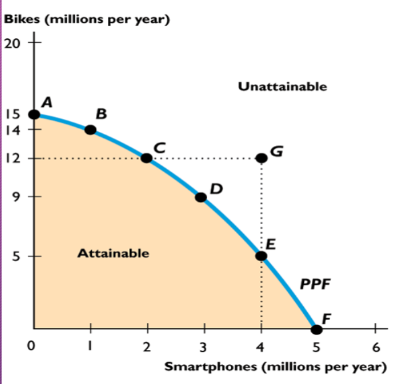
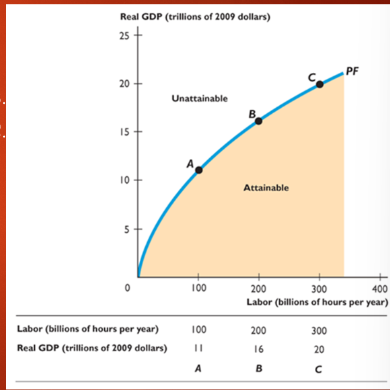
PPC and PPF
Boundary between the combinations of goods and services that can and can’t be produced due to available factors of technology
On the curve is efficient
More resources allow increase in PPF; increase is outwards shift
Slope determines oc
specialization
an economy where people combine and produce in the good where they both have a comparative advantage
demand
relationship between quantity demanded and good price when all other influences stay the same
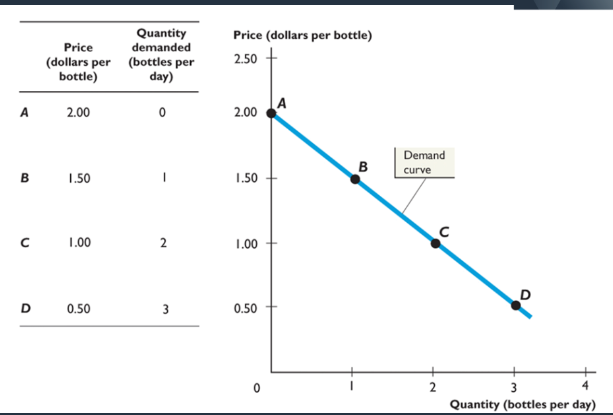
quantity demanded
the amount of any good/service people will buy at a certain price
Only affected by price: Lower the price the more demand
Indicated by an arrow along the curve
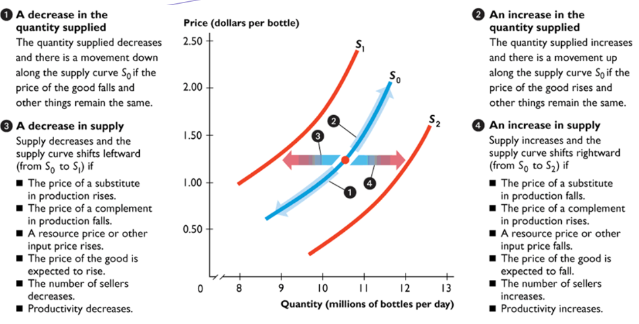
supply
relationship between quantity supplied and price
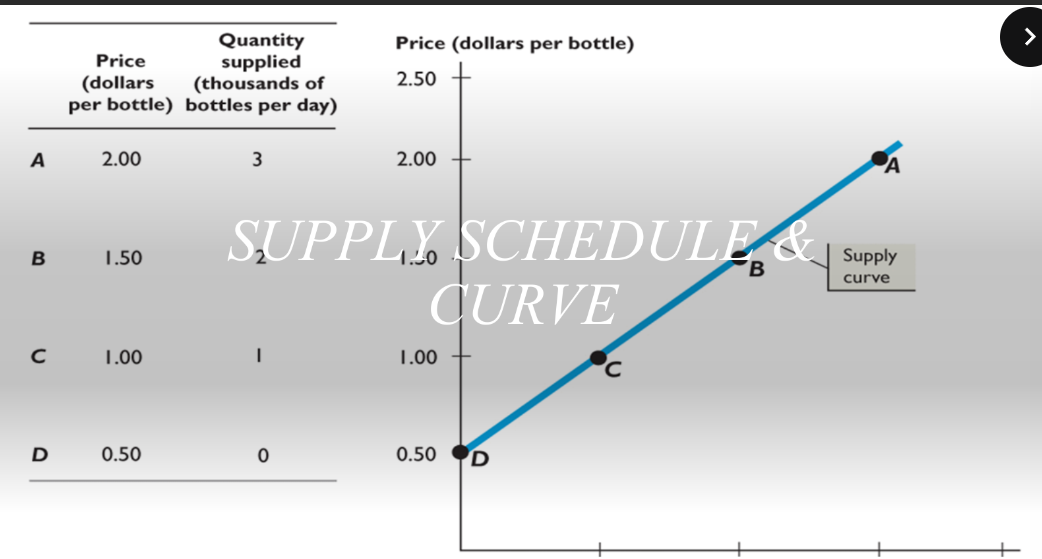
law of supply/quantity supplied
amount of a good or service people are willing and able to sell at a price; rises when price rises, decreases when price falls
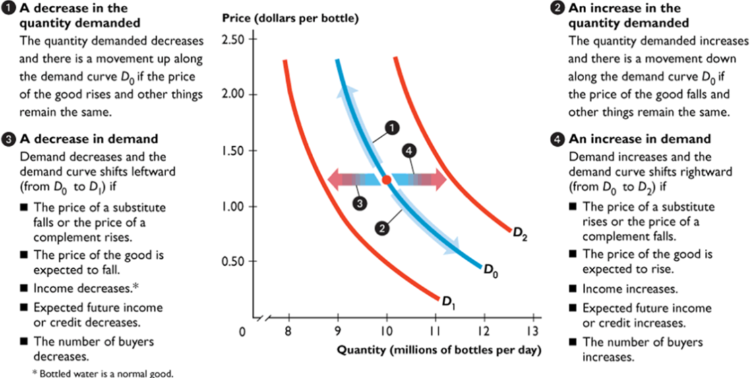
demand shifters: TRIBE
Taste: New information/ new goods may increase demand
Related Goods:
Substitutes: Move in same direction: Demand increases when sub price rises, and vice versa
Complements: Move in opposite direction: Demand increases when price decreases, and vice versa
Income: Rise in income means more demand
#Buyers: More buyers, more demand
Expected Future Income: When income is expected to decrease, demand decreases; vise versa
supply shifters: ROTTEN
Related Goods:
Substitutes: Move in opposite direction; supply decrease when substitute price rises
Complement: Move together: Supply increases if price of complement rises
Other Inputs: Price of a resource/input used to produce a good; more it costs, less supply
Taxes: Taxes lower supply, subsidies increase supply
Technology: Better technology means more supply
Expectations: An expected higher price means more supply
Number of Sellers: More sellers = More supply
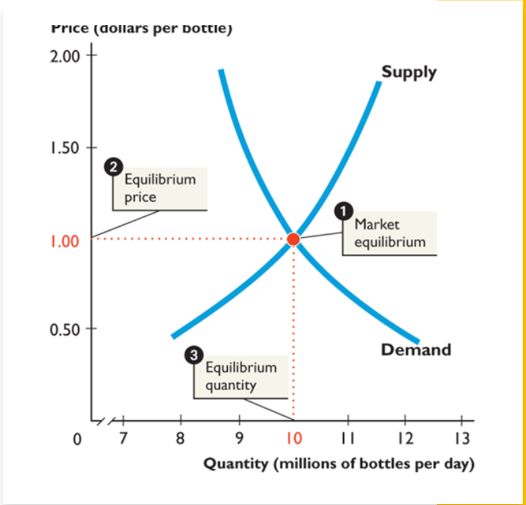
market equilibrium
When quantity demanded = quantity supplied
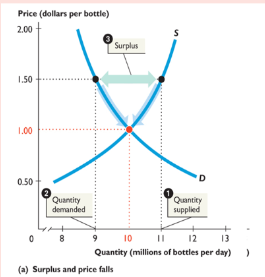
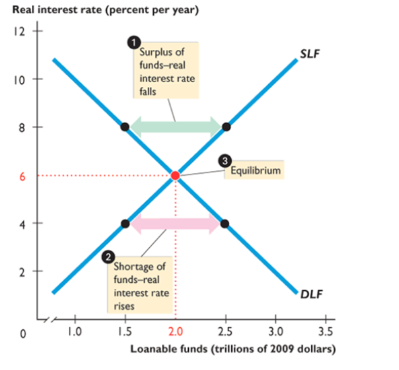
surplus
quantity supplied > quantity demanded; requires the price to fall to equilibrium
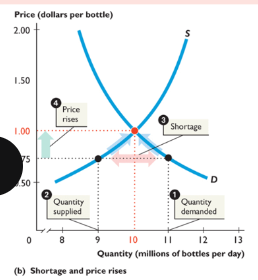
shortage
when quantity demanded > quantity supplied; requires price to rise to equilbrium
circular flow
GDP
the market value of all final goods and services produced within a country in a given time period; calculated quarterly with market prices
final good
good produced for its final user and not as a component of another good
intermediate good
good produced by a firm that is bought by another and used as a part of a final good/service
GDP formula(expenditure approach)
Y = C + I + G + NX(X-M)
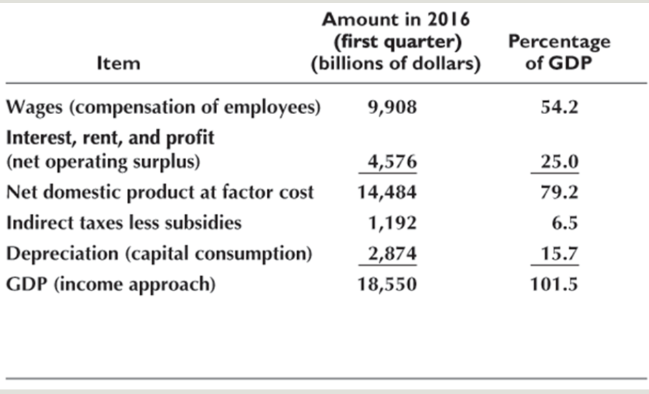
Income approach
Wages + interest, rent, profit + NDP at factor cost +indirect taxes- subsidies + depericiation
gnp
market value of all final goods and services produced anywhere in the world in a given time period by factors of production supplied by residents; doesn’t matter where its produced
real vs nominal
real; expressed in base year nominal; expressed in same year
gdp deflator
(Nominal/Real GDP)*100; average of all the current prices of all the goods and services included in GDP
potential Gdp
real GDP when economy is at full employment
CPI
measure of the average of the prices paid by urban consumers for a fixed market basket of consumer goods and services
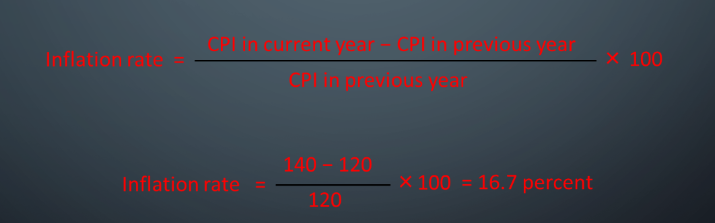
Inflation Rate
Change in price level from one year to the next
Nominal and Real Interest Rate
Real IR = Nominal -Inflation rate
labor force
number of people employed + unemployed
unemployed
have not worked while being available to work; made efforts to find employment in past 4 weeks or were waiting to be recalled to a job they were laid off from
working age population
the total number of people 16 and over who are not in jail, hospital, or some other form of insitution
Unemployment rate
percentage of people in labor force who are unemployed

Employment-pop ratio
percentage of the working-age population who are employed

Labor force particpation rate
the percentage of the working-age population who are members of the labor force

Frictional unemployment
unemployment coming from normal labor turnover; people entering and leaving jobs
Structural Unemployment
unemployment coming from technological changes
Cyclical Unemployment
unemployment due to the business cycle
Natural Unemployment
unemployment that arises from frictional and structural change without cyclical unemployment; rate hovers around 4.5 to 5.5
Full-employment
employment where almost everyone finds a job; no cyclical employment
production function
relationship showing the maximum quantity of real GDP that can be produced as quantity of labor and real GDP changes; demonstrates dimishing returns
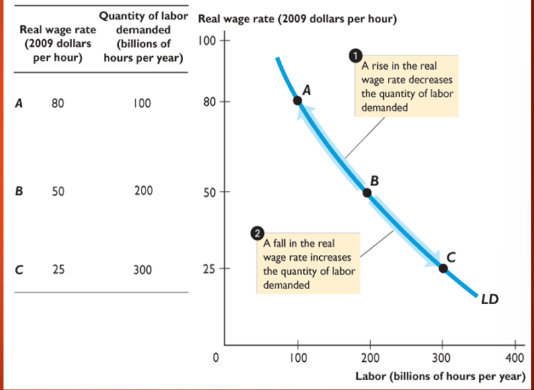
labor demand
quantity of labor demanded compared to real wage rate
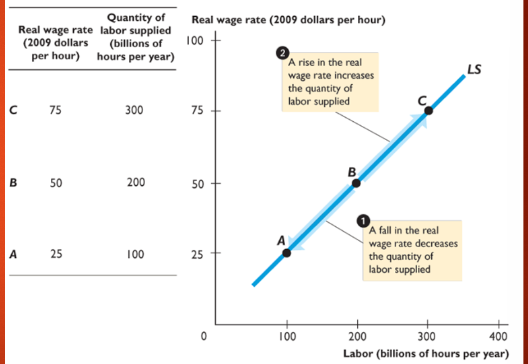
labor supply
quantity of labor supplied compared to real wage rate
classical approach
market economy gives best macroeconomic performance; aggregate fluctuations are a natural consequence of expanding economy; government intervention only hinders ability of market to allocate resources; disputed during Great Depression with high unemployment and stagnant production
keynesian approach
market economy is unstable and needs active government interventon for full employment and sustained economic growth; promoted by John Meynard Keynes;believes too little consumption and investment caused Great Depression; wanted to cure unemployment in the short term but also increased it in long term
monetarist approach
classical approach but takes into account economic fluctuations leading to the business cycle; believe that monetary contractions cause recessions
NRU
rate of unemployment at full employment
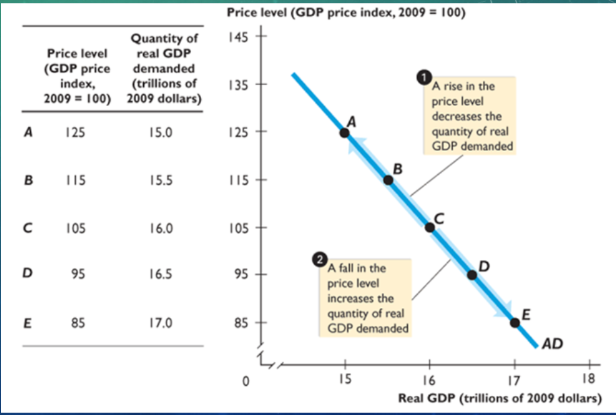
Aggregate demand
total of demand; relationship between quantity of real GDP demanded and the price level
When price level rises, quantity of real GDP demanded decreases; and vice versa
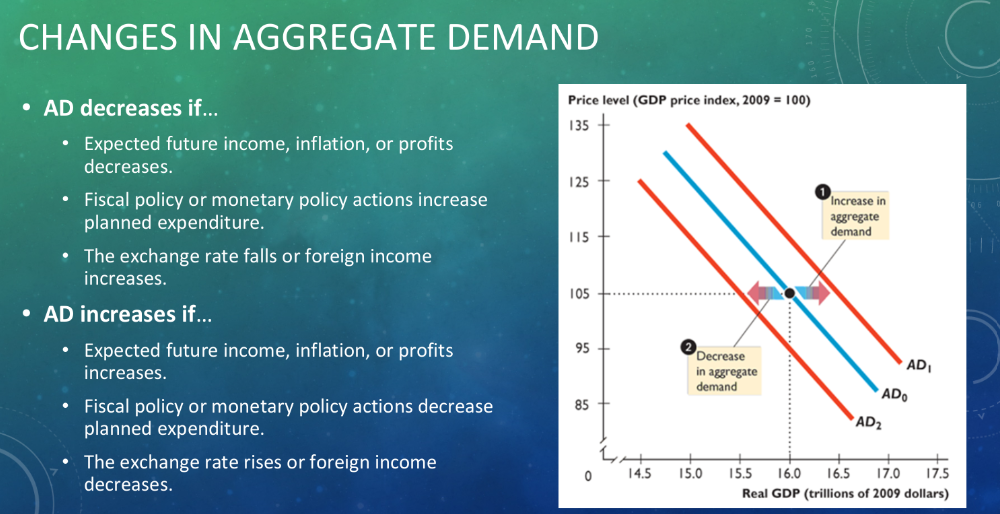
Expectations: Increase in expected future income, inflation, or profit increases AD
Increase in foreign income increases AD
Monetary policy; Tax cut or interest rate cut increases it
Aggregate demand shifters
Same as Real GDP; C+I+G+NX
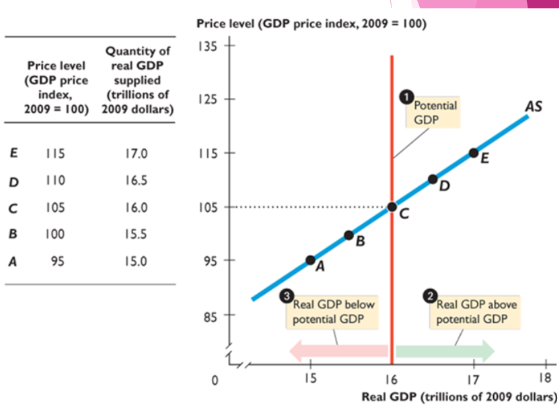
Aggregate supply
relationship between total amount of final goods and services that firms plan to produce(quantity supplied) and price level
Demands on 4 factors of production
Potential is LRAS
AS shifters
Key Resources: More expensive, less supply(remember wages)
Productivity; more productivity with new technology and capital
Quality of Labor: More is more supply
Change in EXPECTED price level: affects wages
Gov’t action: Taxes and subsidies
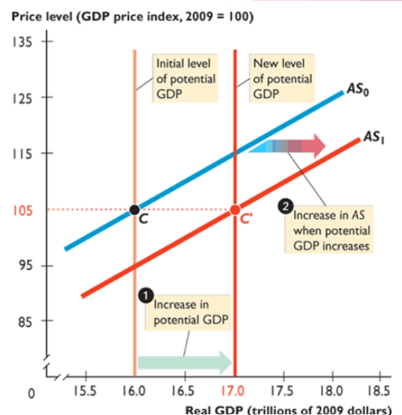
Anything that changes potential GDP shifts AS
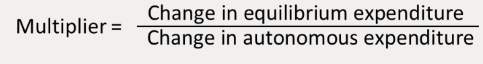
Multipliers
magnifies expenditure changes; equilibrium expenditure/autonomous expenditure; always greater than 1
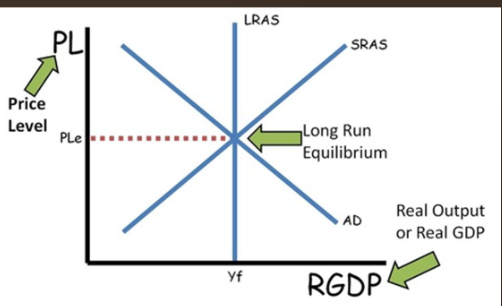
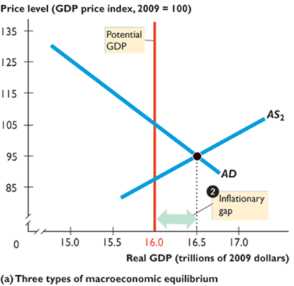
AS-AD graph
explains fluctuations in GDP and price level
when firms can’t meet demand they increase production and raise prices; when they can’t sell what they produce they cut production and lower prices
Equilibrium = full employment
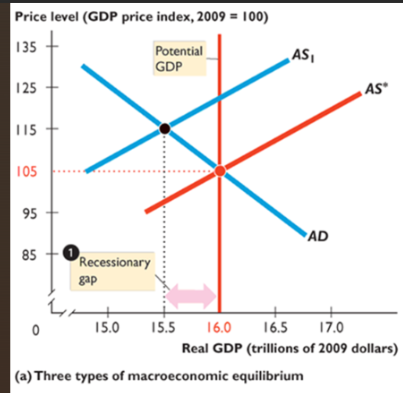
recessionary gap
exists when potential GDP > real GDP; price level falls
inflationary gap
exists when real GDP > potential GDP; price level rises
Human capital
knowledge and skills people obtain from education, training, and work-experience
Aggregate expenditure
Same components as real GDP
MPC
Marginal propensity to consume; Consumption expenditure/disposable income; larger this is, larger the multiplier; 1/1-mpc = multiplier
MPS
1/MPS = multiplier; equal to 1-MPC; marginal propensity to save
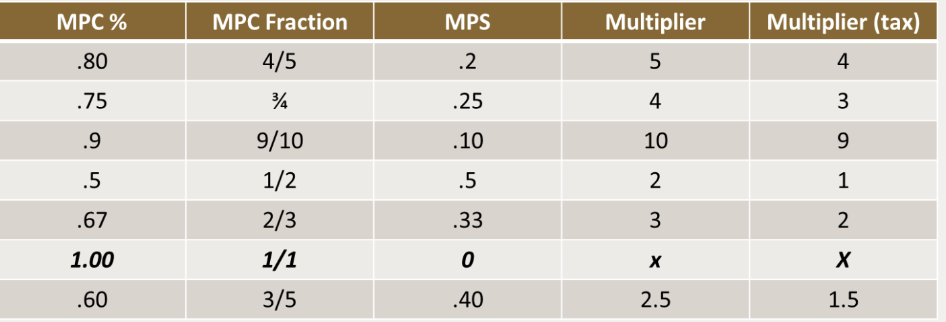
Tax multiplier
MPC multiplier- 1
financial capital
funds firms use to buy and operate physical capital
gross investment
the total amount spent on new capital goods
net investment
the change in the quantity of capital; gross investment - depreciation
depreciation
wealth
value of all things a person owns; not earn
loan markets
market for loans to buy big ticket items and inventories; earn high interest rates
bond markets
bond; promise to pay amount of money on a specified date; used by gov’t and firms to raise money
stock markets
stock are certificates of ownerships and claim to the profits a firm makes; traded in these markets
financial institutions
a firm that borrows and lends financial capital
saving
the amount of income that is not paid in taxes or spent on consumption goods
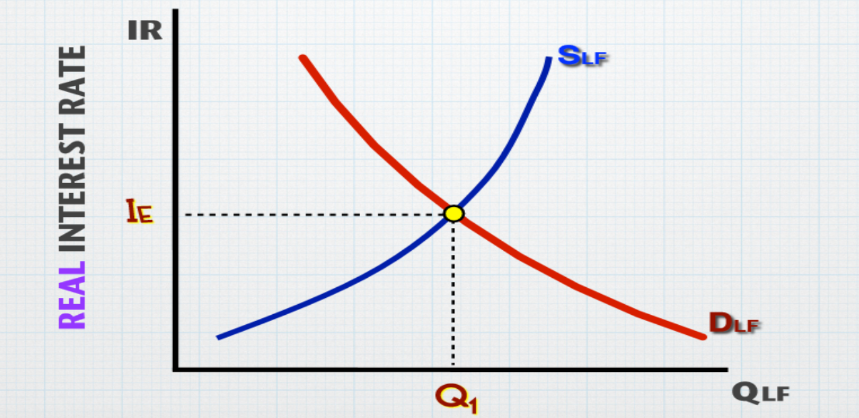
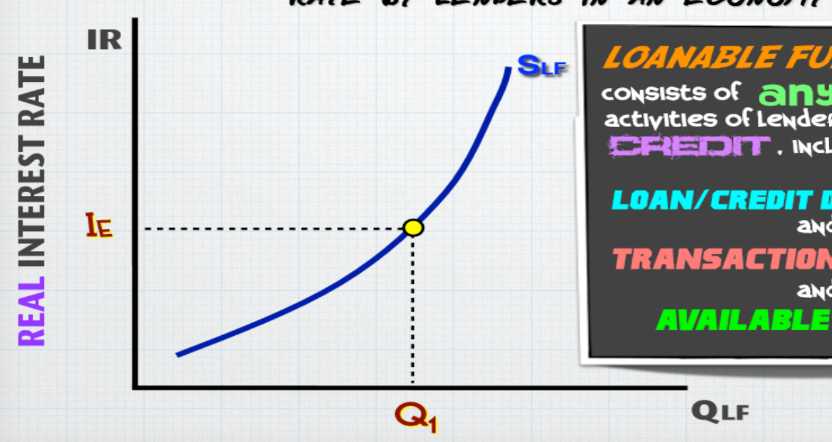
loanable funds market
aggregate of loan, bonds, and stock markets; relationship between RIR and quantity
Used for investment
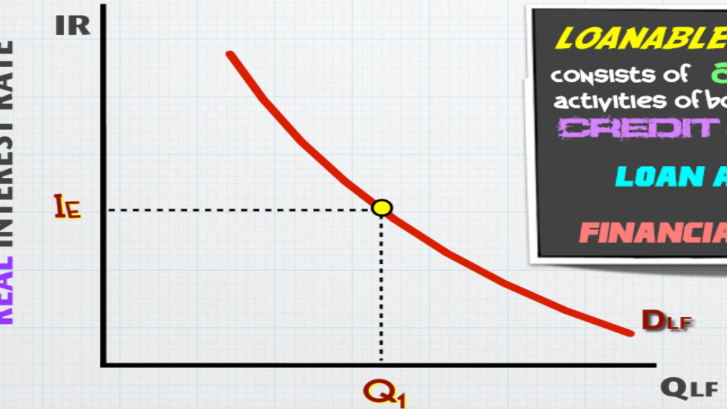
demand for loanable funds
Higher IR = smaller QLF demanded
Demand is shifted by expected profit; increase and decrease together
Supply is quantity of credit provided at RIR; financed by saving
supply for loanable funds
Higher interest rate = greater QLF supplied
More disposable income decreases it; increase in wealth or expected future income increases
equilibrium for loanable funds
increase in demand = higher RIR; increase in supply = lower rir
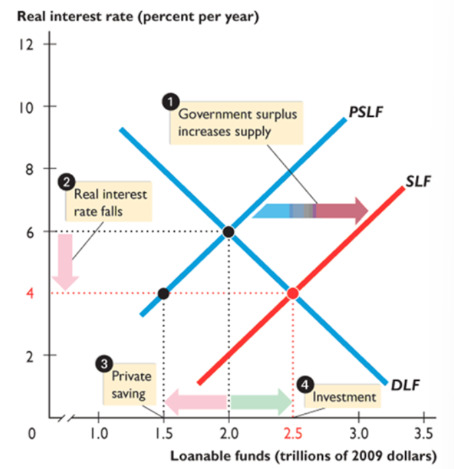
gov’t budget surplus
increases the supply of loanable funds, bringing a lower interest rate, decreasing quantity of private saving, increasing quantity of investment and loanable funds demanded; highly unlikely
gov’t budget deficit
increases DLF, raising RIR, increasing quantity of private saving, decreasing investment and QLF
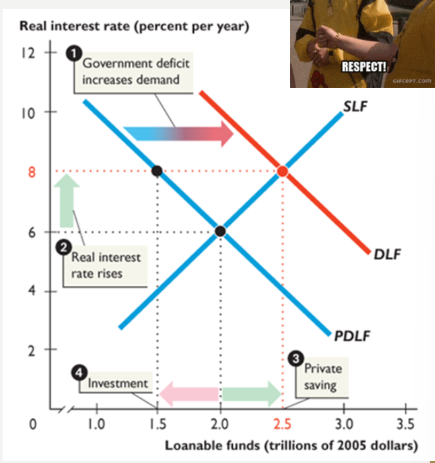
crowding-out effect
tendency for a government budget deficit to raise RIR and decrease investment
ricardo-barro effect
budget deficit doesn’t really affect RIR or investment; supply of loanable fund increases by amount = to deficit to make up for it
money
commodity or token generally accepted as a means of payment
functions of money
medium of exchange; general accepted in return for goods and services
unit of account: agreed-upon measure for stating the prices of goods and services
store of value: a commodity/token that can be held and exchanged later for goods and services
fiat money
money because the law says so
monetary base
sum of coins, Fed notes, and banks reserves at the Fed
m1
currency by individual and businesses, traveler’s checks, and checkable deposits; is money
m2
M1+ saving deposits, small time deposits, money market funds, and other deposits; is not money
reserves
currency in bank’s vaults + balance at Fed’s reserve account