TERM 3 REVISION BIOLOGY PRE-IB YR 10
1/230
There's no tags or description
Looks like no tags are added yet.
Name | Mastery | Learn | Test | Matching | Spaced | Call with Kai |
|---|
No study sessions yet.
231 Terms
Ecology
The study of interactions between living organisms and their environment.
Ecosystem
A community of living organisms interacting with each other and their nonliving environment.
Habitat
The area in which species normally live.
Biotic Factors
The living aspects of the environment, including other organisms.
Abiotic Factors
The nonliving aspects of the environment, such as sunlight, soil, temperature, and water.
Species
A group of individuals that have the potential to interbreed and produce fertile offspring.
Population
A group of organisms of the same species who live in the same area at the same time.
Community
Populations of different species living and interacting with each other in a defined environment.
Population Size
The number of individuals in a population.
Large pops - more stable as likely have greater genetic variability therefore potential to adapt to changes in environment (natural selection)
Population Density
The number of individuals per unit geographic area, for example, number per square meter, per hectare, or per square kilometer.
Population Distribution
The arrangement of individuals within a given area.
Population Growth
The increase in the number of individuals in a population.
Natality
The birth rate of a population, contributing to population size increase.
Immigration
The movement of individuals into a population, contributing to population size increase.
Mortality
The death rate of a population, contributing to population size decrease.
Emigration
The movement of individuals out of a population, contributing to population size decrease.
Carrying Capacity
The maximum population size that can be supported by the environment.
Measuring Population Size
Determining the total number of individuals of a given species living in the same area at the same time.
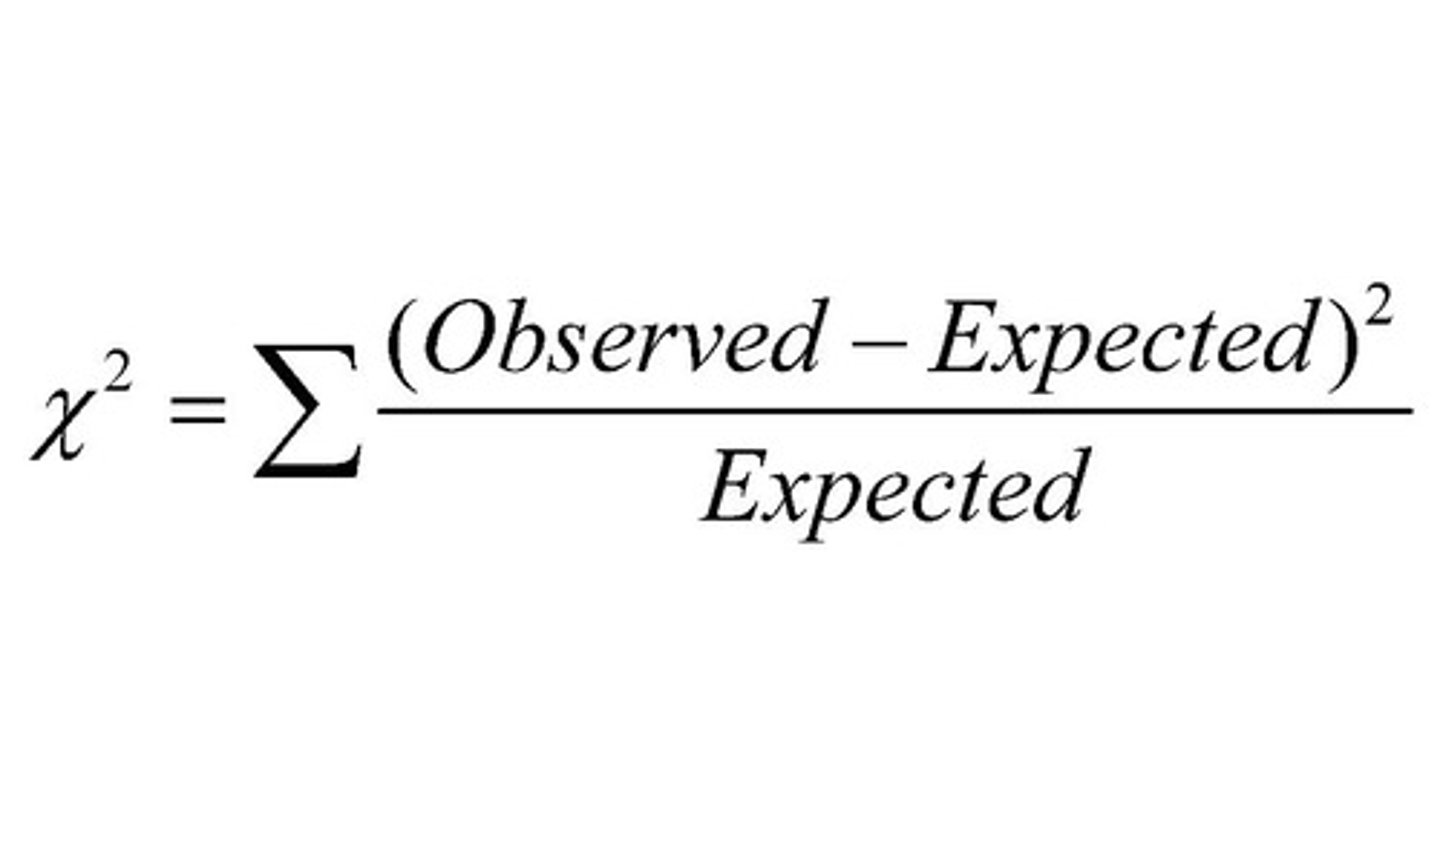
Chi Squared Test
A statistical test used to evaluate the differences between observed and expected frequencies.
Larger Populations
May be more stable than smaller populations due to greater genetic variability.
Population Techniques
Various methods used to measure population size.
Populations
Fluid and subject to continual change in numbers through natality, mortality, immigration and emigration.
Population sampling
Involves identifying individual numbers in small areas and then extrapolating to estimate population totals.
Random sampling
Sampled areas must be chosen randomly to avoid selection bias causing a misrepresentation of the population size.
Sampling accuracy
The more samples that are taken (and the larger the sampling area), the more accurate population estimates are likely to be.
Non-motile species sampling
Can be sampled using quadrats, with measurements including direct counts, percentage cover or frequency.
Motile species sampling
Can be sampled using the capture-mark-release-recapture method, with estimates based on the Lincoln index.
Capture-mark-release-recapture method
A means of estimating the population size of a motile species.
Capture (n1)
A selection of individuals are captured, counted, marked and released.
Second capture (n2)
After sufficient time has passed, a second capture is made.
Marked individuals (n3)
In the second capture, both unmarked individuals and marked individuals are counted.
Lincoln Index
An estimated population size is derived using the values generated from n1, n2, and n3.
Quadrat
A square frame of a known size used in estimating plant populations.
Quadrat sampling method
A sampling area (often 1 square metre) in which the number of organisms is counted and recorded.
Population size estimation formula
Mean number per quadrat x total area / area of each quadrat.
Reintegration time
Sufficient time must pass to allow marked individuals to reintegrate in the population.
Sampling repetition
Counting organisms in a number of quadrats is usually considered to be representative of the total area under investigation.
Quadrat placement
A quadrat is placed randomly in the area to be surveyed.
Population estimation
The population can be estimated using the equation: mean number per quadrat x total area / area of each quadrat.
Selection bias
A misrepresentation of the population size caused by non-random sampling.
Direct counts
A measurement method for non-motile species in quadrats.
Percentage cover
A measurement method for non-motile species in quadrats.
Frequency
A measurement method for non-motile species in quadrats.
Quadrat Sampling
A method to determine the presence of two species within a given environment using a rectangular frame of known dimensions.
Sampling distributions for quadrats
even spaced
random (chance)
zoned (clustered)
Percentage coverage
An estimation method for counting the number of individuals of a given species in a quadrat.
Motile organisms
Organisms that are not effectively counted using quadrat sampling, as it is used for counting plants and sessile animals.
Presence or absence
Identification of whether each species is found within a quadrat.
Chi Square Test
A statistical test applied to data from quadrat sampling to determine significant associations between two species.
Positive association
When two species are typically found within the same habitat, indicating a relationship such as predator-prey or symbiotic.
Negative association
When two species tend not to occur within the same habitat, often due to competition for resources.
Competitive exclusion
A scenario where one species utilizes resources more efficiently, preventing the survival of another species.
Resource partitioning
When both species alter their use of the environment to avoid direct competition.
No association
When two species do not interact, resulting in independent distribution.
Chi-Squared Tests
A statistical method used to analyze the association between two species based on quadrat sampling data.
Hypotheses in Chi-Squared Test
Null hypothesis (Ho): two species are distributed independently; Alternative hypothesis (H1): two species are associated either positively or negatively.
Expected frequencies
The minimum expected frequency of 5 or larger is required to conduct a chi-square test.
Degree of freedom (df)
A value calculated in the chi-squared test that is necessary for determining the p value.
P value
A statistical measure that should be less than 0.05 to indicate a significant association in a chi-squared test.
Chi Square how to do:
p value should be <0.05
make little table (present, absent, total)
times 2 corresponding total boxes then divide by big total for expected frequency
then do that little equation on the screen rn
Quadrat samples
A total of 150 samples used to establish distribution patterns of the two fir tree species.
Distribution results
25 quadrats with both species present, 30 with Noble Fir only, 45 with Grand Fir only, and 50 with neither present.
What is the null hypothesis (Ho) regarding two species?
Two species are distributed independently.
What is the alternative hypothesis (H1) regarding two species?
Two species are associated either positively (occur together) or negatively (occur apart).
What is a requirement for testing the hypotheses about species association?
All expected frequencies must be 5 or larger and the sample must be taken at random.
What are the two main classifications of organisms based on their modes of nutrition?
Autotrophs and Heterotrophs.
autotrophy
They are known as producers.organisms which synthesise organic molecules into inorganic sources
heterotrophy
organisms which obtain organic molecules from other organismss
detritivores
Detritivores are heterotrophs that obtain nutrients from non-living organic sources, such as detritus and humus.
Define detritus and humus in the context of detritivores.
Detritus is dead, particulate organic matter, while humus is decaying leaf litter intermixed within the topsoil.
Give examples of detritivores.
Dung beetles, earthworms, woodlice, snails, and crabs.
saprotrophs
Saprotrophs live on or in non-living organic matter, secrete digestive enzymes, and absorb the products of digestion.
Why are saprotrophs commonly referred to as decomposers?
Because they facilitate the breakdown of dead organic material.
What are examples of saprotrophs?
Bacteria and fungi.
How is energy flow represented in ecosystems?
Energy flow is depicted by food chains and food webs.
What is the difference between a food chain and a food web?
A food chain is a linear sequence of organisms, while a food web is a series of interconnected food chains.
What is meant by unidirectional energy flow in food chains/webs?
Energy flows in one direction through the food chain/web, from producers to consumers.
What are abiotic factors in a food web?
Examples include the sun, water, and other environmental factors.
Identify the producers in a given food web example.
Grasses, gum trees, acacia trees, and marigold daisies.
Who are the primary consumers in a food web?
Herbivores such as the princess parrot, koala, bull ant, emu, and kangaroos.
What are secondary consumers in a food web?
Organisms that consume primary consumers, such as rats, snakes, and thorny devils.
What are tertiary consumers in a food web?
Organisms that consume both primary and secondary consumers, such as dingoes and eagles.
What is competition in the context of species interactions?
Competition occurs when species vie for the same resources in an ecosystem.
Describe the predator-prey relationship.
In this relationship, one species kills and eats another species, with the predator doing the killing.
How do plants protect themselves from herbivores?
Plants may use physical structures like thorns or chemical defenses that are distasteful or poisonous.
What are symbiotic relationships?
Relationships in which organisms live together and depend on each other, including parasitism, mutualism, and commensalism.
Parasitism
A relationship between two organisms of different species where one benefits and the other is harmed
(host and parasite)
Mutualism
A relationship between two species in which both species benefit
Commensalism
a symbiotic relationship where on organism benefits and the other neither is harmed nor benifted
consumers
ingest organiv matter which is living or recently killed
modes of nutrition in organisms
hahahaha get a graph loser (in 6.2)
two types of autotrophs?
photoautotroph:
photosynthesis - makes organic compounds using energy derived from sun (solar energy)
chemoautotroph:
chemosynthesis - makes organic compounds using energy derived from oxidation of chemicals
producers
Organisms that produce energy through photosynthesis or chemosynthesis, such as plants.
trophic levels
The hierarchical levels in an ecosystem, where organisms are classified based on their feeding relationships.
energy flow
The transfer of energy through a food chain or food web, typically in a unidirectional manner.
consumers
Organisms that obtain energy by consuming other organisms, such as animals.
food chain
A linear sequence of organisms through which nutrients and energy pass as one organism eats another.
food web
A complex network of interconnected food chains in an ecosystem.
pyramid of energy
A graphical representation showing the energy content at each trophic level in an ecosystem.
The 10% law
only about 10% of the energy from one trophic level in an ecosystem is transferred and incorporated into the biomass of the next trophic level; the remaining 90% of energy is lost, primarily as heat, due to metabolic processes, incomplete consumption, or incomplete digestion