UPDATED The Practice of Statistics, 6e, Chapter 1 -- DUMB EDITION
1/17
Earn XP
Description and Tags
more straightforward definitions / examples from the book. basically my notes but i don't want to write them
Name | Mastery | Learn | Test | Matching | Spaced | Call with Kai |
|---|
No analytics yet
Send a link to your students to track their progress
18 Terms
individual
people, animals, things that are being studied - usually in the question and not the table
variable
characteristic that changes from one individual to another
categorical data
values that are group/labels, can’t take average of them
quantative data
numerical values, can count and take average of
discrete variable
quantitative variable that’s a fixed set with gaps in data, basically can’t have decimals
ex: number of languages spoken (can only speak 1, 2 or 3, not 2.5)
continuous variable
quantitative variable that can take any value in an interval, basically can take decimals and fractions
ex: height
distribution
what values the variable takes/how often it takes those values
frequency table
number of individuals having each value (the numbers you see in the table)
relative frequency table
proportion/percent of individuals having each value (have to do math for this)
marginal relative frequency
part/every individual
ex: proportion of people in the sample who never used a snowmobile
proportion
number between 0 and 1
percent
number between 0 and 100 - multiply proportion by 100
conditional relative frequency
key word: given, of
ex: what proportion of environmental club members in the sample are snowmobile owners?
join relative frequency
key word: and
ex: proportion of people in the sample are not environmental club members and never use snowmobiles
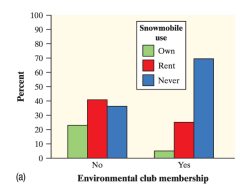
side by side bar graph

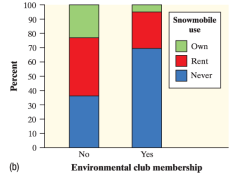
segmented bar graph

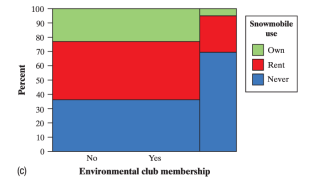
mosaic plot

association
knowing one variable helps us predict the value of the other
core (explanatory variable, x-value, input) predict elective (response variable)
ex: club members more like to rent or own a snowmobile