chap. 44 - Population Ecology
1/26
There's no tags or description
Looks like no tags are added yet.
Name | Mastery | Learn | Test | Matching | Spaced |
|---|
No study sessions yet.
27 Terms
key characteristics of populations
size, range, density
random distribution
‒ Individuals have equal chance of occupying any position
‒ Individuals do not influence one another
clumped distribution
‒ Resources are clustered
‒ Individuals enhance each other's survival
overdispersed distribution
‒ Limited resources / competition between individuals
‒ Chances of survival are lower when individuals are close to each other
Mark-and-Recapture
Population Size (N)
Butterflies caught on the first day (M)
Marked and unmarked on the second day (C)
Recaptures (R)
N = C/R × M
Factors Affecting Population Size
births, deaths, immigration, emigration
Population Growth Equation
(births + immigration) - (deaths + emigration)
ΔN = N2 - N1= (B - D) + (I - E)
If a population starts with 80 individuals and grows to 120 after 2 years, what is the population increase per year?
The population has gained 40 individuals in 2 years (40/2) or 20 individuals per year.
Exponential growth in a population
no outside impact on growth of population
Logistic Growth in a Population
Limiting factors keep growth in check - hence a "carrying capacity" for each species in each space in each time
population growth per capita
r = (ΔN/Δt) of N1
Per capita growth rate over time?
Nt = N1*(1 + r )^t
Density-Independent Factors
- Limit populations regardless of population density
- Droughts or other severe events
- Environmental conditions (temperature, light availability...)
Density-Dependent Factors
- Competition for limited resources
- Predation, Parasitism
- Diseases
carrying capacity (K) is specific to what?
species-specific, time-specific and location-specific!!
Population Demography
the study of statistics such as birth rates, age or size structure, and distribution over time and environments
organism's life history
The pattern of investment in growth vs. reproduction vs. survival over an organism's lifetime
Survivorship curves
show how survival or mortality rates change with age
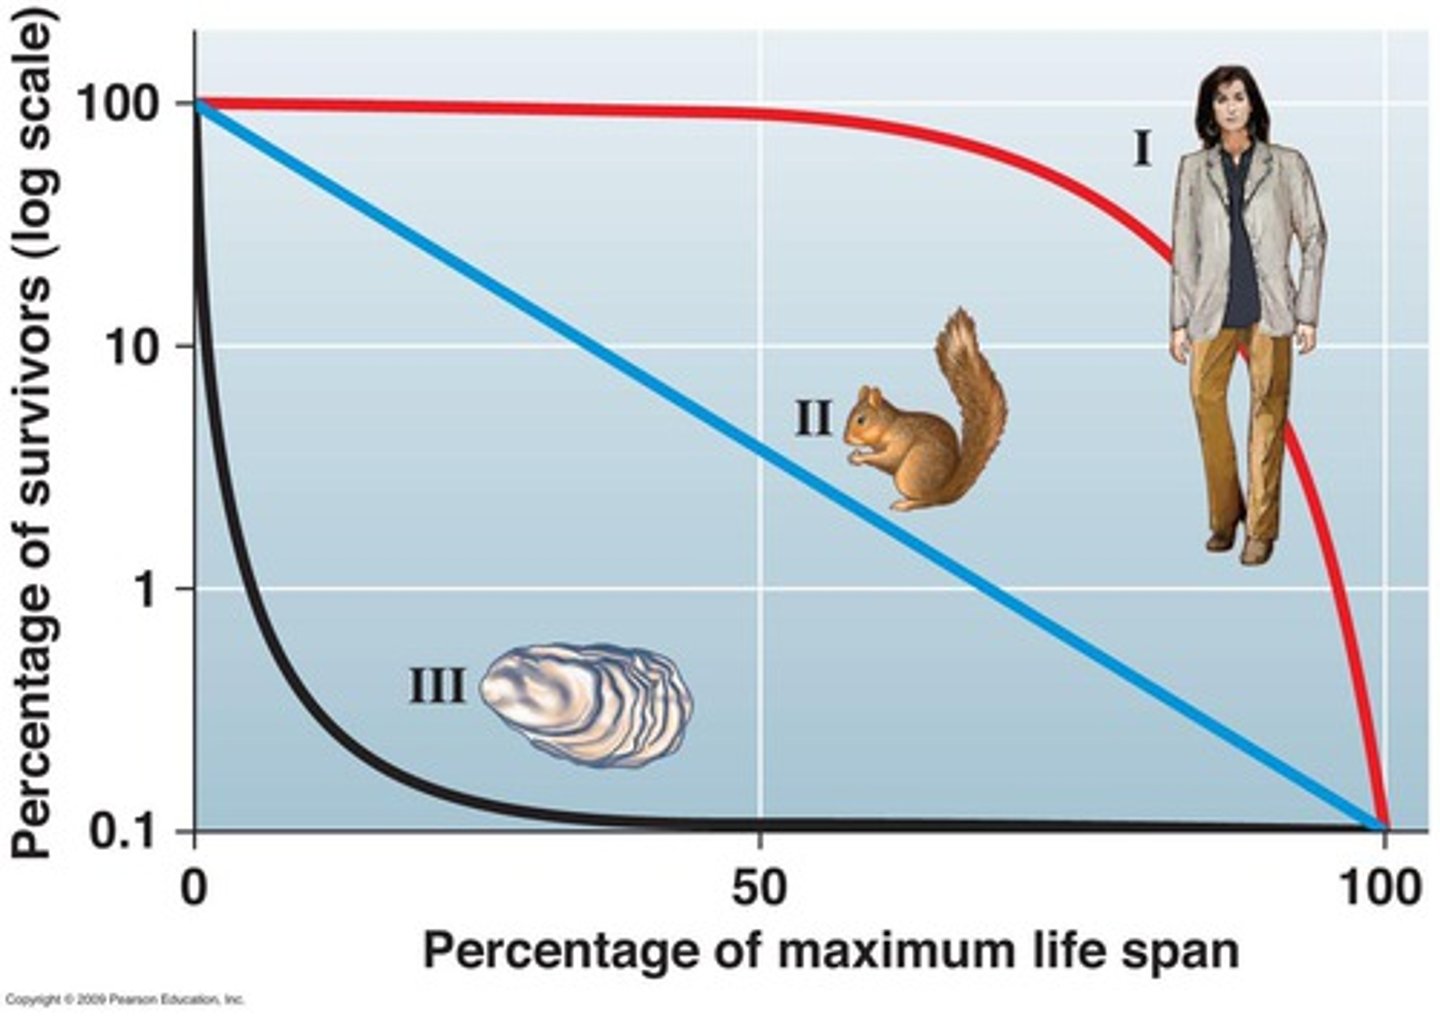
Type 1 survivorship curve
• mortality rate increases later in life
• large mammals (bears, humans, dogs...)
• annual plants (most seedlings survive to reproduce)
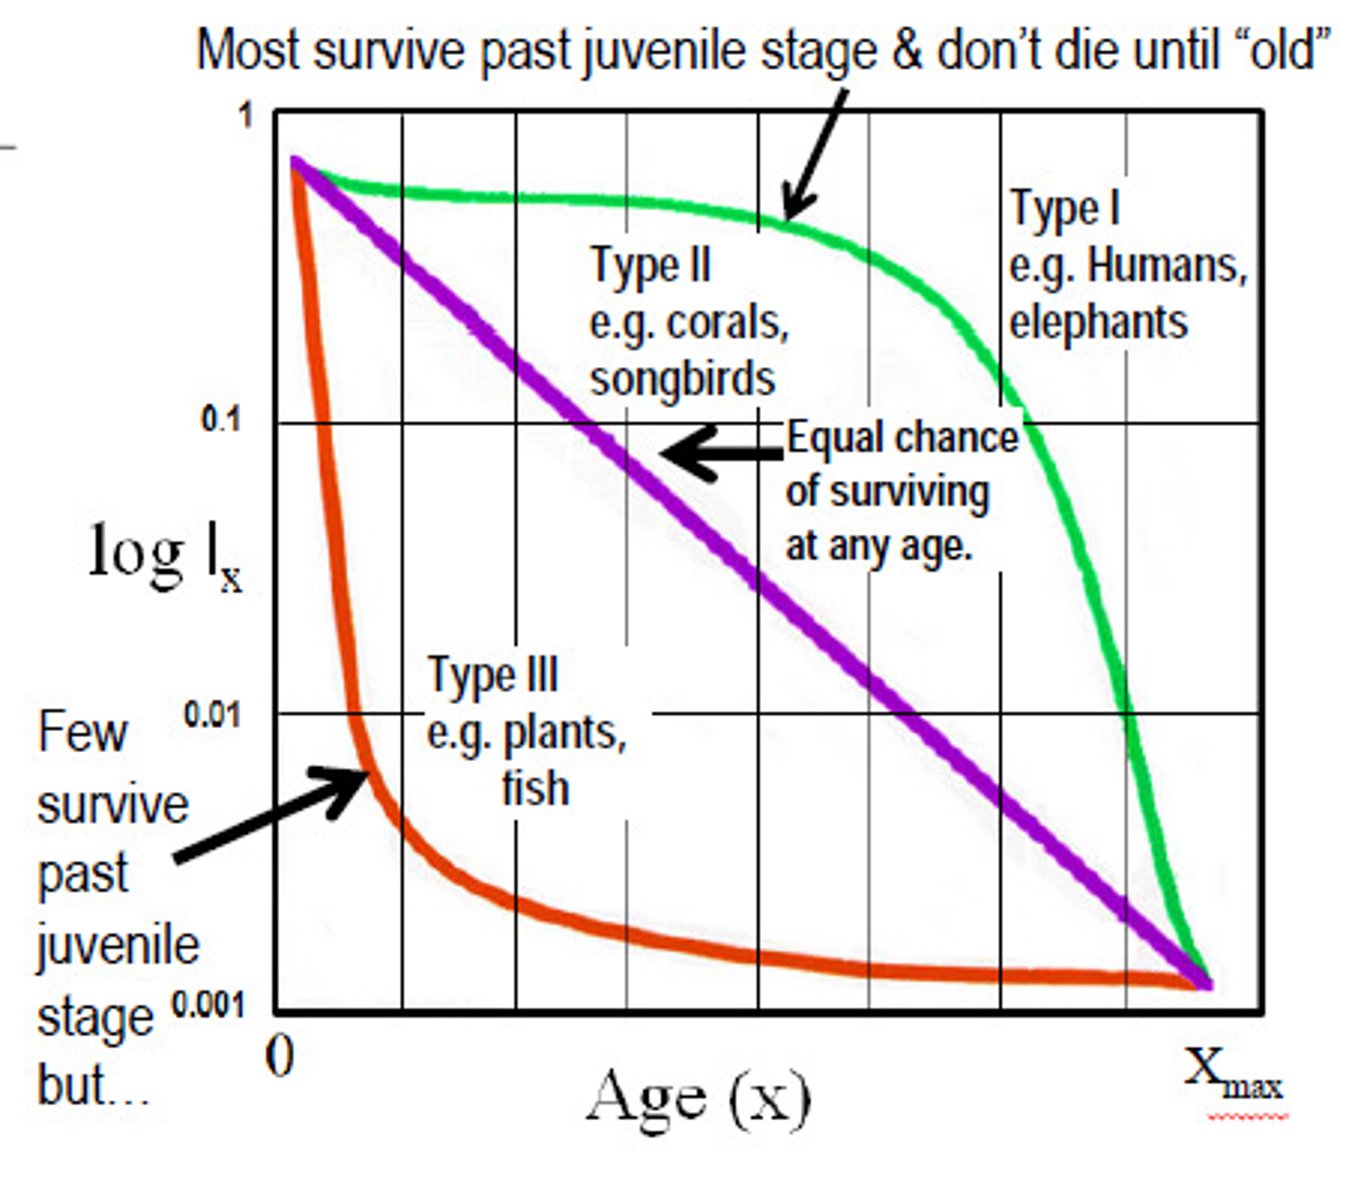
Type II survivorship curve
• mortality rate is constant over life
• plants competing for limited space which "self-thin"
• reptiles
• birds

Type III Survivorship curve
- mortality rate is highest in the young
- insects & marine organisms with tiny dispersing larvae and most trees

iteroparity
Repeated reproduction over lifetime
Semelparity
single reproductive event then death.
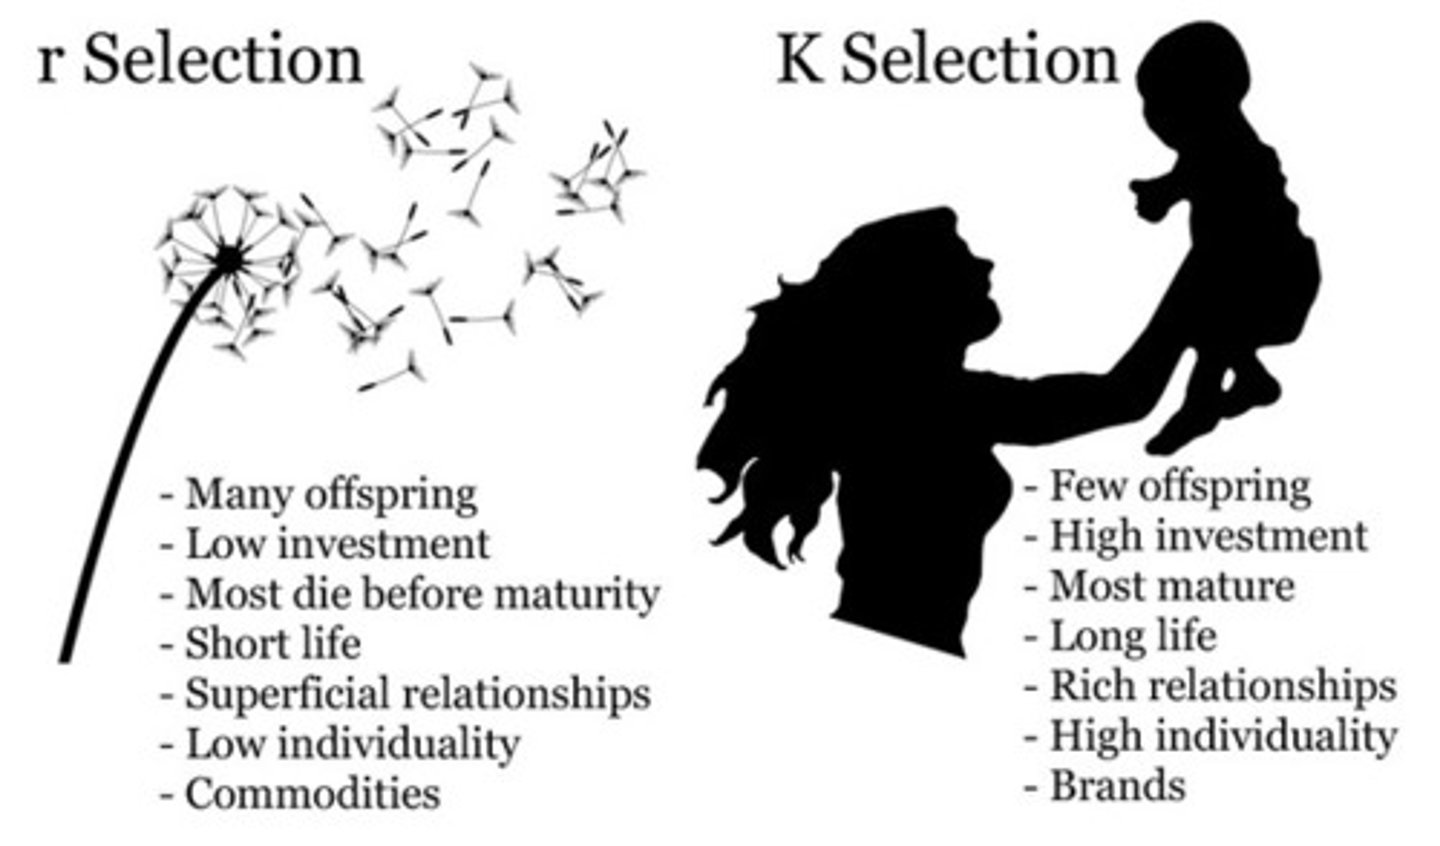
r-strategists
grow exponentially when environmental conditions allow them to reproduce

k-strategists
species where organisms tend to reproduce later in life, have a smaller number of offspring, and are long living
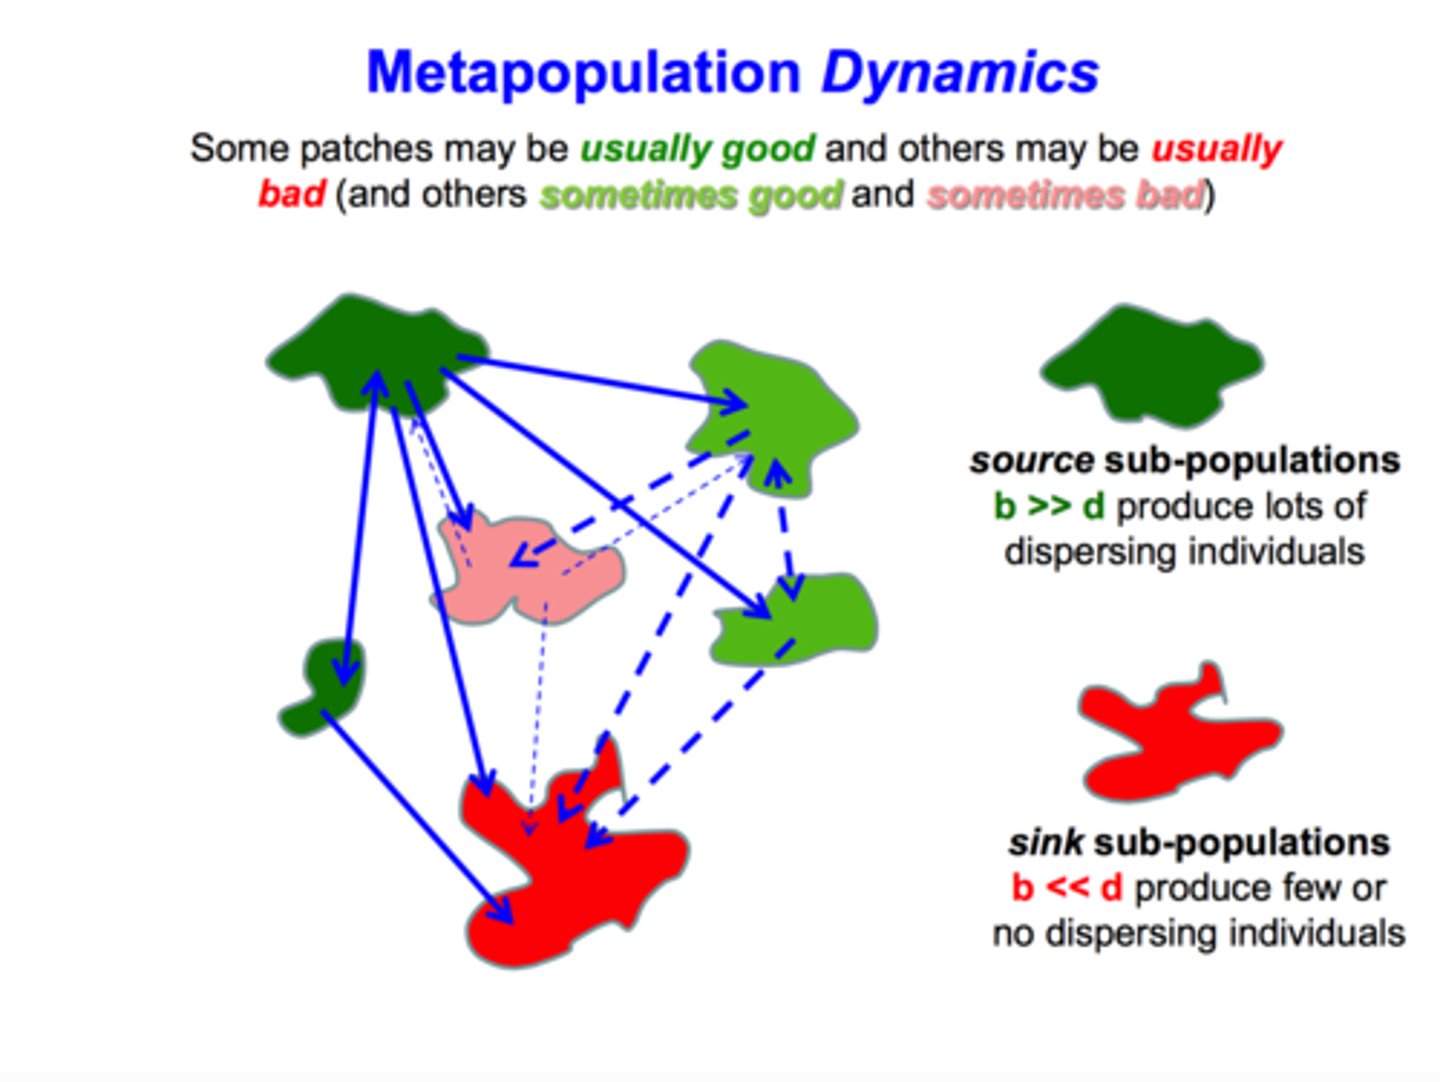
Metapopulations
a group of spatially distinct populations that are connected by occasional movements of individuals between them
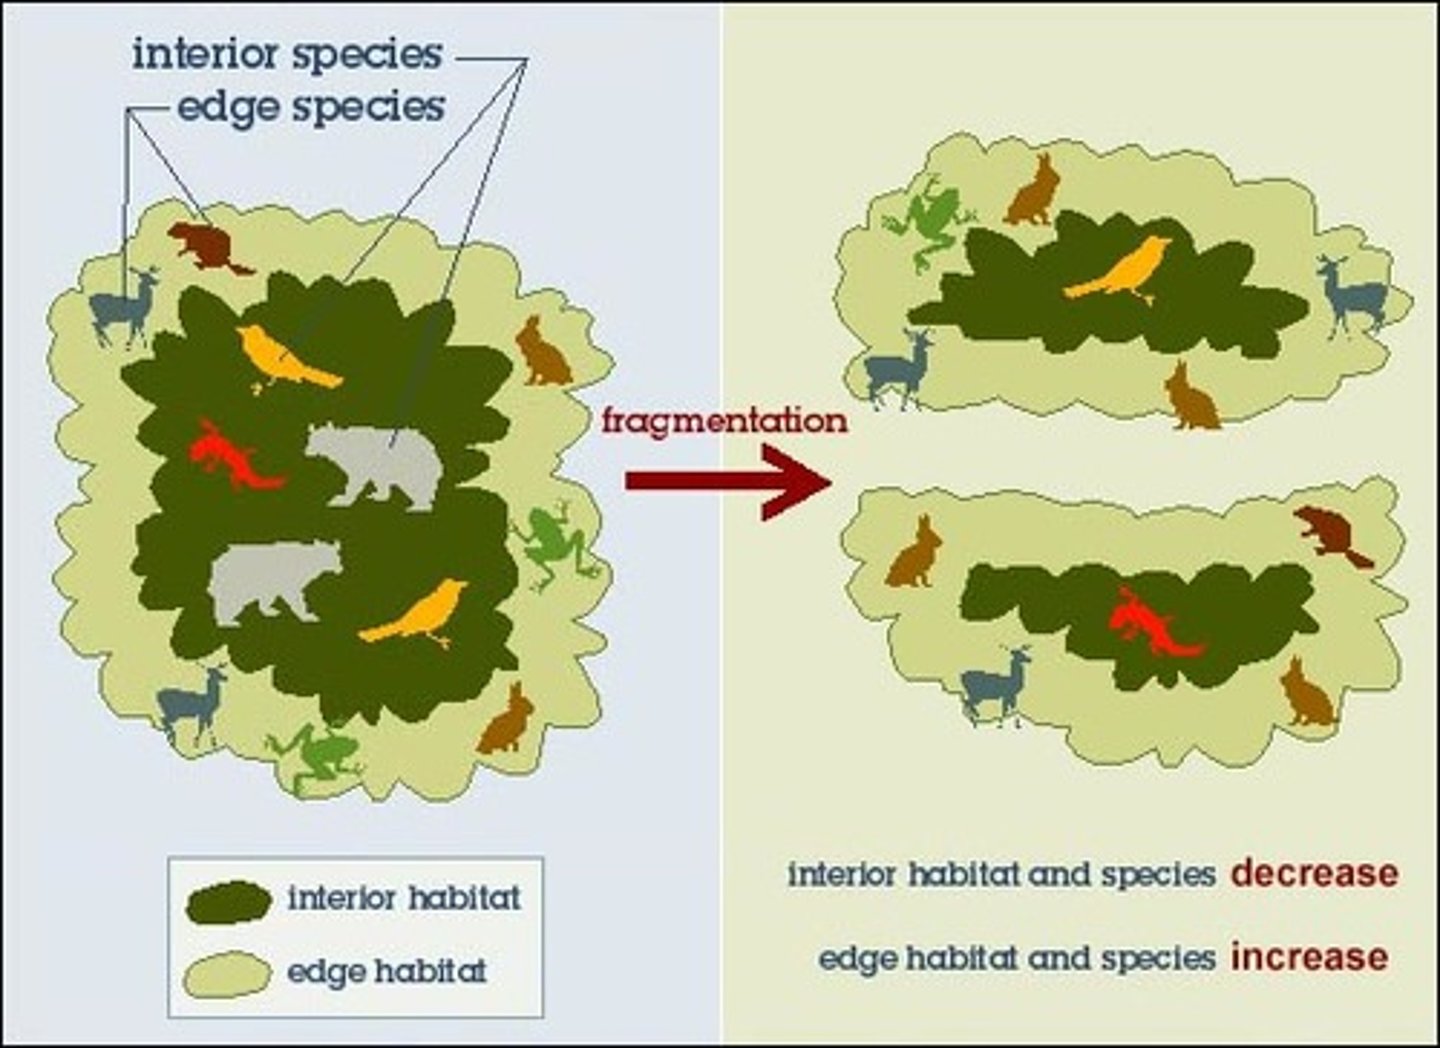
Habitat Fragmentation
Extinction is often greatest if habitat is fragmented and unconnected
Connectivity (corridors) allows species to move between patches of habitat and prevent buffer extinction