One-Way ANOVA
 Call Kai
 Learn
Learn Practice Test
 Spaced Repetition
 Match
Match Flashcards
 Knowt Play
1/19

There's no tags or description
Looks like no tags are added yet.
Name | Mastery | Learn | Test | Matching | Spaced | Call with Kai | Chat |
|---|
No analytics yet
Send a link to your students to track their progress
20 Terms
ANOVA Definition
A one way analysis of variance is a statistical test used to compare any statistically significant differences between the means of three or more independent groups.
Factor - the independent (predictor, what you compare/change) variable (type of therapy)
Levels - the different groups within a factor (exposure therapy, psychodynamic, no therapy, etc.)
Assumptions of Null Hypothesis Significance Testing (NHST)
Independent – participants don't influence each other.
Normal – data are roughly bell-shaped.
Equal variance – groups have similar spread.
The study's methods are precise and valid
The null (H₀) and research hypotheses (H₁) completes the sample space (covers all possible outcomes)
Data Wrangling
Before you collect data:
Cleaning
Renaming variables so they are clear
Remove invalid/poor quality responses (participants who weren't paying attention)
Scoring
Create new variables from the raw data, like average reaction time
Checking
Look for/remove outliers if needed
One-way ANOVA
Used when there is 1 factor
Example: comparing different therapy types
If the factor has:
2 levels → Use a t-test or ANOVA (same result).
Example: CBT vs No Therapy
More than 2 levels → Use a one-way ANOVA.
Example: CBT vs Exposure Therapy vs Psychodynamic Therapy vs No Therapy
Factorial ANOVA
Used when there are 2 or more factors
Example:
Factor 1: Type of therapy
Factor 2: Age group
Experimental Factors
The researcher assigns people to groups (giving different therapies to different people), detects cause and effect conclusions
Observational Factors
Does not assign groups, they just observe existing differences (age, gender, ethnicity), only show relationship
Qualitative Factors
Categories with no order; brand, gender, type of therapy
Quantitative Factors
Numbers that can be ordered; age, drug dosage (numerical)
Treatment
A specific experimental condition, determined by factors/levels. A design is balanced if each treatment is repeated the same number of times (same number of participants per condition).
Comparing of Means
ANOVA compares group means without assuming a specific pattern or relationship between the groups.
Some statistical methods assume groups follow a logical order or trend
Example: increasing dose → increasing effect
But ANOVA does NOT assume that
It treats groups as separate categories
Example: CBT vs medication vs no treatment
Omnibus Test
Checks if there is at least one difference among the group means helping control error and deciding whether further comparisons are needed.
If it's statistically significant, researchers do additional tests (post hoc to find which group differs)
It does not tell you which groups are different.
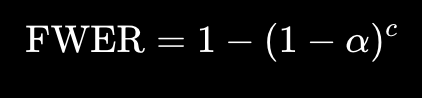
Familywise Error Rate (FWER)
The chance of making at least one false positive (Type I error) when you run multiple hypothesis tests on the same data.
Each test has a small chance of a false positive (e.g., α = 0.05)
If you run many tests, those chances add up
So the overall risk of a false alarm (saying smt’s there but it’s not) increases
This is called:
Alpha inflation
Cumulative Type I error
α = significance level (e.g., 0.05)
c = number of comparisons (e.g., 3 tests
How Does ANOVA Work
Very similar to a t-test, except it compares 3 or more groups.
State hypotheses and choose significance level
Specify data handling practices (how you'll clean data, score variables, and handle outliers)
Collect data
Check assumptions - independent, normal distribution, homogeneity of variance (equal variance)
Run the ANOVA - calculate the F-statistic and p-value
Reject/retain hypothesis and if the ANOVA is significant, perform post hoc tests
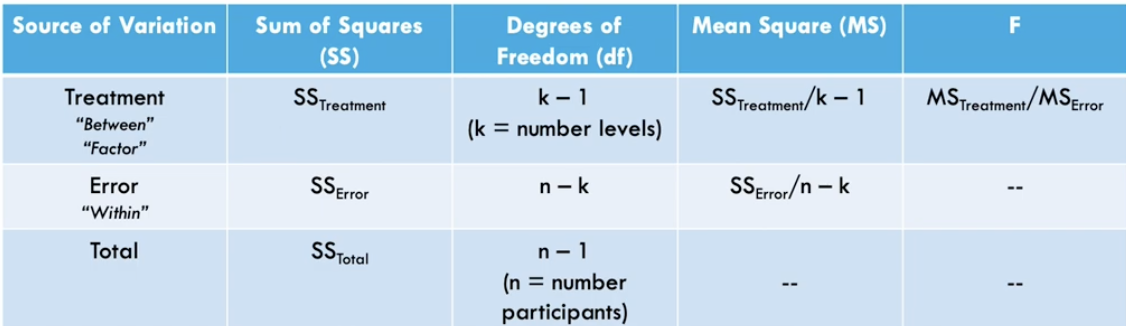
ANOVA Table
The ANOVA table separates variation into between-group and within-group variation, then uses the F-statistic to test whether the group means differ. (Read more in notes)
F-Statistic
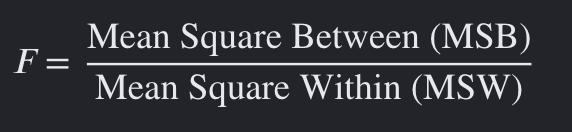
Compares signal vs noise
If F ≈ 1:
groups are similar (no real difference)
If F is large:
group differences are bigger than random variation → likely real effect
ANOVA Assumptions
Independence - observations don’t influence each other
Normality using Shapiro-Wilk test - fail to reject H0 = met
Homogeneity of Variance using Levene’s test - similar spread
For both two and three, we wish to fail to reject (retain) the null hypothesis.
Planned Comparisons
Chosen before collecting data, based on a specific hypothesis, fewer comparisons
This is when omnibus test is significant (at least one group is different but doesn’t know which)
Example: Compare CBT vs no treatment only
Post-Hoc Tests
Chosen after seeing a significance, explore which groups differ, compare all/many possible pairs
Example: A vs B, A vs C, B vs C, etc.
Outliers and Invalid Data
t-tests and ANOVA are sensitive to outliers
Outliers are values more than ±3 standard deviations from the mean
Researchers can remove them before data collection
Caused by: not following instructions, random responding, giving the same response repeatedly (invariant responding), etc.