The Present LECTURE 2
1/37
There's no tags or description
Looks like no tags are added yet.
Name | Mastery | Learn | Test | Matching | Spaced |
|---|
No study sessions yet.
38 Terms
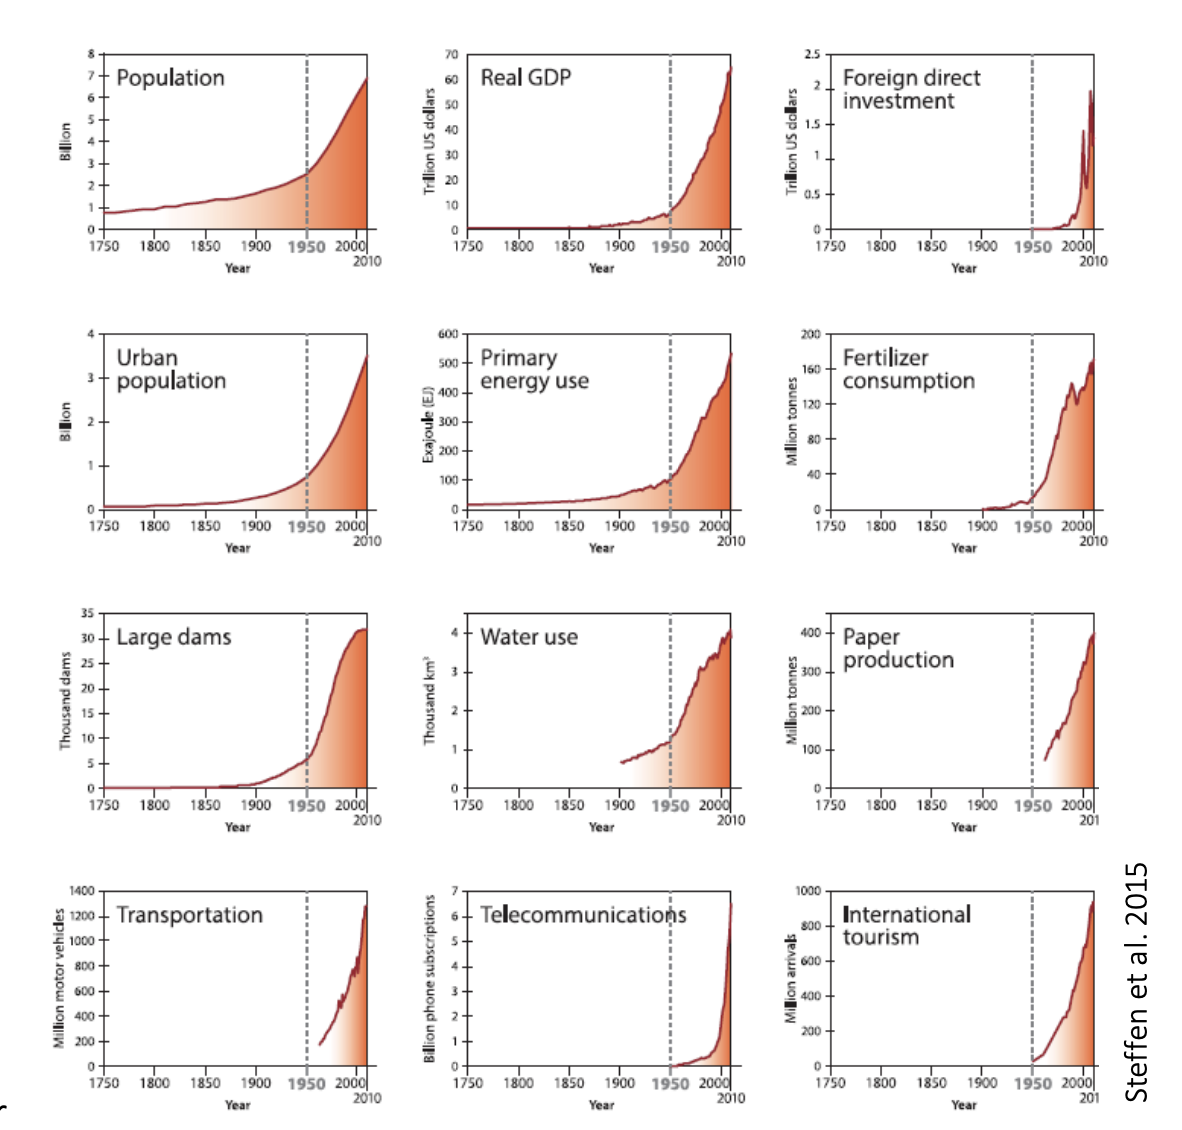
The Great acceleration
After WW2 Many things increased
population
economy
scale of farming
transport
communication
Reasons for this
Restructuring the global economy around principle of growth
adoption and further dev of wartime technological innovation
strategic R+ D partnerships across governement, industry and achademia
Effects of the population tripling
>50% of useable land for food production
25% of all available net primary production
Responable for global N fixation
Increased atmospheric CO2 to its highest level for at least 14My
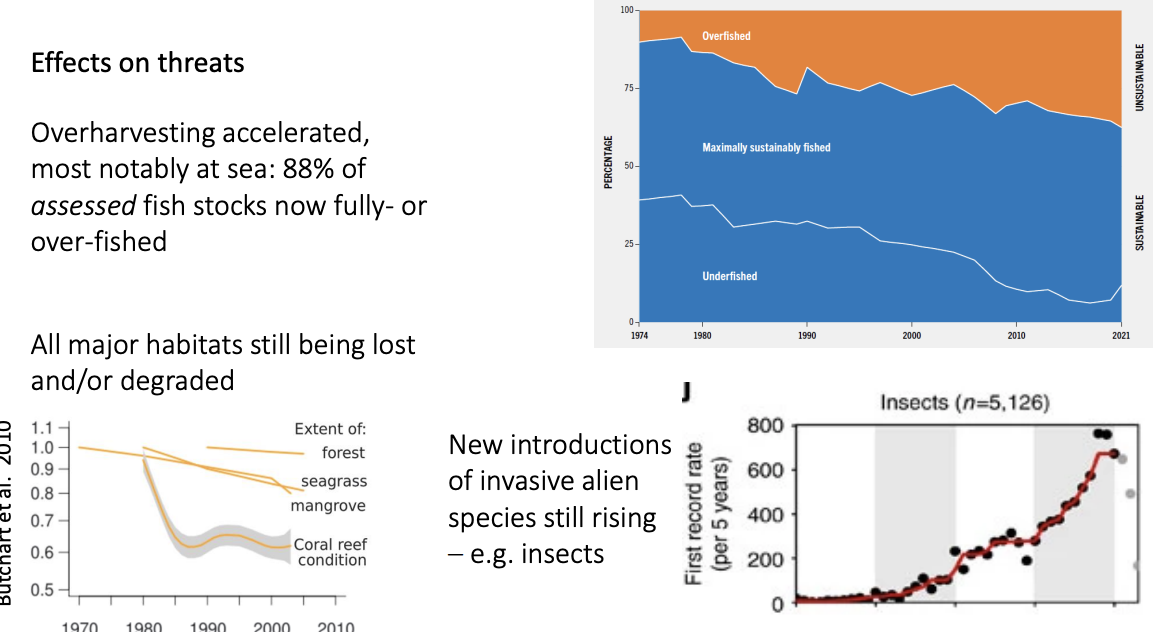
Effects of threats→ Main threats
Habitat loss (the worst)
coral reefs
Overharvesting
88% of fish stock overharvested
Invasive species
e.g insects
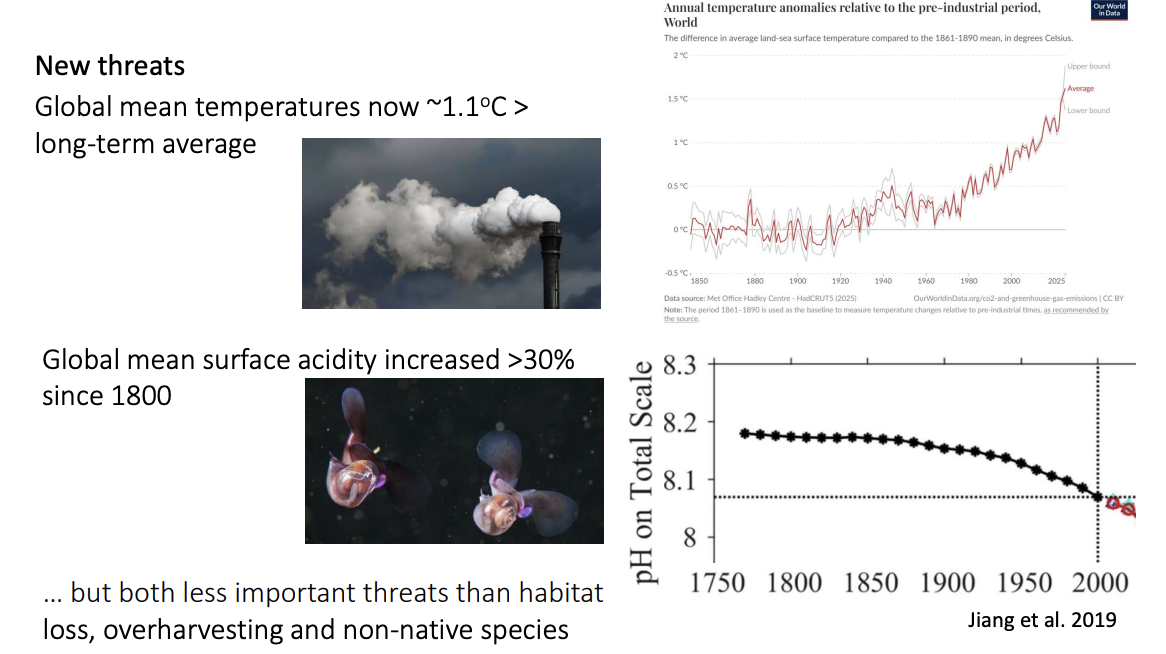
Effects on threats→ New threats
Climate change
1.1 degrees above pre industrial
ocean acidification
>30% increase since 1800
coral reef cannot built skeletons
But less important than longer-established threats
Interactions of threats e.g roads
Habitat fragmentation
Direct mortality
Invasive species corridors
Spread of fire
Reduce habitat quaility around the edges (poolution, microclimate change)
Catalyse human settlement
5 main signals of these impacts on biodiversity
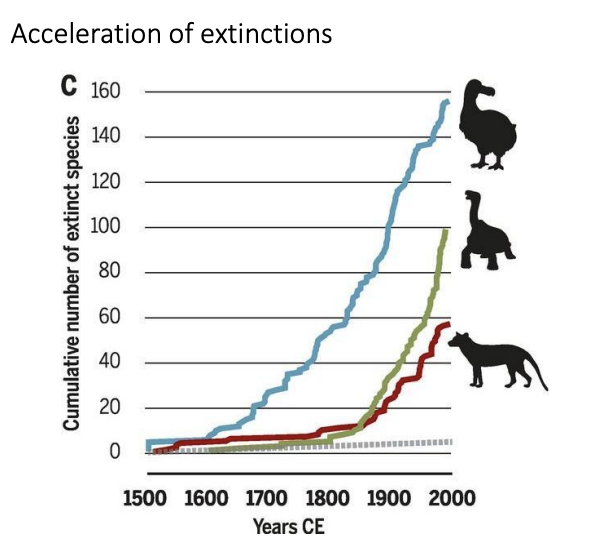
Increased rats of extinction
Variation in levels of threat
More general reductions in population sizes
Widespread disruption of ecological processes
Changes in community composition
Increased rats of extinction
incresing numbers of specires threatened with extinction
Variation in levels of threat
Taonomically
e.g amphibians hard hit
Body size
larger bodied and plants impacted
By realm
Freshwater species in greatest decline
Geographically
highest in SE Asia (dense, fast growing populations and strong economic growth
Australia→ marked suscpetibility to invasives
More general reductions in population sizes
General reductions in vertebrates and invertebrates
75% loss of vertebrates
HOWEVER: there is always up and down
but declines observed too great to be explained by natural fluctations of initially abundance populations
Widespread disruption of ecological processes
very many of which vary with species’ abundance
Changes in community composition
increases in abundance of wide-ranging winner species
declines in narrowly-distributed loser species
→ replacement explains why in some analyses site level species richness is maintained
despite regional and global declines in richness
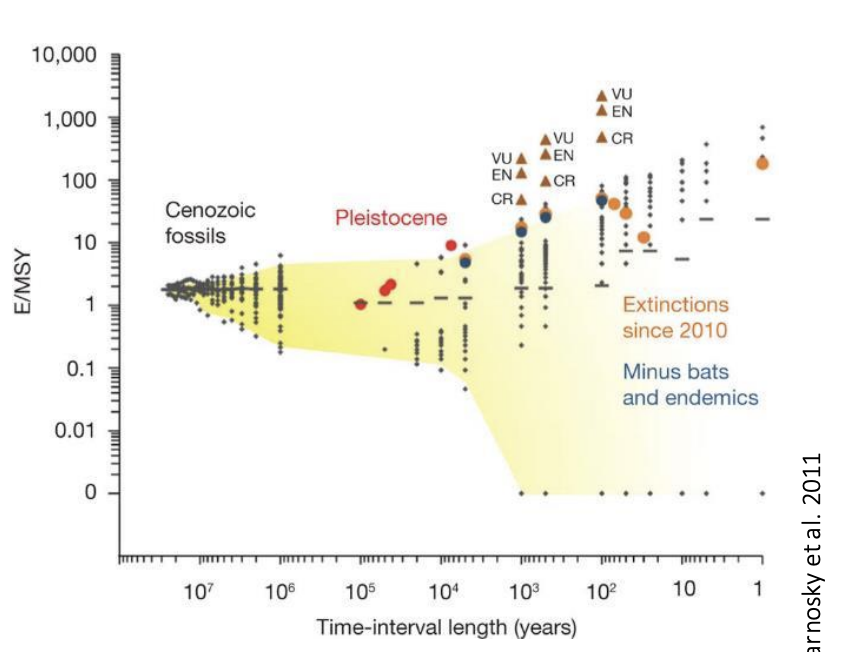
Is this a 6th mass extinction?
Might be close…
Extinction rates lie at the upper bound of interval-adjusted estimates of back ground rates
Predictions of impending extinction rates→ WAY larger than background rates
Magnitute of likely loss iwth be around 75% level seen in Big 5 events
(Assuming currently threatened species become extinct in the medium term)
Note: Impacts of mass extinctions on ecoystem functioning may take tens of thousand of years to unfold
Are we entering the Anthropocene?
Human activities now rival the great forces of nature
-Some reject
-Some accept that this may be an event→ a time of unprecedented human transformatoin f the planet
Conservation responses over the past 75 years
Environmental laws and agreements
Conservation NGOs and IGOs
Protected area
Habitat management
Species management
Environmental laws and agreements
e.g 1992 Convention on Biological Diversity
restricting damaging activitires
enabling conservation actions
Conservation NGOs and IGOs
Non and inter governmental organisation
act on ground, raise public awareness, loby decision makers and help deliver international agreements
Proteected areas and OECMS
other effective area-basedd Conservation Measures
coverage increased recently
came close to reaching CBD’s 2020 targets of 17% of the land and 10% of the seas
Habitat managment
remove threats
invasive rats and goats
maintain or restore ecological communities
impacted by the loss of natural distrubance agent such as flood and large herbivores
Spceis management
target at particular threatened species
making harvesting regimes more sustainable
e.g the MSC fish sustainable
e.g Gorilla
Case study 1: Whales Facts
resumed after WW2
increased to smaller bodied spcies as stocks of biggests species depleted
1980s→ >3M whales has been caught since 1800
recued population by 66-90%
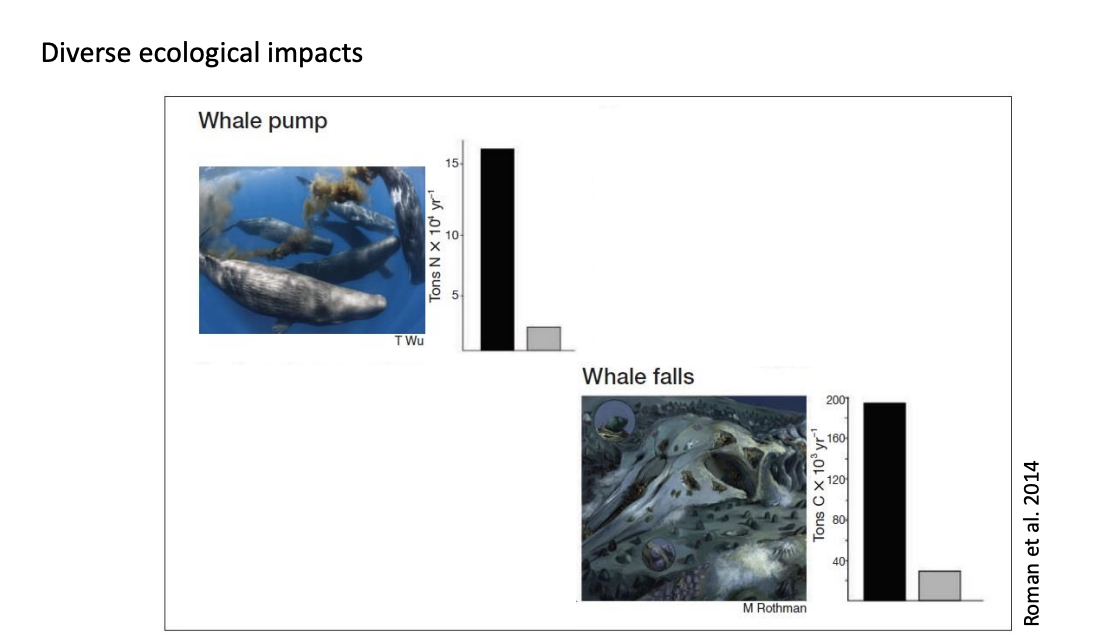
Impacts of depletion: Ecological impacts
reductions in tansport of N, Fe and other nutrients into euphotic zone
reductions in whale falls
desiment suspecion reduction
shifts inp redation as whale specialised killer whales witch the smaller marine mammals
Changes in Management
International Whaling Commission
agrred to continue whaling
But in 1986 led to banning
Objectsions→ Japan, Iceland and Norway wontinued
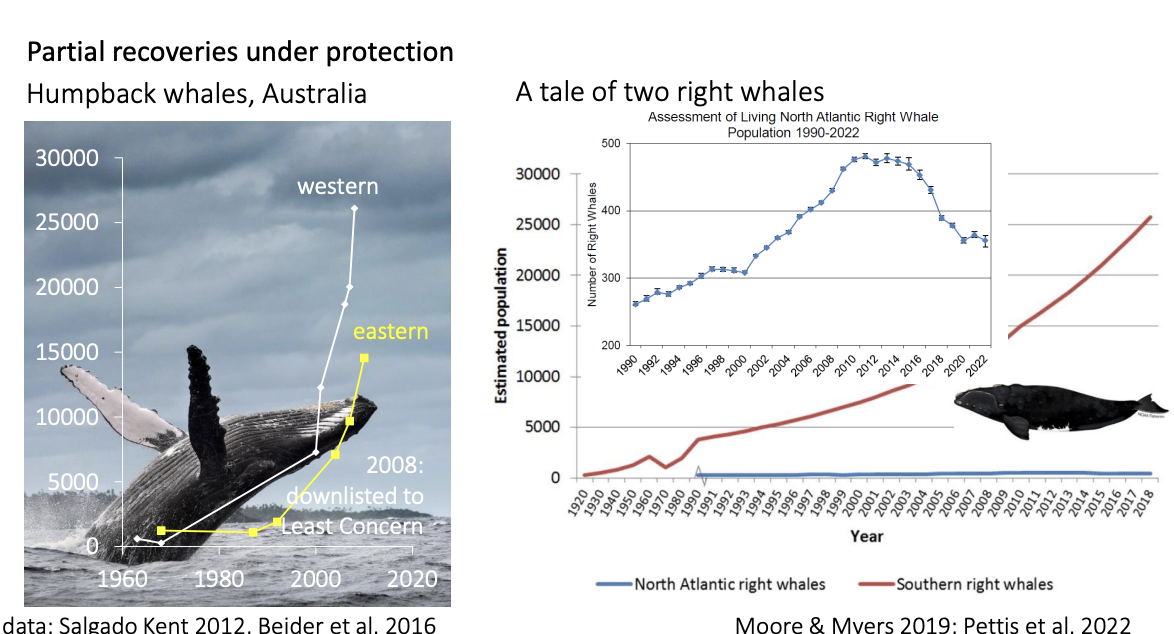
Recovery?
some populations have rebounded
southern rights, humpback, gry and blue
Some have not
North Atlantic right whales
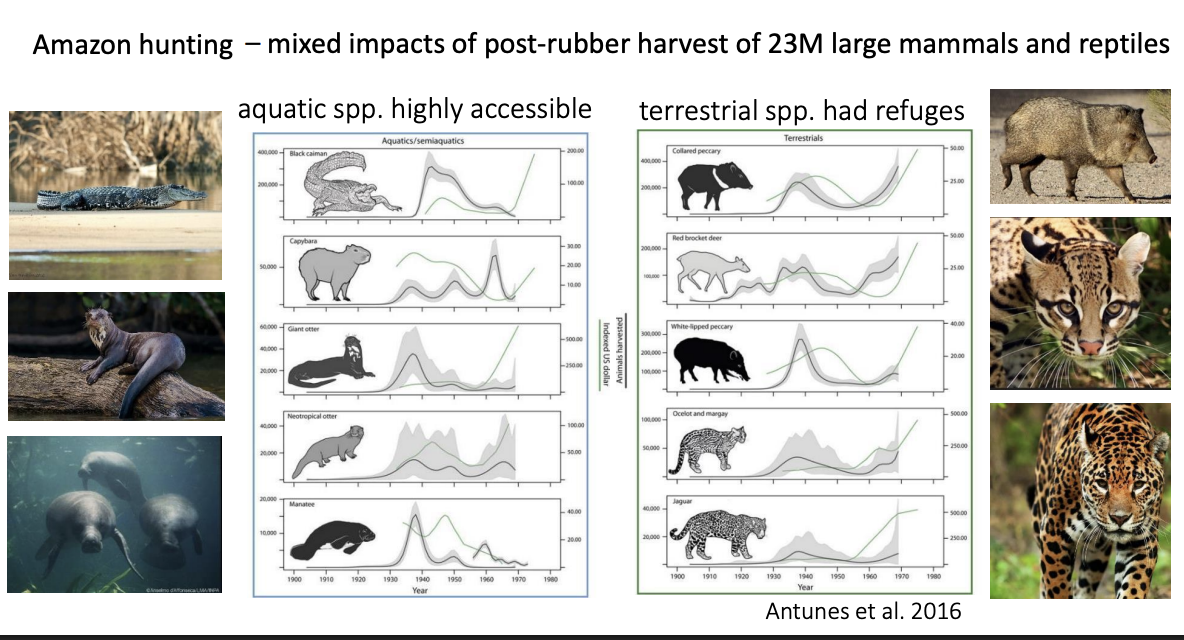
Case Study 2: Amazon Facts
Collapse of rubber boom
shift to commercial exploitation of animal skins
>23M skins shipped out of Brazillian Amazon over the 20th century
Impacts
Species
Aquatic species severely hit as they were accessible by river
REALLY hit by first offtake
still low by the second
Terrestrial→ Less accessible from the river
Recovered after the first wave
(note: this is important in understanding which species are better suited for change→ important in conservation)
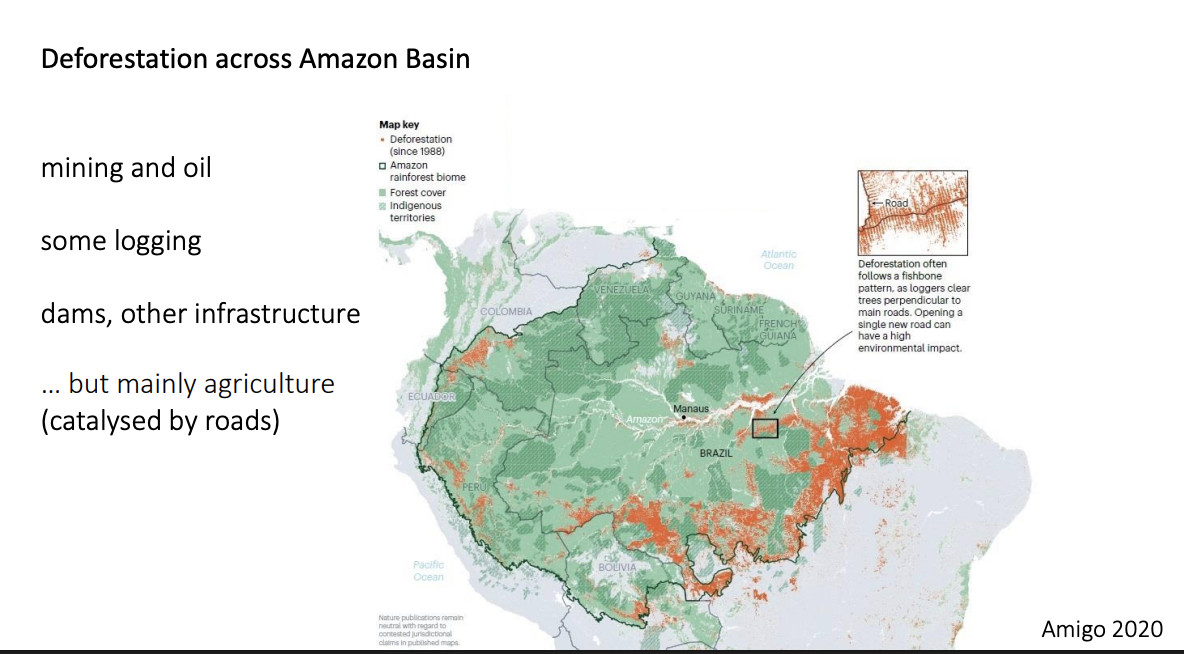
Habitat loss→ deforestation in 2nd half of the century
mineral, logging and infrastructure
MAINLY agriculture
AND in the remaining forests→ droughts and fires increased in freuqnecy
What has the clearance of land (deforestation) been driven by
domestic demand of land
but also
global markets:
Cattle ranching and soy production
driven by the rising pig production in China and he EU ban on pigswill
What happened between 2005-2012?
Dramatic decline in deforestation
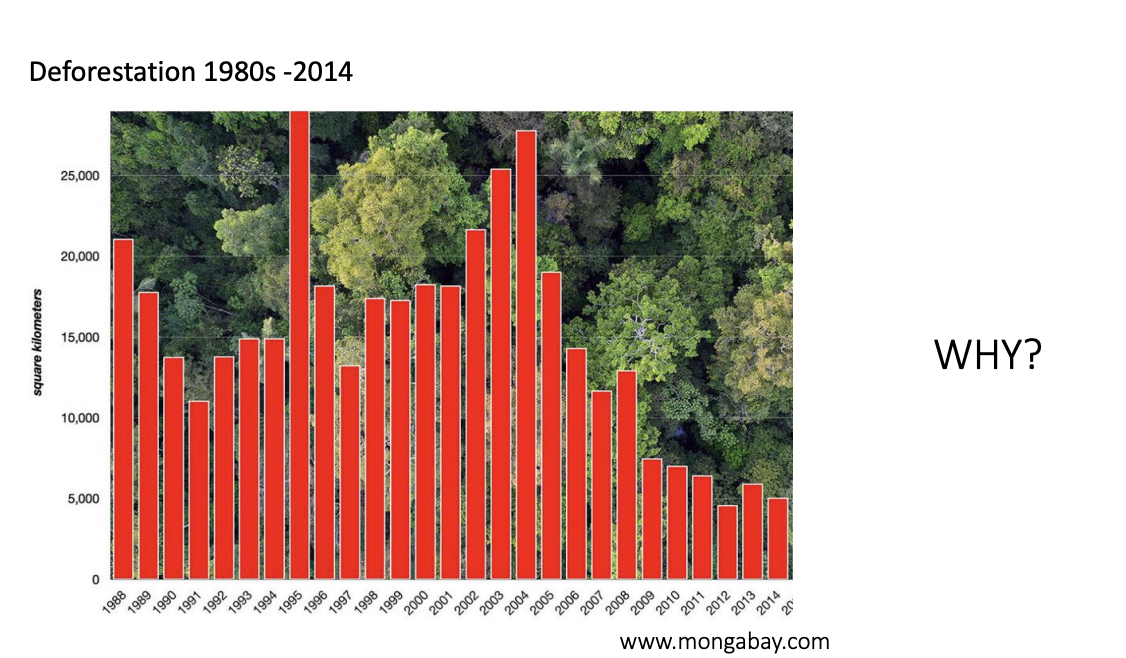
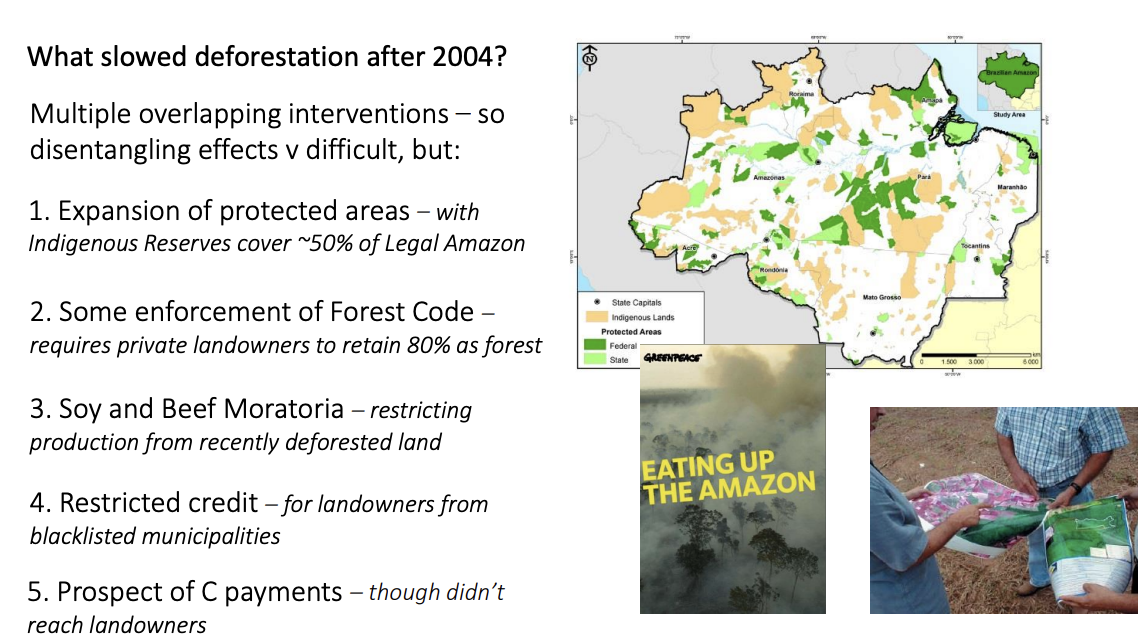
What caused the decline in deforestation from 2004?
Expansion of protected areas
Expansion of indinefous reserves
Increased enforcement of Forest Code
e.f 80% forest retention on private land
Buyers moratoia on soy and beef originaing on recently deforested land
Restrictied access to credit for landowner from blacklisted municipalities
Prospect of significant carbon payments
All implementated at the same time→ do not know which factor helped the most
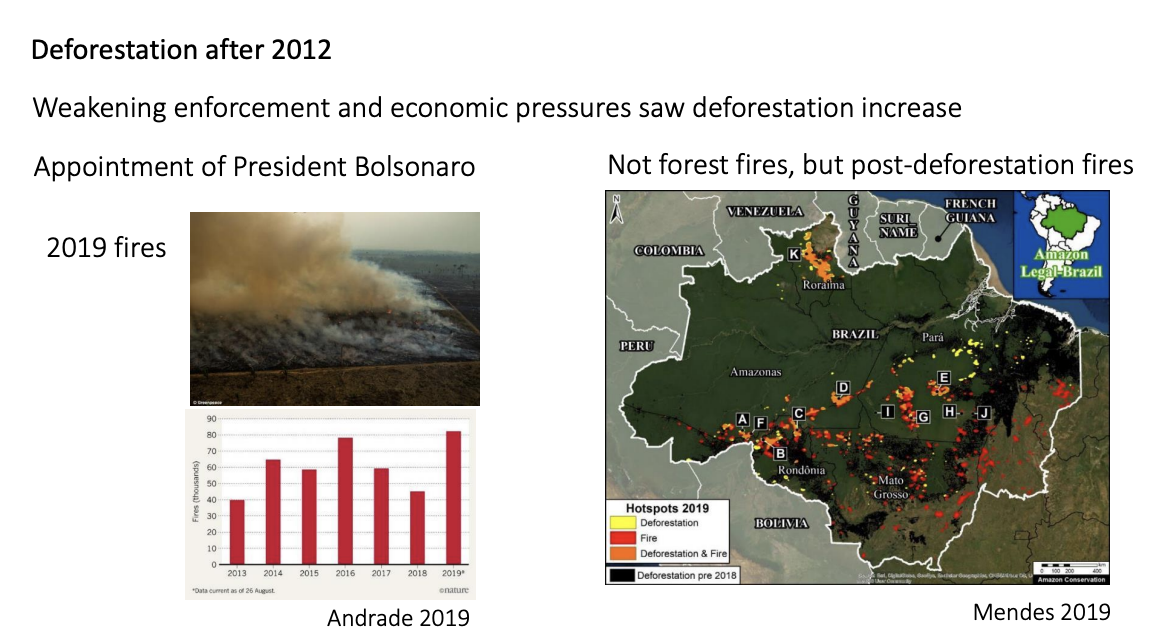
What happened in 2012?
Pattern reversed→ governement relaxed enforcement of regulations
Highest level of deforestation since 2006
Why did this happen
Relaxed government
recession
falling currency
China-US trade wars
2019 Jair Bolsonaro→
further appeasement of landowners
rise in illegal activitires in protected areas
reverse legal protection
Aug 2019 non-drought fires
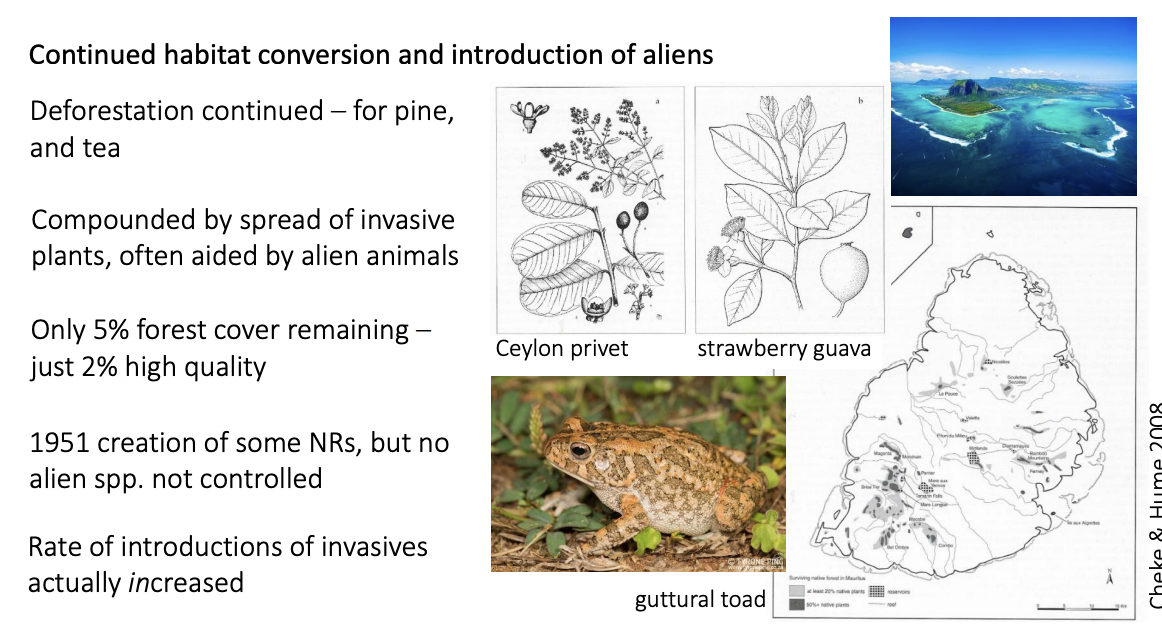
Case Study 3: Mauritius
deforestation continued through the 20th century
pine and tea
Suffer from further invasive species
often used to control existing invasive mammals
e.g pigs dispersing strawberry guava
Early nature reserves
Catchment management
Viewing some invasives (deer, guava) as assets
Rate of invasive species introductions increased
Due to this poor management→ impact
5% of the original forest reamined at the end of the century
2% in good condition
28 endemic plants now <10 individuals in the wild
BUT: work of Carl Jones in the 1970s
Stimulated growting internationla and national concern
Interventions to reverse the fortunes of many species
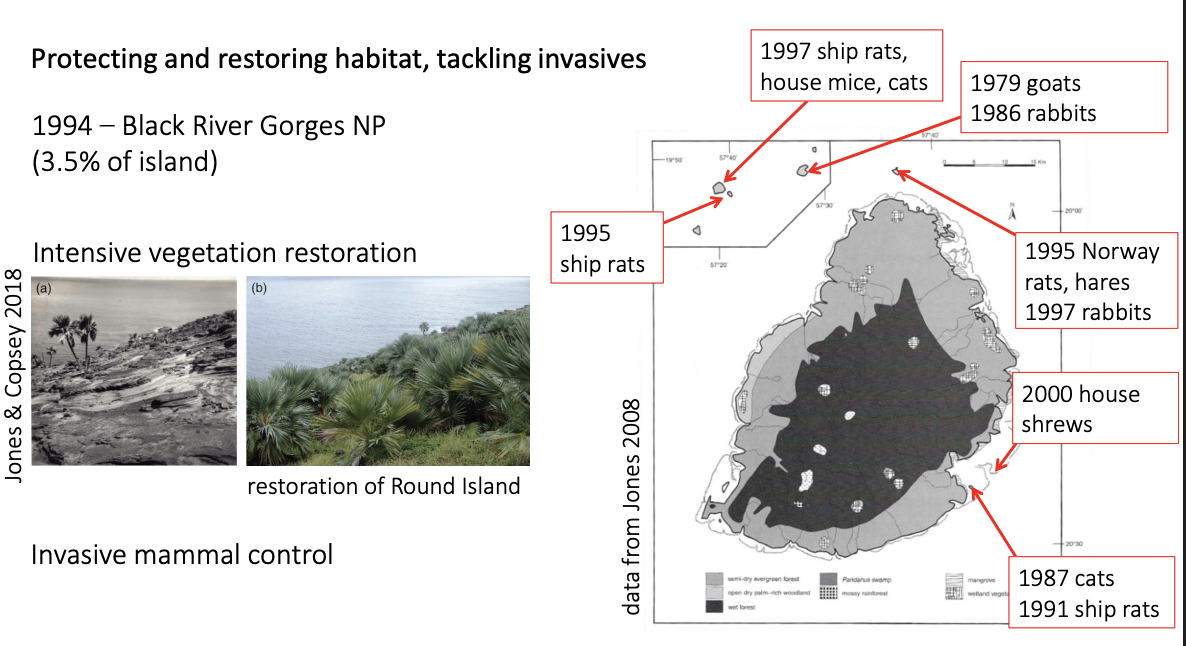
Creatin of Black River Gorges NP
largest national park in Maauritius
Intesnive restoration of vegetation
weeding, native planting and exclusion (by fencing and culling) of invasive mammals
Elimination of invasive mammals on islets
enable bird and reptile reintroductions
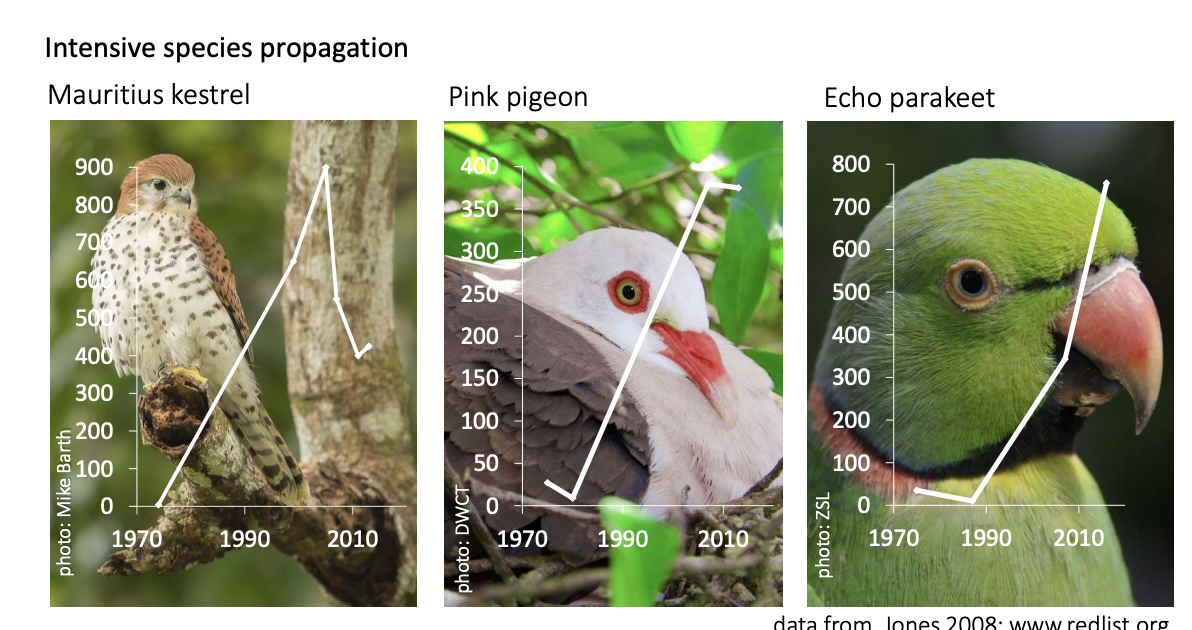
Intensive progagtion of critically endangered species
Intensive progagtion of critically endangered species
predator control
provision of supplementary food and nest sites
removal of eggs (for capture rearing)
so parents lay again (double-clutching)
Reintroductions of captive-bred birds:
Kestrels, pink pigeons and echo parakeets
now in their hundreds
Carl Jones 2008
“At the start of this work, the future of the endemic species of Mauritius seemed bleak, and many thought that few could be saved from extinction. Thirty years later the long -term conservation of all the island’s endemics is within our grasp.”