Fig 6.3: Is the rate of change (in individuals) constant? Does this represent linear, exponential, or logistic growth?
1/5
There's no tags or description
Looks like no tags are added yet.
Name | Mastery | Learn | Test | Matching | Spaced |
|---|
No study sessions yet.
6 Terms
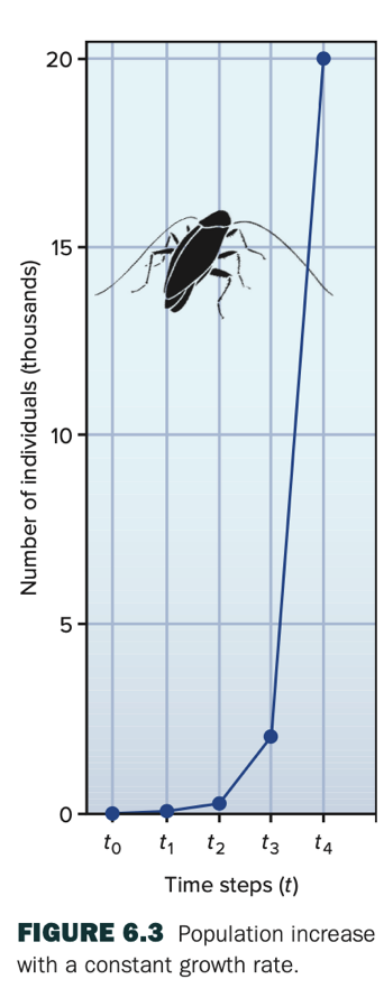
Fig 6.3: Is the rate of change (in individuals) constant? Does this represent linear,
exponential, or logistic growth?
it is not constant as the number increases with time. represents exponential growth.
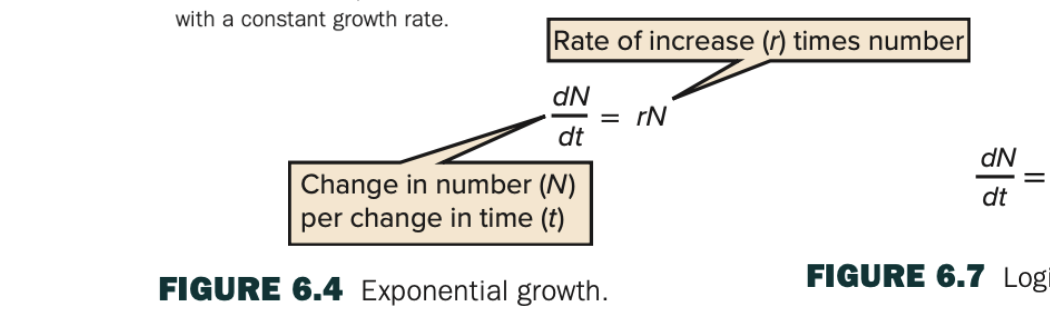
Fig 6.4: What happens to the population size if r > 0, r < 0, and r = 0? Explain all three scenarios.
if r>0 then the growth rate it positive, r<0 growth rate is negative. r=0 no growth rate.
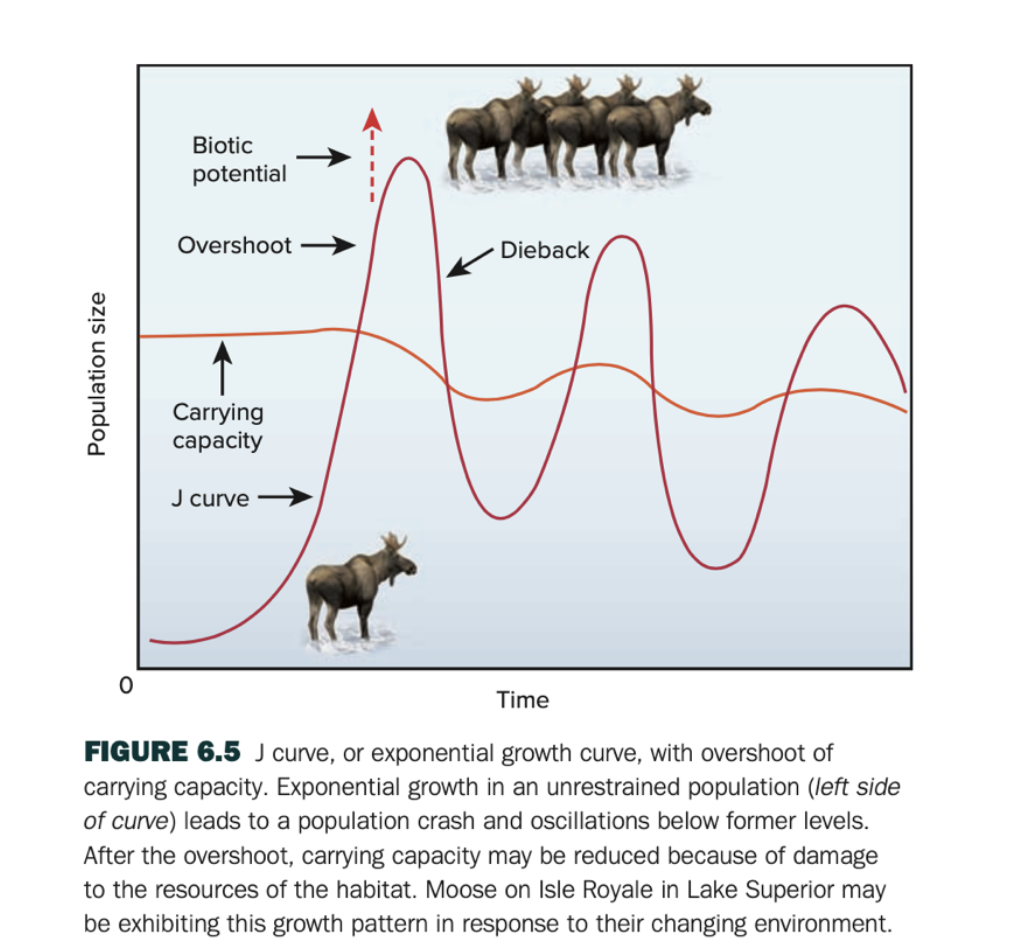
Fig 6.5: What happens to the carrying capacity in this graph and why?
it shows how the population grows rapidly, overshoots, and then experiences dieback. this happens because the pop exceeds the resources available.
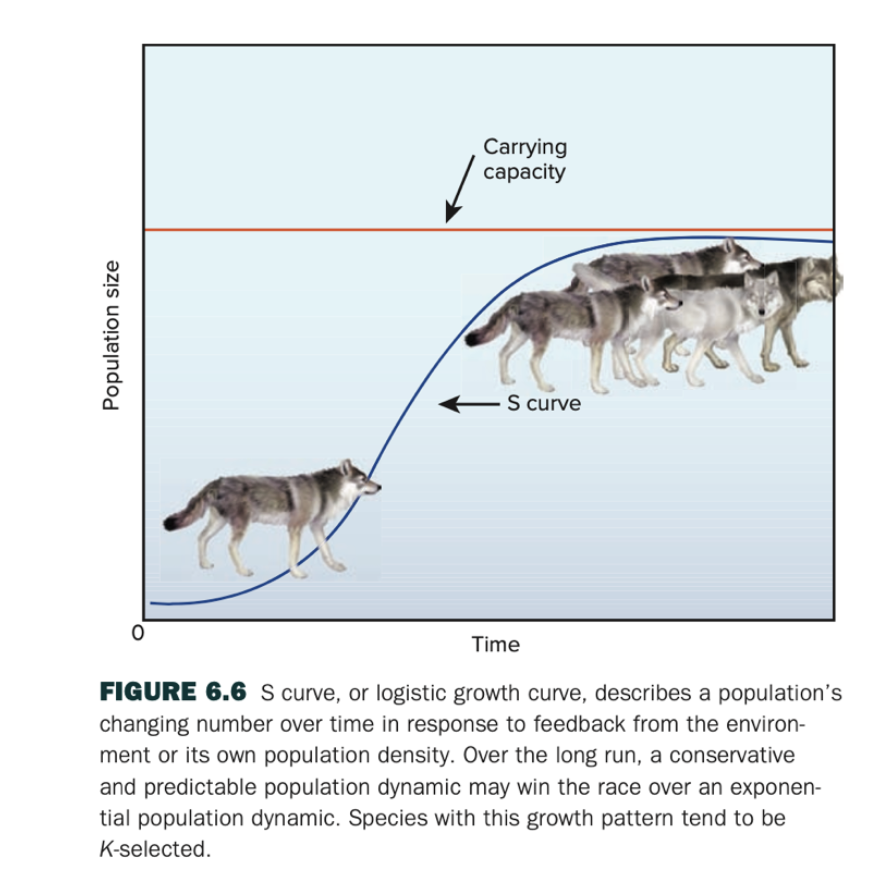
Fig 6.6: What’s another species that exhibits this growth pattern and why?
reindeer on st paul island started with a increase then stabilized making a shaped curve. because it has reached the carrying capacity for the environment.
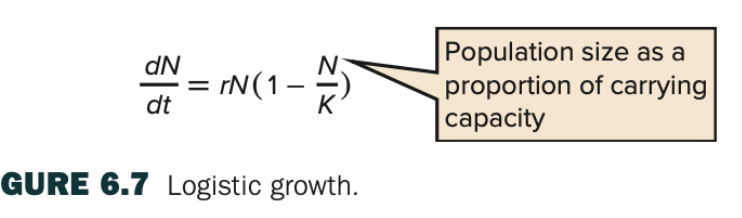
Fig 6.7: How is logistic growth different from exponential growth? What happens when
N < K, N = K, and N > K? Explain all three scenarios.
logistic growth considers a carrying capacity. N<k means that it grows as it has not reached carrying capacity. n=k means it stays the same. N>K there is a decline as it has past carrying capacity.
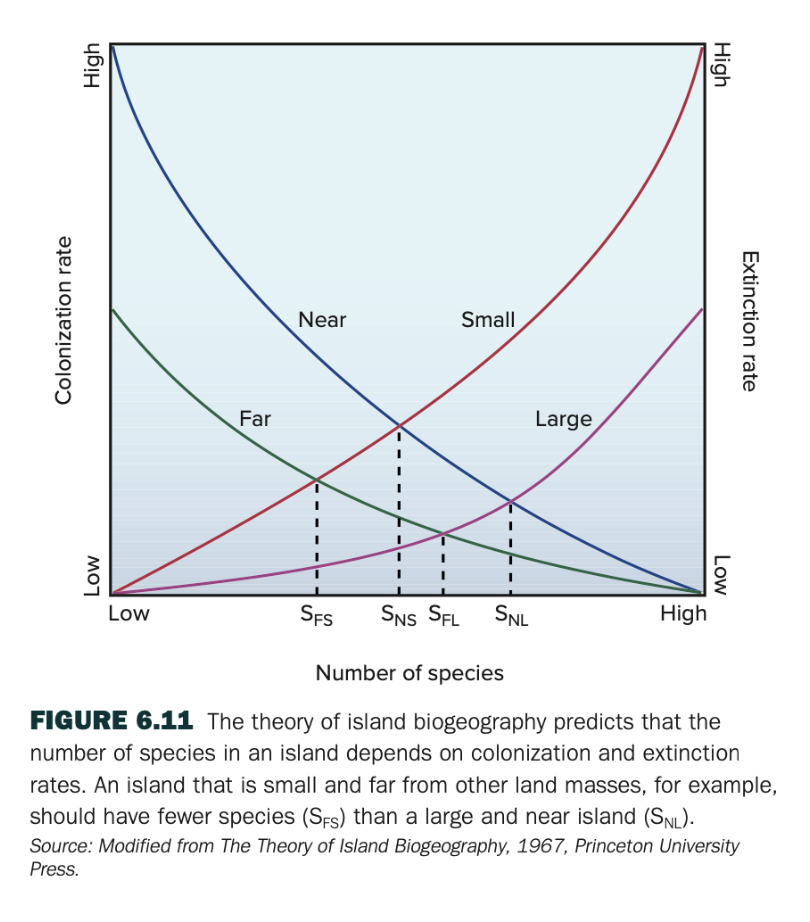
Fig 6.11: How do the number of species compare on small and near islands compared to
far and large islands? Do colonization rates depend on proximity or size?
the number of species is higher on larger and nearer islands. colonication rayes depend on bother proximity and size.