APES Exam Review
1/75
Earn XP
Description and Tags
Over Unit 6, Unit 7, & Unit 9
Name | Mastery | Learn | Test | Matching | Spaced |
|---|
No study sessions yet.
76 Terms
Order of Ecology
organism → population → community → ecosystem → biosphere
Organism
individual living thing
Population
group of individuals of same species living together/interacting
Community
several populations of different organisms living & interacting with each other
Ecosystem
communities of organisms interacting with each other & nonliving environment
Biosphere
areas of Earth where life exists
Population dynamics/ecology
study of how populations can increase or decrease in size
You determine population dynamics
Size, Density, Distribution, Sex ratio, Age structure
Size (N)
number of individuals
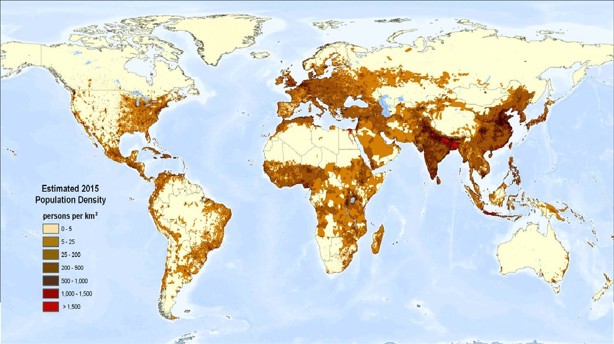
Density
number of individuals in a given area
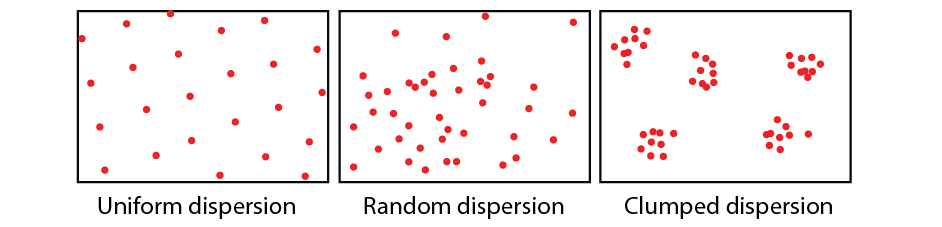
Distribution
how individuals are spread out over their area
Distribution forms
Random, uniform, or clumped
Sex ratio
ratio of males to females
Age structure
number of individuals that are in different age categories
3 major Age structure categories
pre-reproductive, reproductive, post reproductive
Limiting Factor
resources that population cannot live without; exists at lower levels than needed for population to increase
Examples of limiting factors
For animals: food & water. For plants: soil, light, water
Carrying capacity (K)
The maximum population of a species that an area can maintain indefinitely
Dependent on limiting factors
The population growth rate often decreases as population size approaches K

Density-dependent population controls
Effect on population varies based on density of population
Eg. disease: will affect dense populations more; Food availability
Density-independent population controls
Affect populations the same regardless of its density
Eg Temperature, natural disasters, pollution
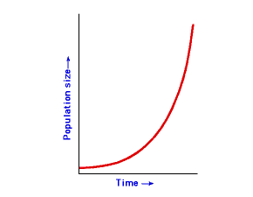
Intrinsic growth rate (r)
Maximum growth rate of population under ideal conditions
High births, few deaths
With high r and ideal conditions, can see exponential growth
Forms J-shaped curve in graph

Logistic growth
Exponential growth followed by decrease in growth and then leveling off of population near K
Due to limiting factors
S-shaped curve
Overshoot- when population increases past K
Can then experience die off/collapse

K-selected species
Have a low r (Intrinsic growth rate)
Larger organisms reproduce later in life, few (but large) offspring, have a long life span, mature slowly, high levels of parental care
K-selected mammals- longer gestation period
Population levels off as it approaches K– follows logistic curve
More prone to extinction
Eg elephants, humans, whales, raptors, sharks, some plants
r-selected species
Have a high r
Small organisms, have many small offspring, little or no parental care, mature quickly
Tend to be opportunists – reproduce and spread rapidly when conditions are ideal or niche opens up
Go through boom and bust cycles- overshoot K followed by die-off
Eg rats, insects, algae, bacteria
Survivorship curve
Show patterns of survival of species over their lifetime

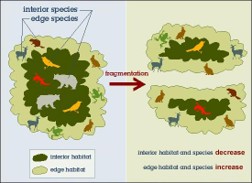
Habitat islands-
isolated habitats (often containing populations) surrounded by human settlement/activity
Often caused by habitat fragmentation
Can lead to changes in species diversity, genetic diversity (inbreeding)
Inbreeding depression
Inbreeding depression
lowering fitness (how well they survive and reproduce) of a population through the mating of genetically similar individuals (often relatives)
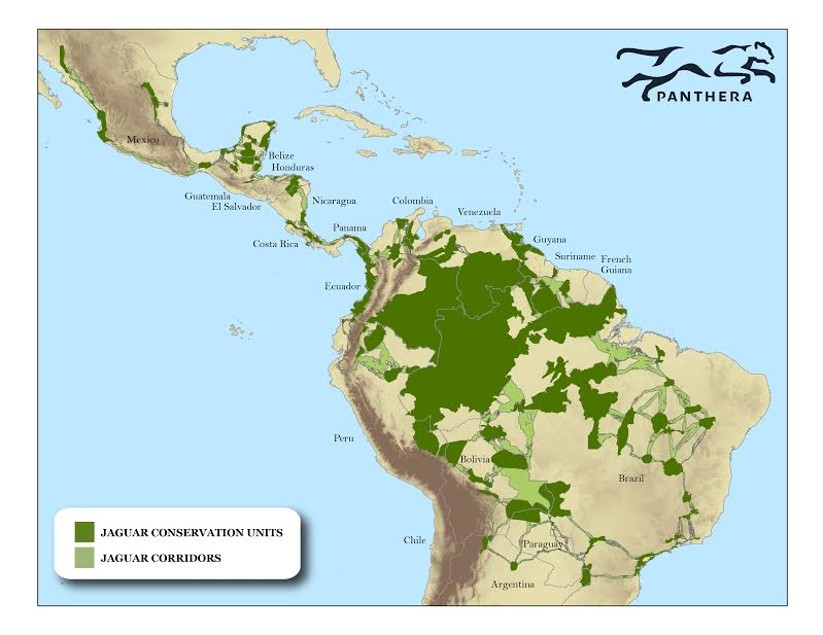
Habitat/wildlife corridors
can connect isolated habitats
Can be natural or manmade
E.g., Jaguar corridor initiative
Can increase diversity, reduce inbreeding
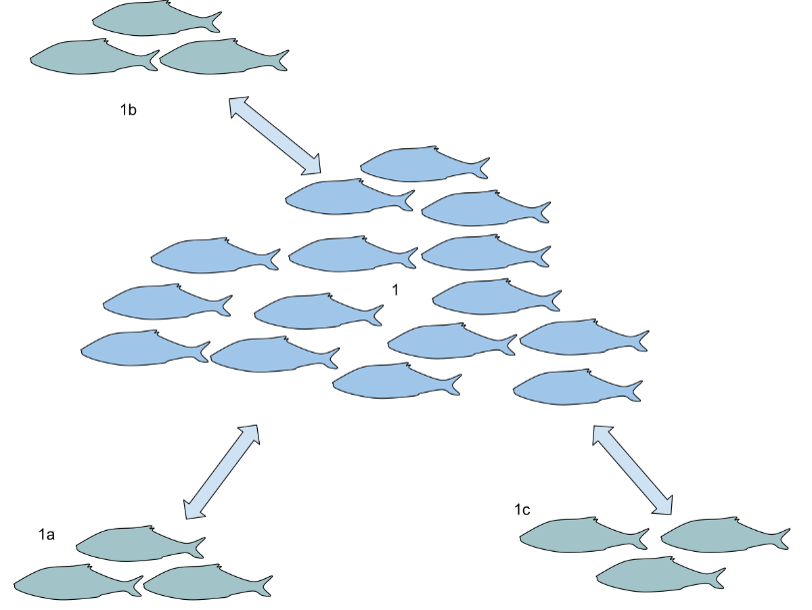
Metapopulation
Metapopulation
separated populations that are occasionally connected by species movement
Interspecific competition
competition for limited resources between different species
Eg food, water, light, space
Competitive exclusion principle
No two species can occupy exactly the same niche
Resource partitioning (aka niche differentiation)
Competitive exclusion principle
species competing for same resources cannot coexist
No two species can occupy exactly the same niche
Niche
the specific functional role and position a species has within its ecosystem, encompassing all the physical, chemical, and biological factors it requires to survive and reproduce
Resource partitioning (aka niche differentiation)
species evolve (eg change behavior, morphology) to reduce niche overlapping /competition
Predation
When one animal kills and consumes another
Prey have evolved ways to avoid predation:
Physical, Chemical, & Behavioral
Ways Prey have evolved to avoid predation:
Physical:
Camouflage, acute senses (smell, sight, etc.), speed, physical protection (eg, spines, thorns), aposematic (warning) coloration, mimicry
Chemical
oBad tastes/odor, irritating defenses (eg, skunk), poisonous to consume
Behavioral:
oClumping behavior (herding, schooling)
Parasitism
When a species lives on or in another and causes it harm
Feeds on, uses the energy of another organism
A parasite is usually smaller and often does not kill the host
Pathogen
Pathogen
organism that causes disease in host
Eg Many types of bacteria & viruses
Herbivory
When consumer feeds on a producer
Usually only eat part of producer without killing whole organism

Mutualism
Species interaction in which both species benefit
Survival and reproduction chances of both improve
Most species involved in some kind(s) of mutualism

Commensalism
Species interaction where one species benefits, other is not benefitted or harmed


Keystone species
Species that has large effects on its ecosystem
Organism is usually not very abundan
Types of keystone species:
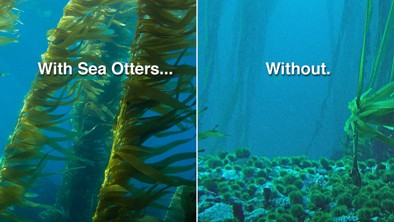
Predators: Eg, gray wolf, jaguar, sea otter
Foundation species: E.g. grizzly bear, beaver, prairie dog, elephants
Predators
keep populations of prey species lower → can benefit other species
Top Predators are a type of keystone species because they cause the trophic cascade to happen
Eg gray wolf, jaguar, sea otter
Foundation species
ecosystem engineers; physically alter ecosystems in ways that can benefit other species
E.g. grizzly bear, beaver, prairie dog, elephants
Ecological succession
predictable replacement of groups of species with others over time
Follows an expected progression
Focuses on plants/producers
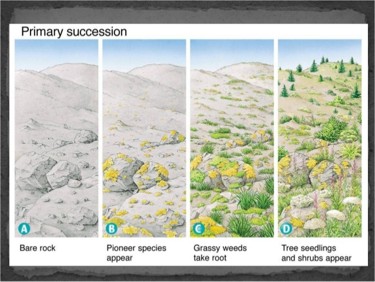
Primary succession
form of succession in which ecosystem forms where no soil or bottom sediment existed before
“Start from scratch” ecosystem
Eg Volcanic area, abandoned parking lot, new islands
Rock weathers (breaks down) physically & chemically – forms some constituents of soil
Pioneer species arrive
Pioneer species
eg mosses, lichens, ferns
Grow on rock → decompose and mix with rock to form soil
Followed by mid and late successional plants (larger)
Soil
made of bits of rock & organic matter
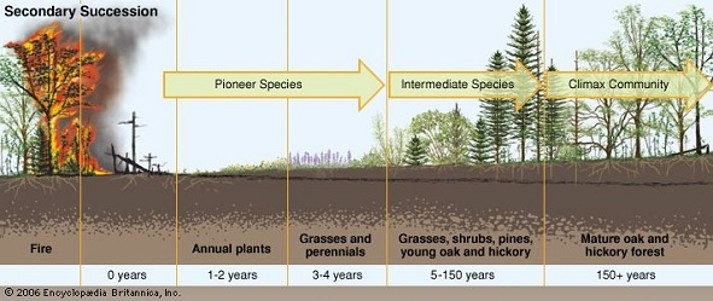
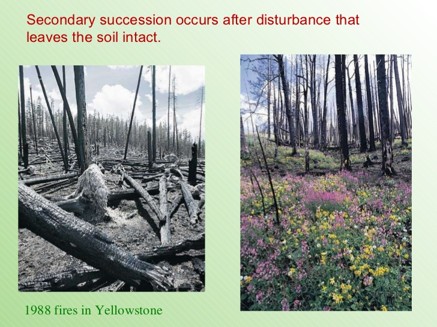
Secondary Succession
ecosystem forms where soil or bottom sediment already exists → resilience (ability to bounce back)
Ecosystems w/ high resilience are more likely to undergo secondary succesion
Often seen as nature “reclaiming” an area
Ecosystem existed there previously
Eg Burned or cut forest, abandoned farmland, polluted or altered waterways, vacant lots
Occurs in similar way to primary succession – smaller plants become established & larger ones eventually move in
Ecosystems influenced by _____, _____, _____, & _____ from other ecosystems
Latitude, Time, Size, & Distance
Latitude
closer to equator = more biodiversity
Eg tropical rainforest vs. tundra
Time
older ecosystem = more biodiversity
More time for speciation, species immigration to occur
Size
larger ecosystem = more biodiversity
More species can exist in larger places
Larger places more are resistant to disaster, extinctions
Species more likely to move into larger areas
Larger places have more niches
Distance
closer to other ecosystem = more biodiversity
Eg islands closer to the mainland vs. those that are more isolated
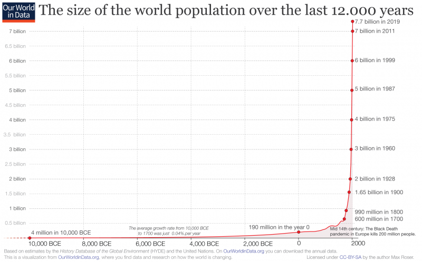
Human population has grown _____ throughout most of history BUT has experienced exponential ______ over the past 200 years ( __ shaped curve)
slowly, growth, J
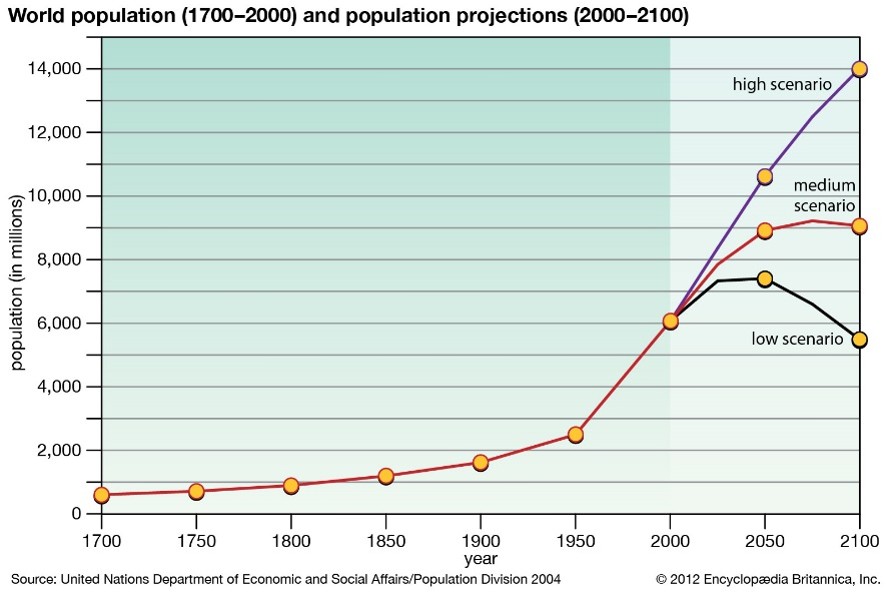

Why has the earth experienced such a rapid growth recently?
1. Ability of humans to spread into all areas of Earth
Regardless of habitat, climate
2. Improved agricultural techniques
More food production
Better access to necessary nutrients
3. Improved public health
Medicines, vaccines, antibiotics
Sanitation, water treatment

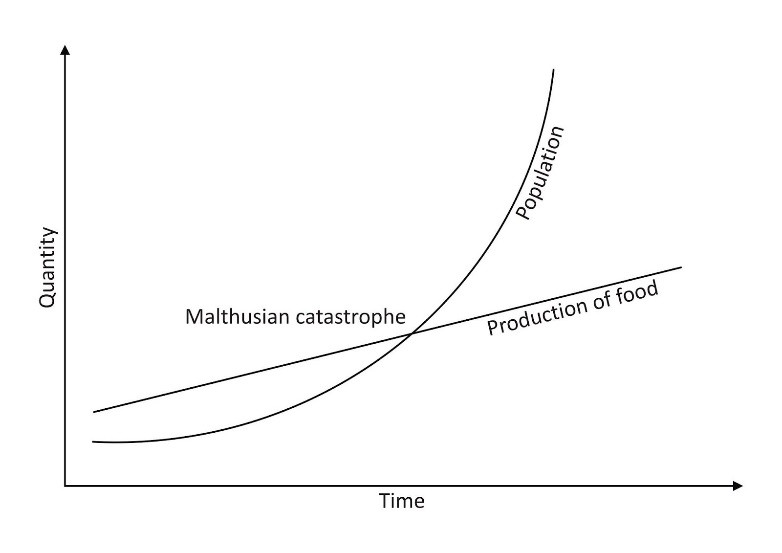
Malthusian theory
Belief that human population growth will outpace food production
Demography
study of human population and population trends
Crude birth rate
Crude death rate
Doubling time
amount of time it takes for a population to double in size
DT (years) = 70/growth rate (as a percent
Crude birth rate
number of births per 1000 individuals
Crude death rate
number of deaths per 1000 individuals
Global population growth rate
= (CBR – CDR)/1000
Total fertility rate
the average number of children woman has in her life
Declining worldwide
Global TFR in 2020 → 2.4
Higher TFR in developing countries
Replacement-level fertility rate
fertility rate required in order to offset deaths; Fertility rate needed for population to remain stable
Approx. 2.1 in developed countries, higher in developing countries
Life Expectancy
average number of years people live in a given time/place
2019 → 72 years worldwide (higher for women than men)
Generally increasing worldwide
2019 → 79 years in U.S.
Generally higher in other developed countries than U.S. (#38 in world)
Infant mortality rate
number of deaths of children under age of 1 per 1000 live births
IMR lower in other developed countries than U.S. (56th lowest in world)
higher in developing countries
generally decreasing worldwide
Child mortality rate
number of deaths of children under age of 5 per 1000 live births
higher in developing countries
generally decreasing worldwide
HIV/AIDS
Killed 30 million people between 1990-2015
8 African countries have HIV infection of 10-28%
Caused reversal of positive demographic trends (eg life expectancy)
Has removed large numbers of young adults from populations of countries → continues state of poverty
Decrease in number of workers → less productivity, less support for young and old
Immigration in the U.S
1820 – present → U.S. has taken in 2x as many immigrants as all other countries combined
Currently, 40% of population growth due to immigration
Until 1960, most came from Europe
Since 1960, most come from Latin America & Asia
Net migration rate
Despite low fertility rates (below replacement), U.S. (& Canada) is one of few developed countries with growing population
Problematic: ecological footprint of average American is very high
Net migration rate
(immigration – emigration) per 1000 people
U.S. – 3 immigrants per 1000 people
Migration (immigration & emigration)
Most occurs due to people seeking economic opportunity
Some people migrate as refugees of war, ethnic & religious persecution, political oppression
Number of environmental refugees increasing
Eg lack of water, food, rising seas
25 million in 2005
Approx. 50 million in 2010
Top ten countries by population size:
1. China
2. India
3. U.S.
4. Indonesia
5. Pakistan
6. Brazil
7. Nigeria
8. Bangladesh
9. Russia
10. Mexico
Age structure
distribution of ages of people of population
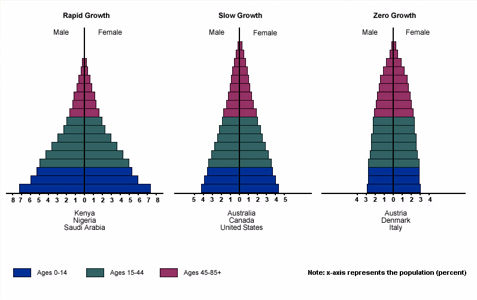
Age structure diagram
(aka population pyramid) shows percentages/numbers of males & females in population
Breaks them down into five year increments
3 major categories of ages:
Pre reproductive, reproductive (15-44), post reproductive