Handout 11A: Central limit theorem, estimating X bar
1/6
There's no tags or description
Looks like no tags are added yet.
Name | Mastery | Learn | Test | Matching | Spaced |
|---|
No study sessions yet.
7 Terms
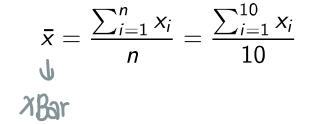
What is X bar (x̄)?
A symbol for the SAMPLE mean → average of set of data points in sample
Sampling without replacement: removing from population once drawn
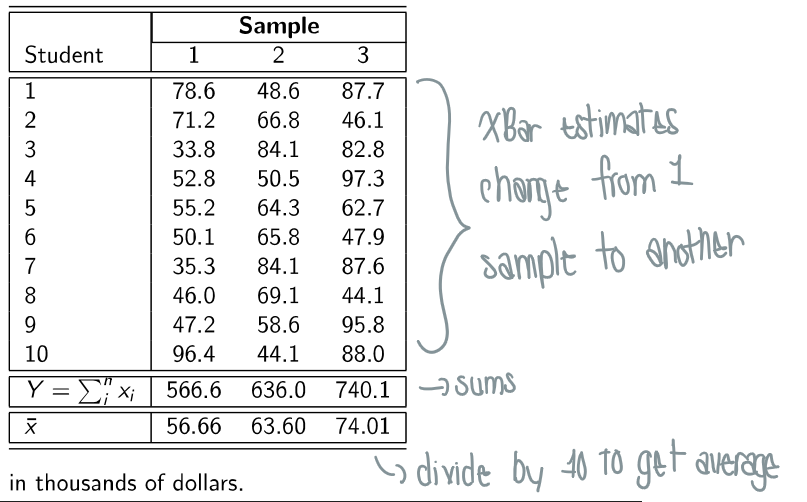
What is Y?
Sum of the sample values → summary
just the sum, not the average! The average before divided by # of values
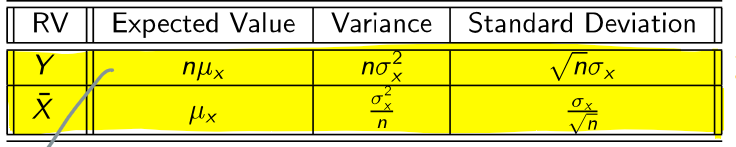
What is the expected value, variance, and standard deviation of Y and x̄?
n = the sample size
Y = the sum
x̄ = the average
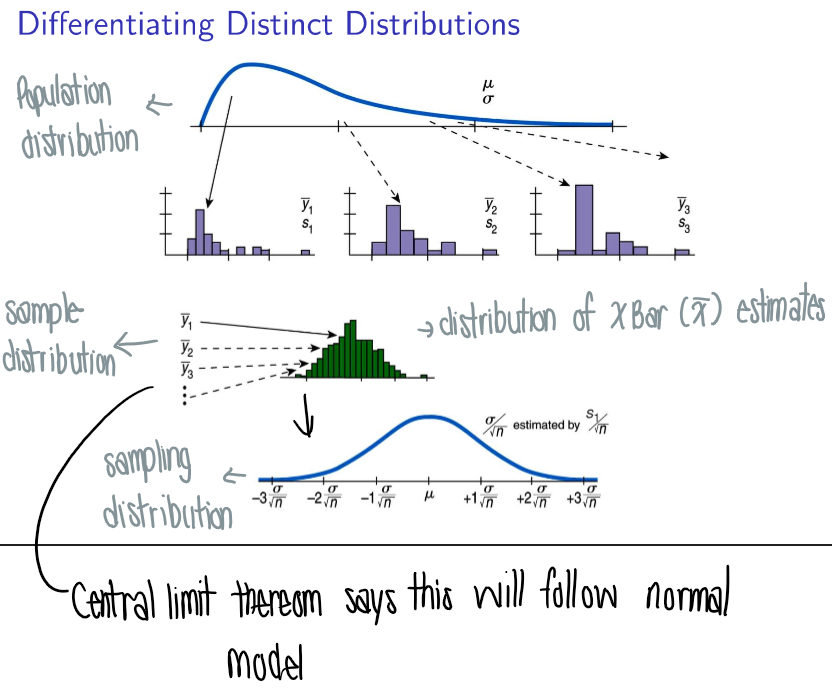
What is the shape probability distribution function of x̄ and Y?
If the sample size (n) is large & the sample is random (the observations is independent)
→ It follows a normal model (bell-curve)
Summaries (x̄ & Y) will follow a normal model

What is the central limit theorem?
The middle values of a distribution is more common because there are multiple paths to get to the middle values!
only 1 path to get to maximum/minimum values
that’s why it’s shaped like a bell (huddled in the middle)
What are some things to note about the CLT (central limit theorem)?
The spread in Y increases with increasing sample size (n)
The spread in x̄ decreases with increasing sample size (n) → the SD would grow smaller as the denominator (n) grows larger
→ as n increases, the shape looks more like a normal model
can turn any sample (if skewed) into a central limit distribution (normal model, less skewed)

What is a sample distribution & a sampling distribution?
Sampling distribution (of x̄ & Y)