Chapter 2: Frequency Distributions
1/32
There's no tags or description
Looks like no tags are added yet.
Name | Mastery | Learn | Test | Matching | Spaced | Call with Kai |
|---|
No analytics yet
Send a link to your students to track their progress
33 Terms
A frequency distribution:
Shows the _____ of individuals located in each category on the scale of measurement
Shows the # of individuals located in each category on the scale of measurement
A frequency distribution:
Can be either a ____ or a _____
table or a graph
Structure of a frequency distribution table:
Frequency count (___) next to category (___ values)
(f)
X
Structure of a frequency distribution table:
Σ__ = N
f
Proportions:
Measures the _______ of the total group that is associated with each score
fraction
Proportions:
p =
f / N
Proportions:
Called ______ _________because they describe the frequency (f) in relation to the total number (N)
relative frequencies
Percentages:
Expresses relative frequency out of 100
Percentages:
equation-
p(100) = f / N (100)

Use the frequency distribution table to determine how many participants were in the study.
10
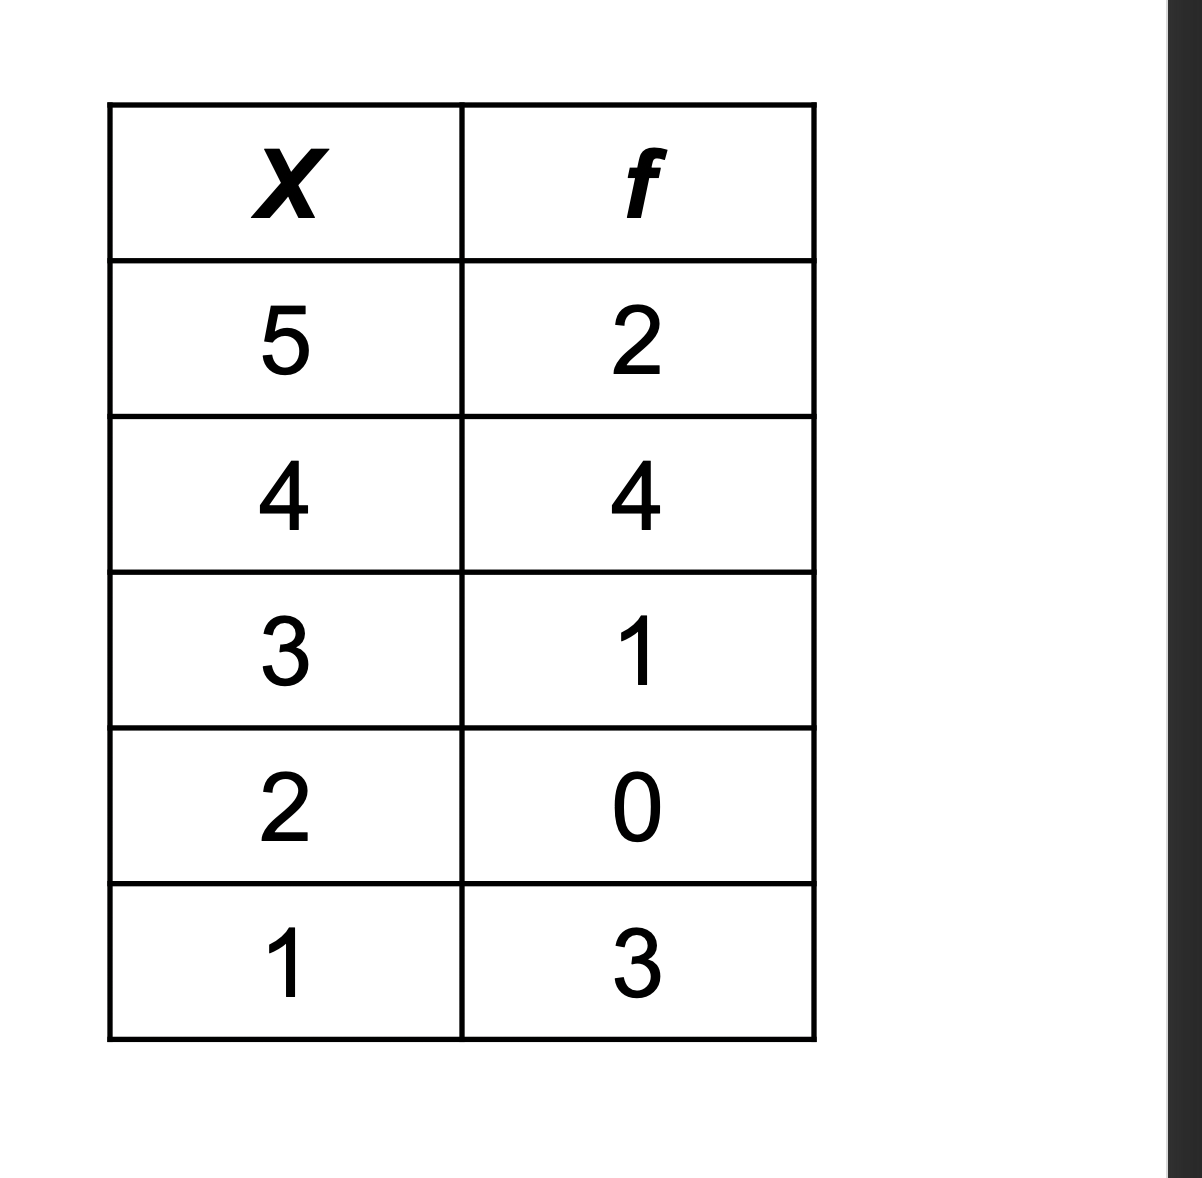
True or False:
More than 50% of the individuals scored above 3.
True

True or False:
The proportion of scores in the lowest category was p = 3.
False
Frequency Distribution Tables:
What should you do if the number of categories is too large?
Group the categories into intervals.
AKA a Grouped Frequency Distribution Table
Frequency Distribution Tables:
What info is lost when categories are grouped
Individual scores cannot be retrieved
The wider the grouping interval, the more information is lost
Frequency Distribution Tables:
Guidelines:
Ten or fewer class intervals is typical (but use good judgment for the specific situation)
The width of each interval should be a relatively simple number (e.g., 2, 5,10, or 20)
All intervals should be the same width (other than for an open category)
True or False:
You can determine how many individuals had each score from a frequency distribution table.
True
True or False:
You can determine how many individuals had each score from a grouped frequency distribution.
False
Graphs
The bar for continuous variables- the ____ of the bar extends to the real limits of the category (remember rounding)
width
Explain a “block” Histogram
Each block represents one person
What graph to use for nominal and ordinal data (non-numerical scores)?
A bar graph
Bar graphs for Nominal and ordinal data (non-numerical scores)
In a regular bar graph is the area of the bars meaningful?
No! Only the height is meaningful
Bar graphs for Nominal and ordinal data (non-numerical scores)
What do spaces between bars represent?
Spaces between bars indicate discrete categories
Bar graphs for Nominal and ordinal data (non-numerical scores)
Bar graphs without a particular order would be for ______ data
Nominal
Bar graphs for Nominal and Ordinal data (non-numerical scores)
Bar graphs without measurable width would be for ______ data
Nominal and Ordinal data
Graphs for Population Distributions
Describe a Normal Distribution:
Symmetric with greatest frequency in the middle
Common data structure for many variables
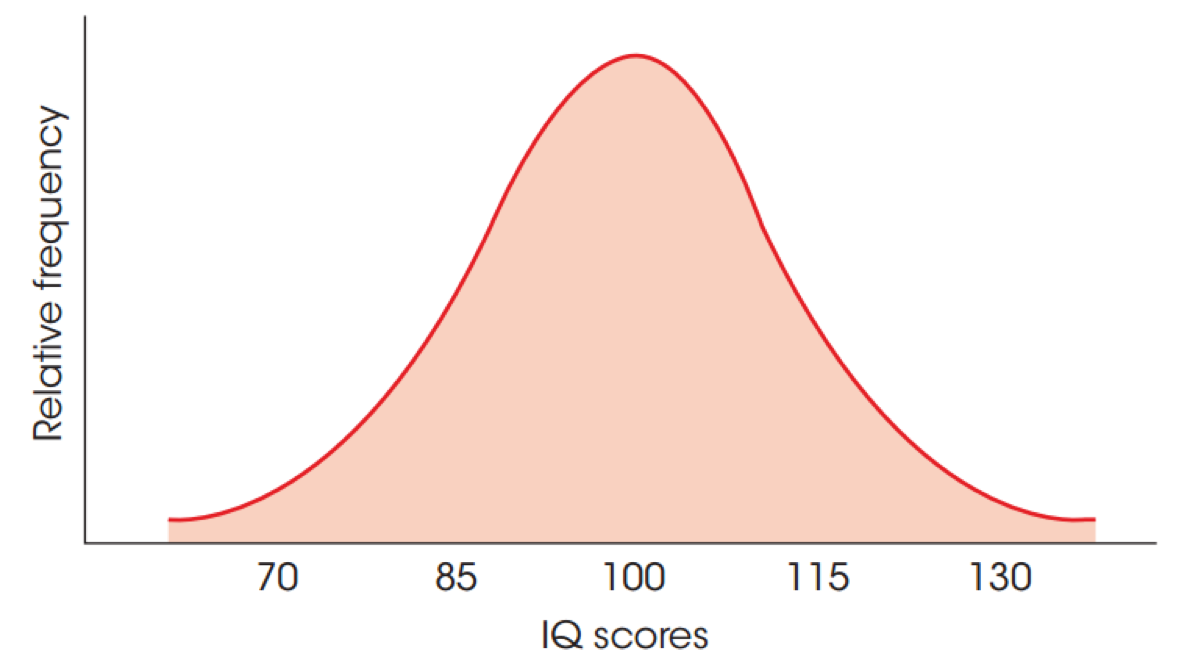
What does this show?
The population distribution of IQ scores: an example of a Normal Distribution
Shape of a Frequency Distribution
Symmetrical distribution:
Each side is a mirror image of the other
Shape of a Frequency Distribution
Skewed distribution:
scores pile up on one side and taper off in a tail on the other
Shape of a Frequency Distribution
Skewed distribution:
Tail on the right (___ scores) = ____ skew
Tail on the left (____ scores) = _____skew
(high) = positive
(low) = negative
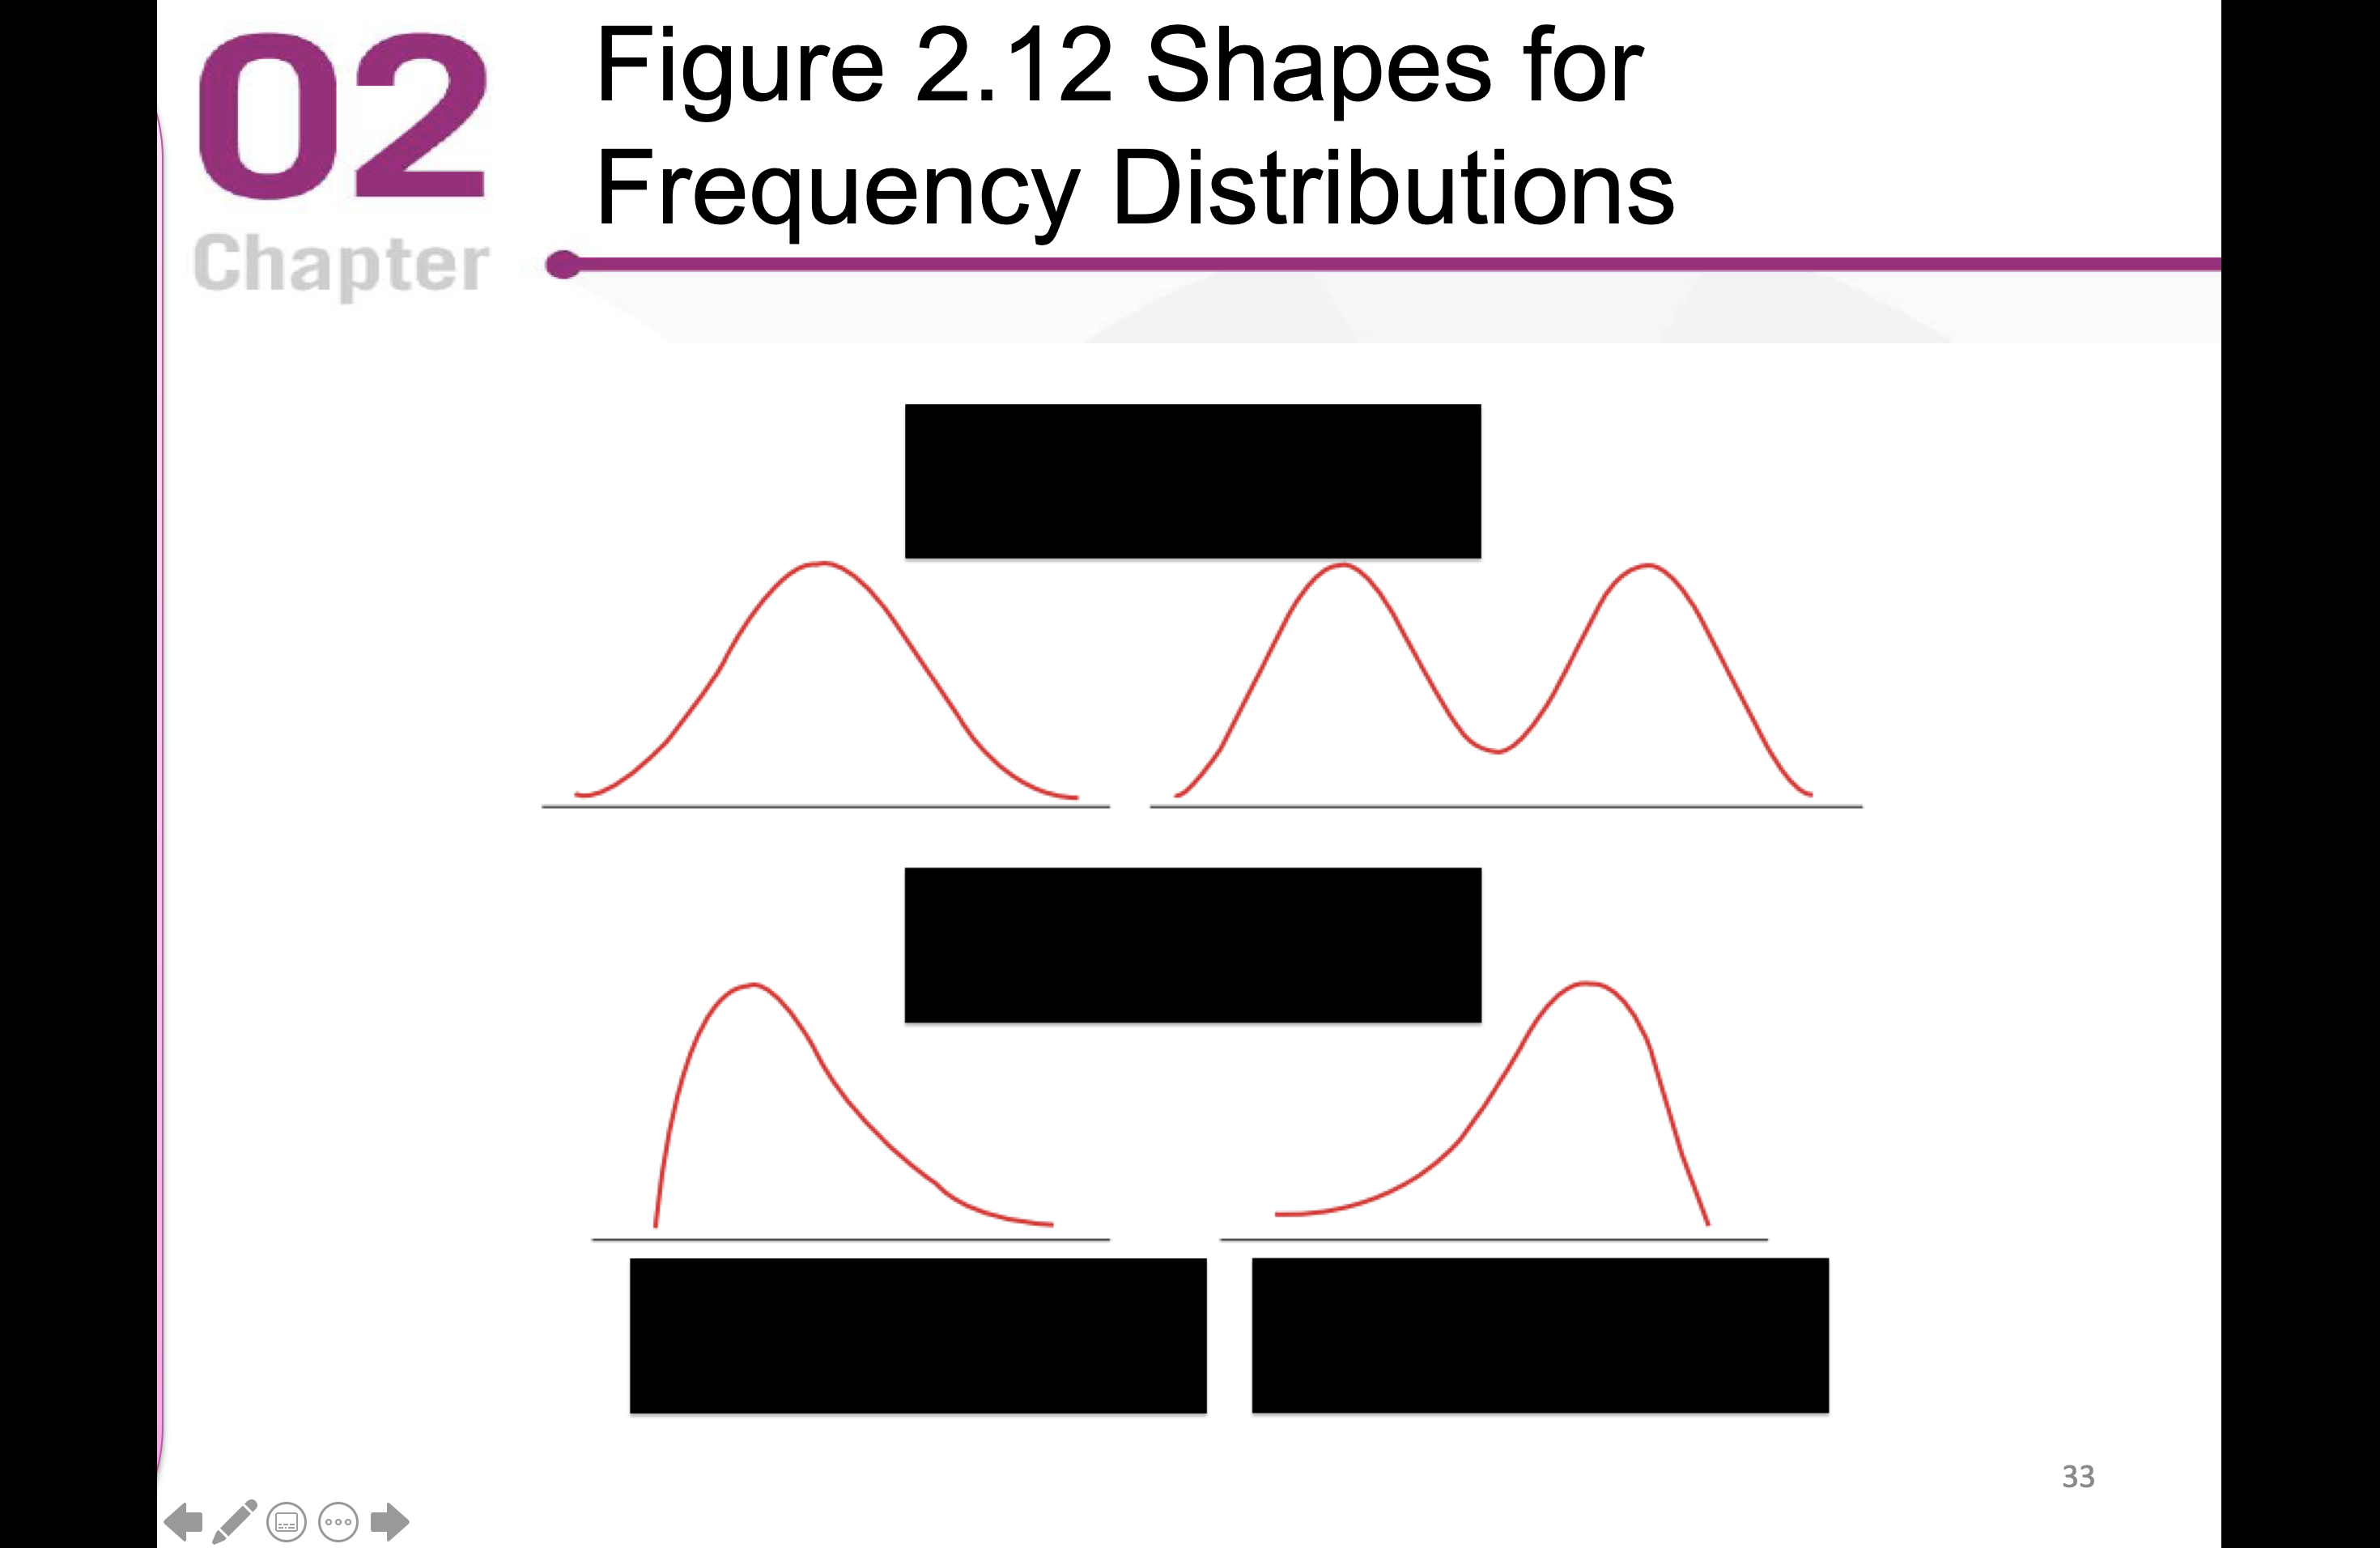
Label the graphs
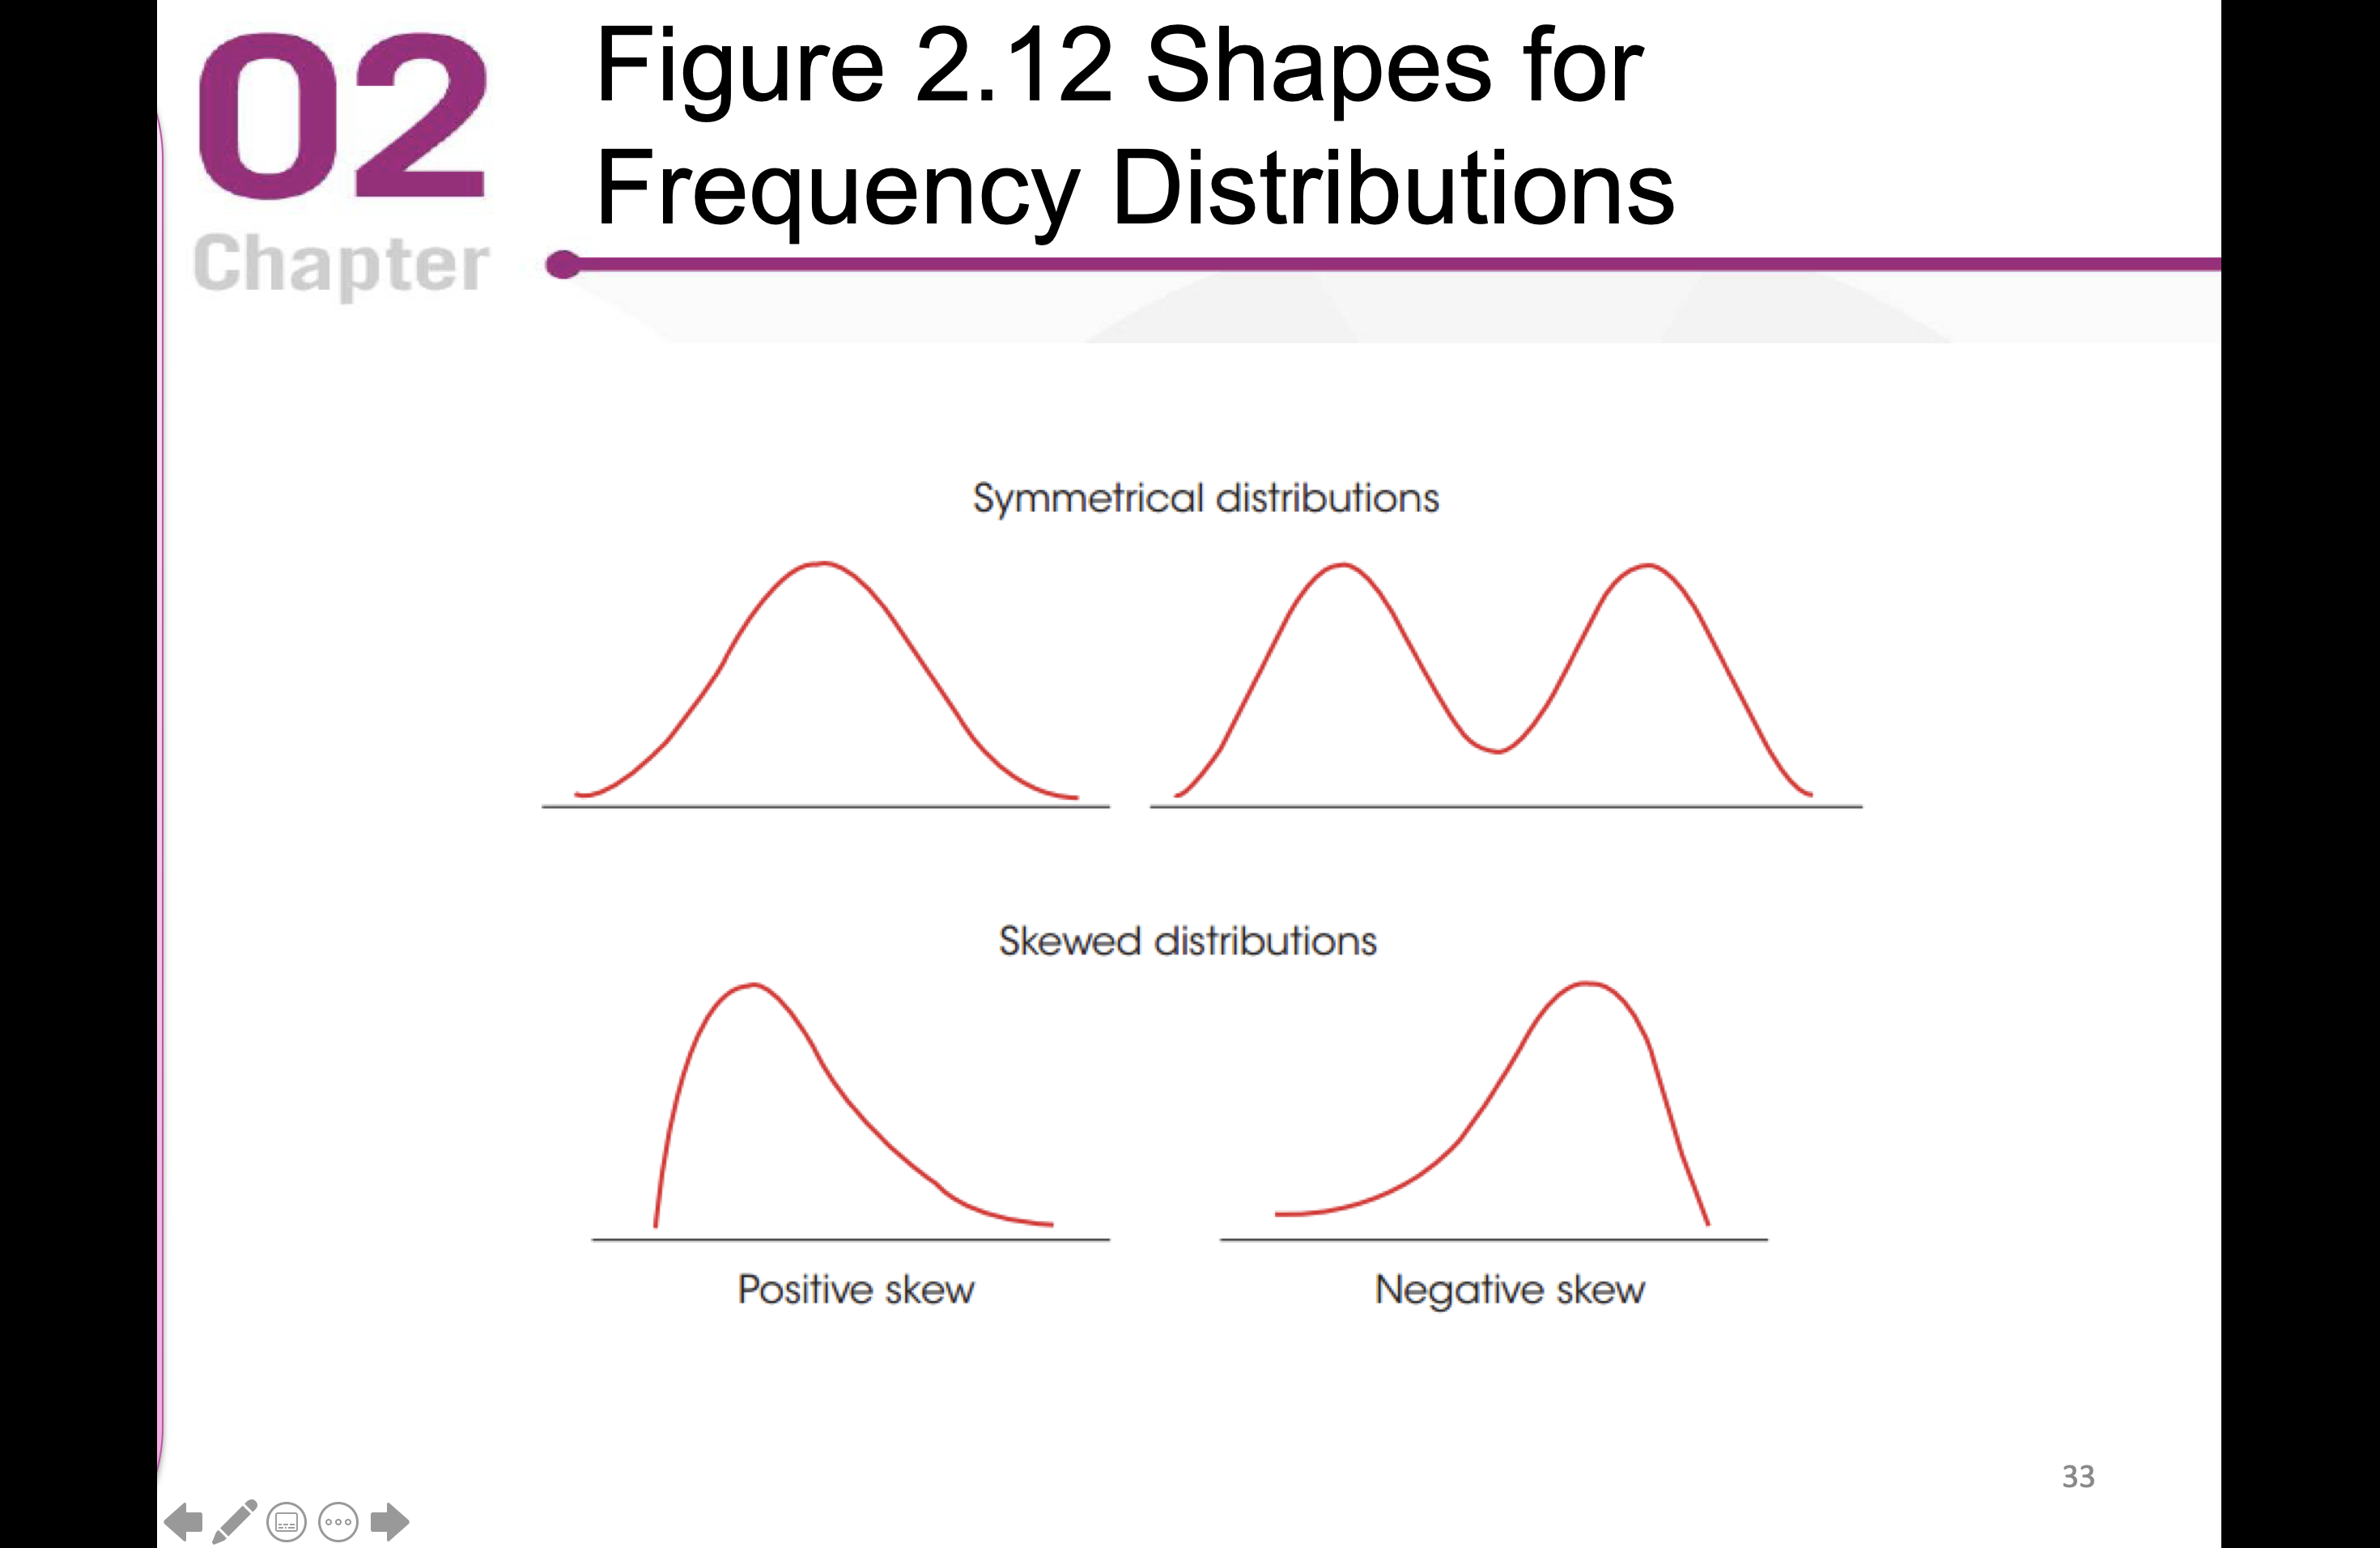
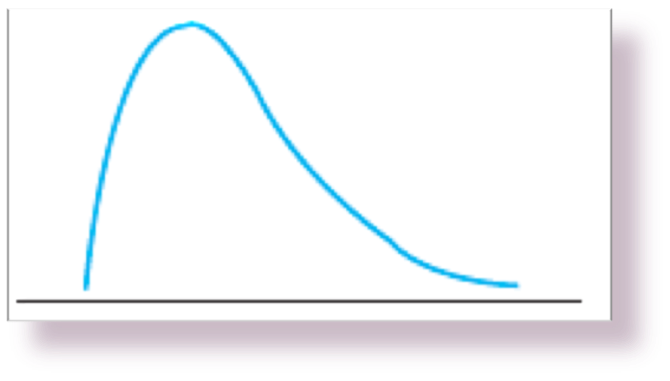
What is the shape of this distribution?
positively skewed
True or False:
It would be correct to use a histogram to graph parental marital status data (single, married, divorced...) from a treatment center for children
False
Histogram = continuous data only. Marital status is categorical (nominal), so you’d use a bar chart, not a histogram.
True or False:
It would be correct to use a histogram to graph the time children spent playing with other children from data collected in a children’s treatment center.
True
Time is continuous/quantitative → a histogram is the correct choice.