Supply Chain Processes - Test 1 Ch 2
 Call Kai
 Learn
Learn Practice Test
 Spaced Repetition
 Match
Match Flashcards
 Knowt Play
1/57

There's no tags or description
Looks like no tags are added yet.
Name | Mastery | Learn | Test | Matching | Spaced | Call with Kai | Chat |
|---|
No analytics yet
Send a link to your students to track their progress
58 Terms
process strategy
the pattern of decisions made in managing processes so that they will achieve their competitive priorities
process structure in services
customer contact; customization; process divergence; flow
customer contact
the extent to which the customer is present, actively involved, and receives personal attention during the service process
customization
service level ranging from high customized to standardized
process divergence
the extent to which the process is highly customized with considerable latittude as to how its tasks are performed fl
flow
how the work progresses through the sequence of steps in a process
dimensions of customer contact
physical presence, whats processed, contact intensity, personal attention, method of delivery
Customer Contact Matrix for Service Processes

front office
flexible flows with individualized processes; high interaction with customers (highly customized)
hybrid office
flexible flows with some dormant paths; some customer interaction; standard services with some options
back office
line flows, routine work performed the same way with all customers; low interactions with customers, standardized services
process strategy decisions
customer involvement; resource flexibility; capital intensity
advantages of customer involvement
increased net value to customers; better quality/delivery/flexibility/cost; reduction in product/shipping/inventory costs; coordination across supply chain
disadvantages of customer involvement
disruptive; managing timing/volume is challenging; quality implications; needs interpersonal skills; multiple locations may be necessary
resource flexibility workforce
flexible
resource flexibility equipment
general purpose; special purpose
break even volume (Q) equation
Break even volume = fixed cost/ (revenue per patient - variable cost per unit)
process reengineering
the fundamental rethinking and radical redesign of processes to improve performance dramatically in terms of cost, quality, service, and speed
key elements of process reengineering
critical processes; strong leadership; cross functional teams; info technology; clean slate philosophy; process analysis
process improvement
the systematic study of the activities and flows of each process to improve it
process analysis
the documentation and detailed understanding of how work is performed and how it can be redesigned
six sigma process improvement model
define; measure; analyze; improve; control
DMAIC Roadmap
define; measure; analyze; improve; control
define
the scope and boundaries of the process to be analyzed are first established
measure
the metrics to evaluate how to improve the process are determined
analyze
a process analysis is done, using the data on measures, to determine where improvements are necessary
improve
the team uses analytical and critical thinking to generate a long list of ideas for improvement
control
the process is monitored to make sure that high performance levels are maintained
defining, measuring, and analyzing the process
flowcharts; work measurement techniques; process charts; data analysis tools
flowchart
a diagram that traces the flow of information, customers, equipment, or materials through the various steps of a process
service blueprint
a special flowchart of a service process that shows which steps have higher customer contact
capital intensity
the mix of equipment and human skills in the process the greater the relative cost of equipment, the greater the capital intensity
swim lane flowchart
a visual representation that groups functional areas responsible for different subprocesses into lanes
work measurement techniques
time study; elemental standard data method; predetermined data method; work sampling method; learning curve analysis
process charts
an organized way of documenting all the activities performed by a person or group of people, at a workstation, with a customer, or working with certain materials
categories of activities
operation; transportation; inspection; delay; storage
purpose of a process chart
helps logistics managers understand, analyze, and improve the flow of goods
data analysis tools
checklists; histograms/bar charts ; Pareto charts; scatter diagrams; cause and effect diagrams (fishbone); graphs
process chart: operation
circle
process chart: transportation
arrow
process chart: inspection
square
process chart: delay
semicircle
process chart: storage
triangle
redesigning and managing process improvements
questioning/brainstorming; benchmarking; implementing
brainstorming
letting a group of people, knowledgable about the process, propose ideas for change by saying whatever comes to mind
questions for uncovering ideas
what is being done; when is it being done; who is doing it; where is it being done; how is it being done; how well does it do on the various metrics of importance
benchmarking
a systematic procedure that measures a firm’s processes, services, and products against those of industry leaders
the set up of a cause and effect diagram
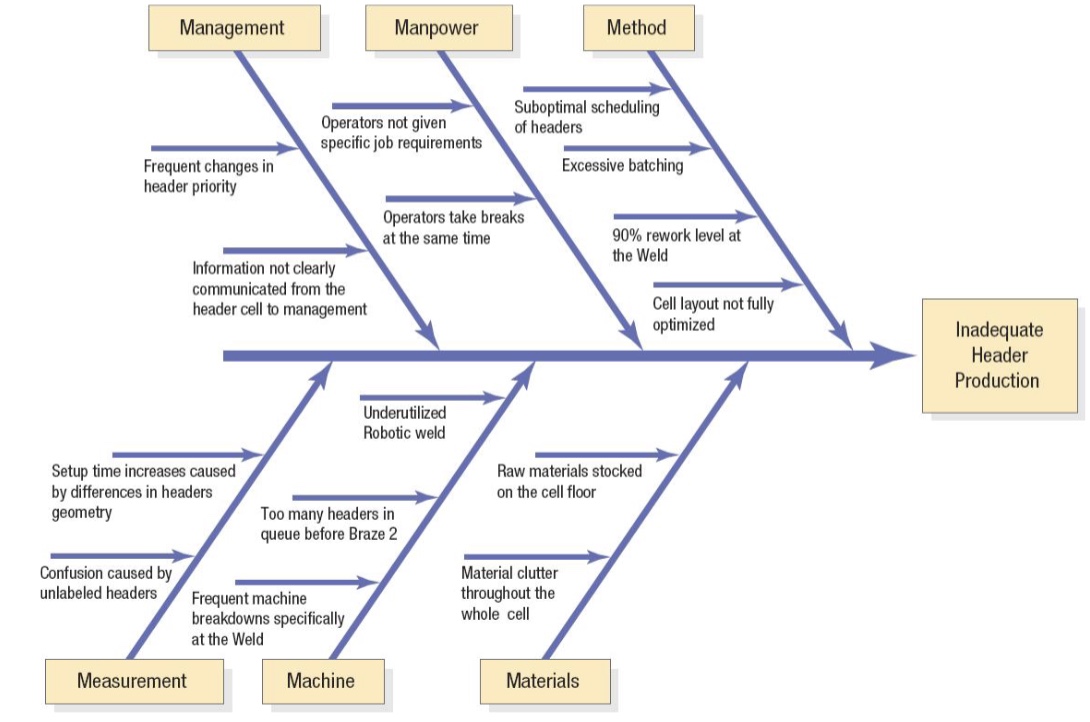
how to develop a pareto chart
Collect data → Rank causes → Draw bars → Calculate cumulative % → Find the biggest contributors
pareto principle
80% of results come from roughly 20% of causes; a small number of problems creates a large percentage of the overall issues
implementing: mistake 1
not connecting with strategic issues
implementing: mistake 2
not involving the right people with the right way
implementing: mistake 3
not giving the design teams and process analysts a clear charter/holding them accountable
implementing: mistake 4
not being satisfied unless fundamental “reenginering” changes are being made
implementing: mistake 5
not considering the impact on people
implementing: mistake 6
not giving attention to implementation
implementing: mistake 7
not creating an infrastructure for continuous process improvement
purpose of benchmarking
allows the company to compare, identify gaps, and improve performance