Spatial Vision - Contrast Sensitivity
 Call Kai
 Learn
Learn Practice Test
 Spaced Repetition
 Match
Match Flashcards
 Knowt Play
1/135

There's no tags or description
Looks like no tags are added yet.
Name | Mastery | Learn | Test | Matching | Spaced | Call with Kai | Chat |
|---|
No analytics yet
Send a link to your students to track their progress
136 Terms
contrast (luminance contrast)
the luminance difference between area
c=(Lmax-Lmin)/(Lmax+Lmin)
What is the michelson equation?
k = Delta I/Ib
What is weber's contrast equation?
contrast is everywhere in life; our goal is to ensure that our patients are able to comfortable live
What do we use tests to measure contrast in clinic?
teller acuity card, snellen charts (above 90%), color vision (chromatic)
What are examples of where contrast is used in clinic?
90%
What is the average contrast acheived with using snellen charts in clinic?
False (only should measure color contrast if measured properly, no luminance!)
True or False: When measuring color vision, both luminance and color contrast are measured.
helps perceive a boundary, object, or motion
What are the three reasons why contrast is so important for our vision?
spatial, temporal
Perceiving motion is related to __________ and __________ contrast.
False (contrast is more important)
True or False: Luminance is more important for our spatial vision
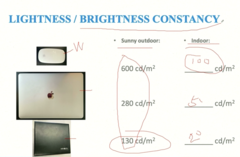
lightness/brightness constancy
phenomenon that shows how the same object under different illumination conditions is still perceived as the same object
simultaneous contrast
the phenomenon where the center square on the left appears brighter, even though the two center squares are the same color

darkness surround the left center square causes lateral inhibition, leading to the center square being perceived as brighter (basically contrast)
How does simultaneous contrast work?

assimilation
how our visual system processes contrast to build a more complex contrast relation from area to area

two, three
With simultaneous contrast, there are two/three areas of contrast within each box, whereas with assimilation, there are two/three areas of contrast within each box.
tells us how complex contrast processing is
Why do we compare simultaneous contrast to assimilation?
contrast threshold
the minimum luminance difference (in %) required to tell apart between areas
contrast sensitivity
reciprocal of contrast threshold; measures the ability to differentiate fine increments or decrements of light luminance
Yes, common in older patients
Stairs are an everyday contrast example. Is it possible for someone to have enough trouble differentiating contrast to misjudge steps?
increases, decreases
Stairs are an everyday contrast example. Older patients often have trouble differentiating contrast and misjudge steps. This means that over time our contrast threshold decreases/increase and our contrast sensitivity decreases/increases.
contrast sensitivity function
depicts the contrast sensitivity for different spatial frequency; basically ability to process contrast for different sized objects
spatial (achromatic) luminance contrast, spatial chromatic contrast
What are the two types of contrast we are concerned with?
tells how well our visual system is working and is a good predictor of daily visual performance
Why is using a contrast sensitivity function important (basically visual performance vs visual acuity)?
amblyopia, glaucoma, diabetic retinopathy
Contrast sensitivity deficits have high correlation with the presence of many ophthalmologic diseases. What are three examples of these diseases?
spatial modulation transfer function (SMTF)
used to quantify how well and optic lens transfers contrast information for stimulus of various spatial frequencies
function used to quantify how well a lens system in the eye can keep a similar contrast of an object from one side to another side
Summarize the idea of spatial modulation transfer function in your own words (i'll put mine down!)
less, slow
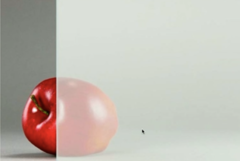
Review: Low spatial frequency refers to images with less/more detail and slow/quick changes in an image.
more, quick
Review: High spatial frequency refers to images with less/more detail and slow/quick changes in an image.
large
Review: Low spatial frequency correlates to small/large object.
small
Review: high spatial frequency correlates to small/large object.
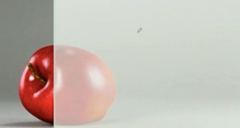
high (able to see the detail of the small stem in comparison of the larger apple)
The stem of the apple represents and area of low/high spatial frequency.
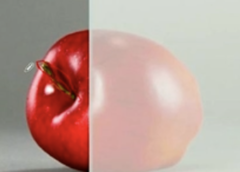
low (relatively flat area with no change)
The body of the apple represents and area of low/high spatial frequency.
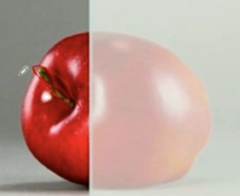
left
Look at the following picture. Do you think the left or right side of the picture is easier to process contrast?
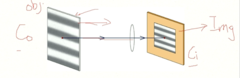
Co>Ci
A spatial grating with a specified spatial frequency (Co) and contrast is focused by an optical lens. The image contrast Ci is then measured. How would Ci and Co compare in terms of contrast?
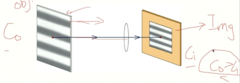
as light bounces off Co and travels through the lens, contrast information is lost
A spatial grating with a specified spatial frequency (Co) and contrast is focused by an optical lens. The image contrast Ci is then measured. As previously discussed, Co would be perceived to have a higher contrast the Ci. Why?
Ratio = Ci/Co (0-1)
What formula is used to describe the contrast difference between Co and Ci?
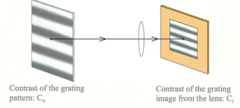
how well the lens transfers information like contrast contained in an object.
What does the ratio = Ci/Co help tell us?
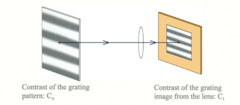
image contrast is the same as object contrast (meaning as the light from the object travels through the lens, no contrast information is lost)
What does it mean if Ci/Co = 1?
the image appears as a homogenous area, ie no contrast perceive from object to image (all contrast lost as information travels through the lens)
What does it mean if Ci/Co = 0?
spatial frequency
What is the x-axis of a spatial modulation transfer function?
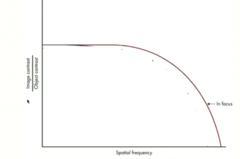
Ci/Co
What is the y-axis of a spatial modulation transfer function?
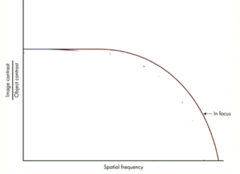
lens contrast processing ability in regards to spatial frequency (different sized objects)
What is the purpose of using a spatial modulation transfer function?
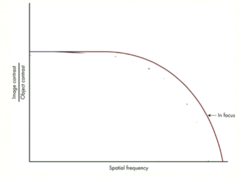
1 (due to ratio of Ci/Co)
What is the highest possible value on the y-axis of the spatial modulation transfer function?

a little
The following graph shows a SMTF for an optical lens that is in focus. This shows that with low and moderate spatial frequencies, the image is transferred with a little/a lot of image degradation.
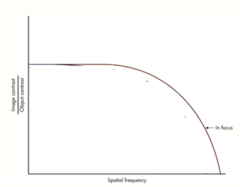
a lot
The following graph shows a SMTF for an optical lens that is in focus. This shows that with higher spatial frequencies, the image is transferred with a little/a lot of image degradation.
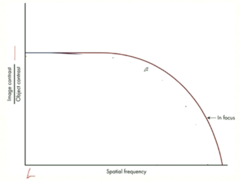
due to aberrations in the optical system
The following graph shows a SMTF for an optical lens that is in focus. This shows that with higher spatial frequencies, the image is transferred with a lot of image degradation. Why does this occur with higher spatial frequencies?
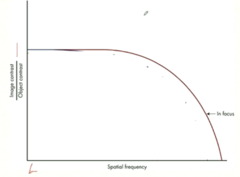
Reduction
The following graph shows a SMTF for an optical lens that is out of focus. This shows the defocus results in a(n) reduction/increase in image quality more for high spatial frequencies, than for low and moderate frequencies.
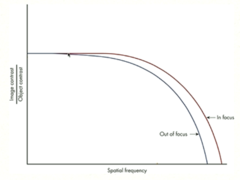
reduction
The following graph shows a SMTF for a translucent lens. This shows that the translucent lens results in a general reduction/increase in image quality for all spatial frequencies
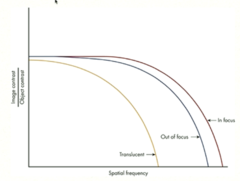
measure contrast threshold and contrast sensitivity function
How are we able to quantify the human visual system's ability to process contrast information?
1. What kind of visual stimuli can be used to measure contrast threshold?
2. What kind of psychophysical method should be used?
What are the two questions we should ask when wanting to measure contrast threshold/contrast sensitivity?
target with a background, AFC stimuli (like 4 ARF), grating
What are three examples of stimuli that can be used to measure contrast threshold?
michelson's contrast (Lmax-Lmin/Lmax+Lmin)
What formula can be used when finding the percent contrast for a given visual stimulus?
vistech chart
chart that measures contrast threshold by presenting various target stimuli with various contrast levels
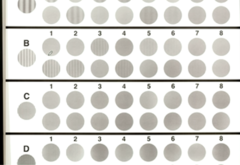
3, 6, 12, 18
What are the four spatial frequencies tested in a vistech chart?
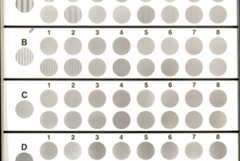
decreasing
With a vistech chart, 3, 6, 12, and 18 cpd are tested with contrast decreasing/increasing from left to right.

Pelli-Robson Chart
chart that measures contrast threshold by presenting three-letter set of visual stimuli with decreasing contrast levels

false (they are all the same size because the goal is to measure contrast sensitivity, not VA)
True or False: The letters in a Pelli-Robson Chart are different in size.
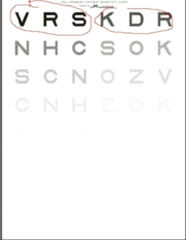
high, contrast
VA measures sensitivity to ______ spatial frequencies, whereas the Pelli-Robson data measures sensitivity to high spatial frequencies and ___________ sensitivity to lower spatial frequencies.
provides estimation of contrast sensitivities at certain spatial frequencies and easy to administrate at clinical settings
What are the advantages to the pelli-robson and vistech charts?
lack of reliability
What is the disadvantages to the pelli-robson and vistech charts?
true
True or False: Contrast threshold/sensitivity is different for stimuli with different spatial frequencies
true
True or False: Within high spatial frequencies it becomes extremely difficult for the lens to process contrast, regardless of the lens conditions.
MCS
When measuring contrast threshold, if using a computer, you can use a dot target stimulus that provides contrast against the computer screen. What psychophysical method can be used?
background
When measuring contrast threshold, if using a computer, you can use a dot target stimulus that provides contrast against the computer screen. MCS can be used. When using this visual stimuli, should the background or target stay at a fixed luminance (cd/m^2)?
as a psychometric function
When measuring contrast threshold, if using a computer, you can use a dot target stimulus that provides contrast against the computer screen. MCS can be used. When we get our results, how should we expect them to be plotted on a graph?
fixed contrast level of stimulus
When measuring contrast threshold, if using a computer, you can use a dot target stimulus that provides contrast against the computer screen. MCS can be used. What should the x-axis to be?
percent detection
When measuring contrast threshold, if using a computer, you can use a dot target stimulus that provides contrast against the computer screen. MCS can be used. What should the y-axis to be?
50% (NOT 75% because that would be forced choice :))
When measuring contrast threshold, if using a computer, you can use a dot target stimulus that provides contrast against the computer screen. MCS can be used. What percentage should we view as the threshold?
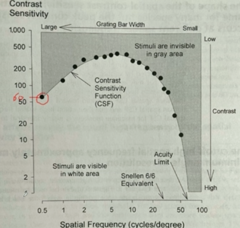
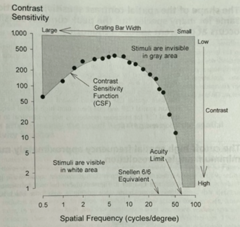
spatial frequency
What is the x-axis of a human contrast sensitivity function?
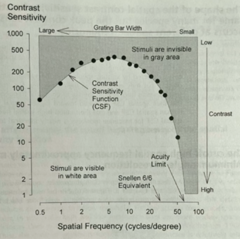
contrast sensitivity (threshold would be calculate as 1/sensitivity)
What is the y-axis of a human contrast sensitivity function?
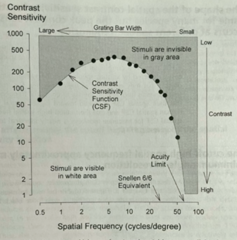
1.5% (1/60x100)
When interpreting the circled point on the graph, it shows that at a frequency of 0.5, the subject was able to see the stimuli until their contrast sensitivity at 60. What is the contrast threshold calculated as a percentage?
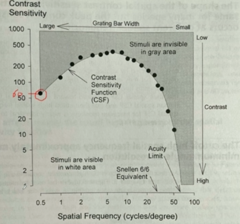
was not
When interpreting the circled point on the graph, it shows that at a frequency of 0.5, the subject was/was not able to see a stimulus at a contrast sensitivity of 200
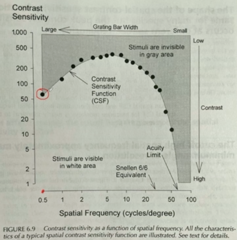
was (1/20x100 = 5%)
When interpreting the circled point on the graph, it shows that at a frequency of 0.5, the subject was/was not able to a stimulus we a contrast threshold of 5.0%?
true
True or False: Even though using human contrast sensitivity functions are important and reliable in measuring how a patient's visual system works, it is often not used in clinic because it is time consuming
2
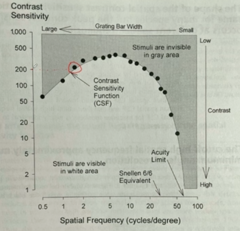
Look at the circle point located on the human contrast sensitivity function. What spatial frequency was measured?
0.5% (1/200 x 100)
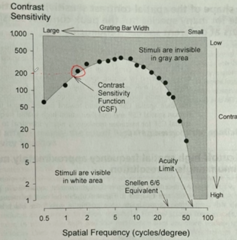
Look at the circle point located on the human contrast sensitivity function. What was the grating contrast threshold measured as a percentage?
would not, would
Look at the circle point located on the human contrast sensitivity function. The grating contrast threshold measured was 0.5%. If the patient was shown a grating contrast of 0.1% the patient would/would not see it and if the patient was shown a grating contrast of 1.0% the patient would/would not see it.
yes
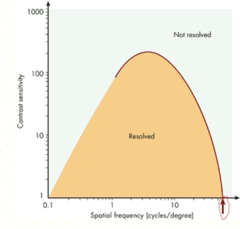
When looking at the following graph of a human contrast sensitivity function, is the axes in log scale?
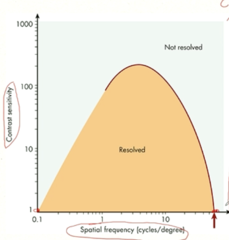
spatial frequency (cycles/degree)
When looking at the following graph of a human contrast sensitivity function, what is the x-axis?
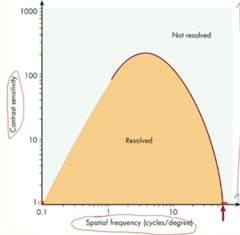
contrast sensitivity
When looking at the following graph of a human contrast sensitivity function, what is the y-axis?
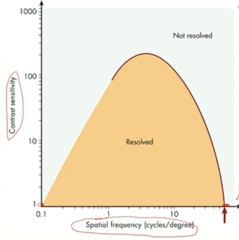
100%, in order to a spatial frequency that high, you would need 100% contrast or you wouldn't see the grating target's contrast
Look at the red dot on the graph. As the shown spatial frequency, what is the contrast threshold? What does this mean?
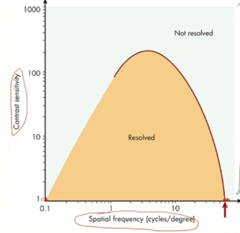
It means that the grating is easily distinguished
The following graph shows a human contrast sensitivity function. What does it mean on the graph when it says "resolved"?
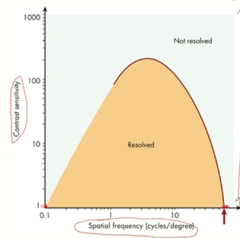
The stimulus appears homogenous (despite being a grating pattern)
The following graph shows a human contrast sensitivity function. What does it mean on the graph when it says "unresolved"?
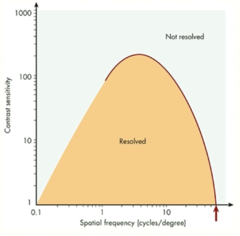
4 cpd (3-10 cpd)
Based on the following graph, at what spatial frequency does the visual system typically have maximum sensitivity to contrast?
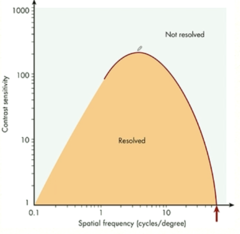
true (means you have to infer what the spatial frequencies may be for below 0.5 cpd)
True or False: With very low spatial frequencies (like 0.5 cpd) it is harder to measure human contrast sensitivity functions.
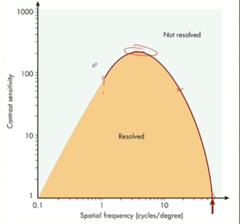
high-frequency cutoff
Point where at 100% contrast, the grating can no longer be resolved
40-60 cpd (hard to determine from graph, typically this in young, health patients)
Where on the following graph is the high-frequency cutoff (estimate)?
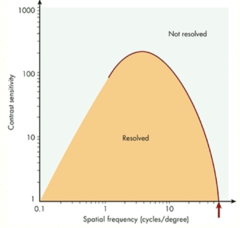
band-pass filter
specific range of frequencies that our visual system either pass or reject a certain frequency (allows range of frequencies to pass through)
Low band-pass contrast sensitivity function
visual system is able to process low frequencies better than high frequencies
high band-pass contrast sensitivity function
visual system is able to process high frequencies better than low frequencies
low, high
The red line on the following graph demonstrates a low/high pass band filter, whereas the green line demonstrates a low/high pass band filter
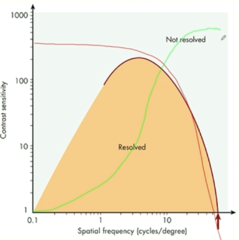
red (so demonstrates a low sensitivity contrast function)
Which line demonstrates a lens contrast sensitivity function?
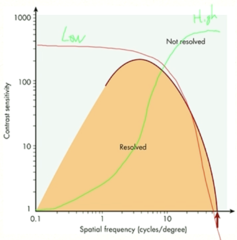
increases, increases
Based on the following graph, the contrast decreases/increases from top to bottom and spatial frequency decreases/increases going from left to light.
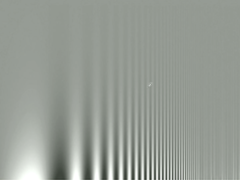
band pass filter
The CSF of other species all demonstrate what type of filter?
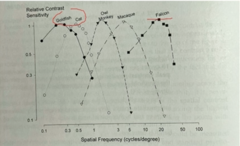
true
True or False: The following graph shows that different species are able to process different size and ranges of spatial frequency.
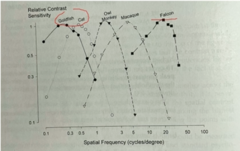
goldfish
Based on the following graph, the ________ has the highest contrast sensitivity for low spatial frequencies
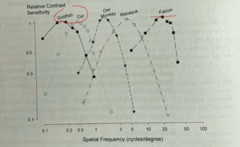
falcon
Based on the following graph, the ________ has the highest contrast sensitivity for high spatial frequencies
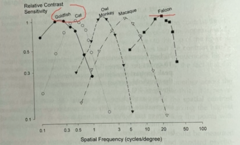
large, worse
Based on the following graph, it is clear that a cat, as compared to a human (peak at 4 cpd), can see better in terms of contrast processing of small/large objects, which means that cats have a worse/better visual acuity than humans
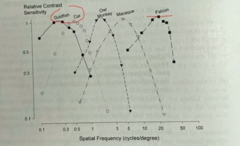
large, worse
Based on the following graph, it is clear that a goldfish, as compared to a human (peak at 4 cpd), can see better in terms of contrast processing of small/large objects, which means that goldfish have a worse/better visual acuity than humans
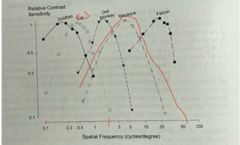
small, better
Based on the following graph, it is clear that a falcon, as compared to a human (peak at 4 cpd), can see better in terms of contrast processing of small/large objects, which means that falcons have a worse/better visual acuity than humans
