Ch -5 Information Gathering Unobtrusive Methods
1/41
There's no tags or description
Looks like no tags are added yet.
Name | Mastery | Learn | Test | Matching | Spaced | Call with Kai |
|---|
No analytics yet
Send a link to your students to track their progress
42 Terms
Unobtrusive Methods
Less disruptive
Insufficient when used alone
Multiple methods approach
Combination of unobtrusive methods and more interactive methods
Used in conjunction with interactive methods
Unobtrusive Methods
Sampling
Quantitative document analysis
Qualitative document analysis
STROBE
Applying STROBE
Define what is meant by Sampling
A process of systematically selecting representative elements of a population
Involves two key decisions:
What to examine
Which people or entities to consider
The Need for Sampling
Containing costs
Speeding up the data gathering
Improving effectiveness
Reducing bias
Sampling Design
Determining the Data to Be Collected or Described
Determining the Population to Be Sampled
Choosing the Type of Sample
Convenience samples: Unrestricted and non probability samples
Purposive sample: based on judgement
Simple random sample: the same must come from a numbered list of the population
Complex random samples: Most appropriate for a systems analysts (Systematic sampling) (Stratified sampling) (Cluster Sampling)
Deciding on the Sample Size
Four main types of samples the analyst has available
Convenience
Not based on probability
Sample elements are selected directly w/out restrictions
Purposive
Not based on probability
Sample elements are selected according to specific criteria
Not wholistic
Simple random
Based on probability
Sample elements are selected directly w/out restrictions
Not good for being comprehensive
Complex random (systematic, stratified [categories & randomize], and cluster[geography & location])
Based on probability
Sample elements are selected according to specific criteria
Should use a complex random if possible
![<p></p><p><strong>Convenience</strong></p><ul><li><p>Not based on probability</p></li><li><p>Sample elements are selected directly w/out restrictions</p></li></ul><p><strong>Purposive</strong></p><ul><li><p>Not based on probability</p></li><li><p>Sample elements are selected according to specific criteria</p></li><li><p>Not wholistic</p></li></ul><p><strong>Simple random</strong></p><ul><li><p>Based on probability</p></li><li><p>Sample elements are selected directly w/out restrictions</p></li><li><p>Not good for being comprehensive</p></li></ul><p><strong>Complex random (systematic, stratified [categories & randomize], and cluster[geography & location])</strong></p><ul><li><p>Based on probability</p></li><li><p>Sample elements are selected according to specific criteria</p></li><li><p>Should use a complex random if possible</p></li></ul><p></p>](https://knowt-user-attachments.s3.amazonaws.com/8d12b997-214b-4e83-aee4-c69210783bbd.jpg)
What are the three approaches to complex random sampling?
Systematic sampling
Choose to interview every kth person on a list of company employees
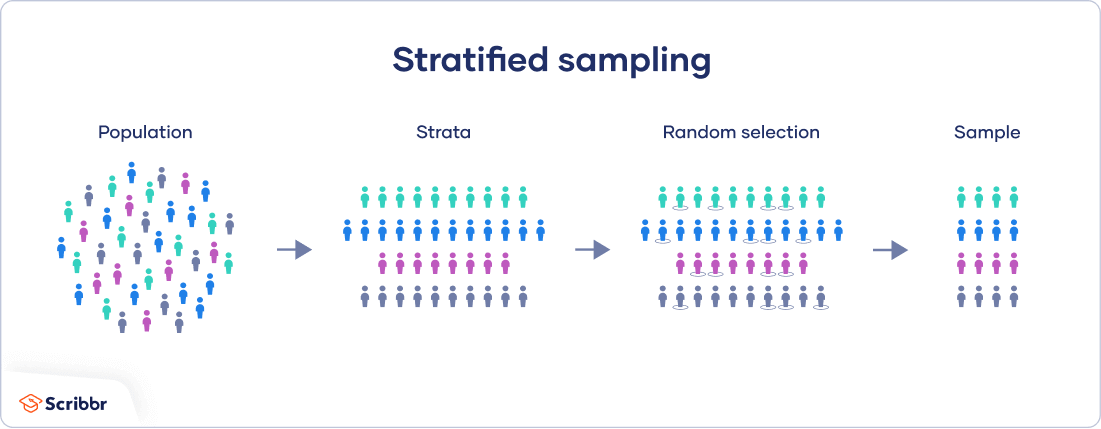
Stratified samples
Stratification is the process of identifying subpopulations or strata and then selecting objects or people for sampling in these subpopulations
Essential to gath data efficiently
Cluster sampling
Select a group of people or documents to study
Define what is meant by stratification of sampless?
researchers divide subjects into subgroups called strata based on characteristics that they share
The Sample Size Decision
Determine the attribute (the type of errors to look for)
Locate the database or reports in which the attribute can be found
Examine the attribute (Estimate p, the proportion of the population having the attribute)
Make the subjective decision regarding the acceptable interval estimate, i.
Choose the confidence level and look up confidence coefficient (z value) in a table
Calculate the standard error
standard error = i/z
Determine the sample size
n = p(1-p)/standard error²p + 1
What effect on sample size does using a greater confidence level have when sampling attribute data?
Confidence level
Desired degree of certainty, such as 95%. Once confidence is chose,, the confidence coefficient (also called a z value) can be looked up in a table similar to the one found in this chapter)
Calculate the Standard Error of the Proporrtion
sp= i/z
i = interval estimate
z = confidence coefficient found in the confidence level lookup table
Determine the sample size
standard error = i/z
n = p(1-p)/standard error²p + 1
1) Determine which attribute to sample
2) Find where data in stored
3) estimate p (proportion of population to set appropriate sample size)
4) interval estimate ±0.10 means analyst willing to accept an error of no more than 0.10 in either direction from the actual proportion,p
5) Confidence level is desired degree of certainty, such as 95%. Once chose, confidence coefficient (z value) can be looked up in a table
6)Take the parameters found or set in steps 3 through 5
7) Enter them into two equatios to eventually solve the required sample size
Example: Area Under Curve to find the necessary sample size
Determine that you will be looking for orders that contain mistakes in names, addresses, quantities, or model numbers.
Locate copies of order forms from the past six months.
Examine some of the order forms and conclude that only about 5 percent contain errors.
Make a subjective decision that the acceptable interval estimate will be
Choose a confidence level of 95 percent. Look up the confidence coefficient ( value) in Figure 5.2. The value equals .
A table of area under a normal curve can be used to look up a value once the systems analyst decides on the confidence level
What is the overriding variable that determines how many people a systems analyst should interview in depth?
The time an interview takes
A good rule of thumb is to interview at least 3 people at every level of the org and at least one from each of the org’s functional areas
Practice (1)
8%
CL = 99%
i = 0.02
Z = 2.58
How large a sample size should Leigh use to be 99% certain the interval estimate will be with + or 0.02?
8%
CL = 99%
i = 0.02
Z = 2.58
standard error = i/z = 0.02/2.58 = 0.00775
n(sample size) 0.08 × 0.92/(0.00775)² + 1. = 1,226
n = 1,226
How large a sample size should Leigh use to be 90 percent certaint he interval estimate will be with or 0.02
CL = 90%
i - 0.02?
Z = 1.65
Standard error = 0.02/1.65 = 0.01212
n = p(1-p)/standard error²p + 1
0.08(0.92)/0.0001468944 + 1 = 0.0736/0.0001468944 = 501.04 + 1 = 502
n = 502
Analyzing Quantitative Documents
Reports used for decision making
Sales reports
Production reports
Summary reports
Performance reports
Shows goals and trends
Records
Provides periodic updates of what is occurring in the business
Manually completed payment records
1. Check for errors in amounts and totals
2. Looking for opportunities fo riproving the recording form design
3. Observing the number and type of transactions
4. Watching for instances in which the computer can simplify the work through calculations and other data manipulation
Data capture forms
1. Collect examples of all type of forms in use
2. Note the type of form
3. Document the intended distribution pattern
4. Compare the intended distribution pattern with who actually receives the form
E-commerce and other transactions
Systematically Examining Quantitative Documents
Performance Reports
Indicate what’s going wrong and opportunities to improve
Records
Provides periodic updates of what is occurring in the business
Manually completed payment records
1. Check for errors in amounts and totals
2. Looking for opportunities fo riproving the recording form design
3. Observing the number and type of transactions
4. Watching for instances in which the computer can simplify the work through calculations and other data manipulation
Data Capture Forms
scanning paper forms, capturing information from invoices or insurance claims, extracting text from ID cards, and automatically recognizing handwritten characters. Technologies such as barcode scanners, document scanners, or OCR scanners enable such data capture.
Analyzing Qualitative Documents
Key or guiding metaphors
Insiders vs/ outsiders mentality
What is considered good vs evil
Graphics, logos, and icons in common areas or Web pages
A sense of humor
Email messages and memos
Signs or posters on bulletin board
Corporate Web sites
Manuals
Policy handbooks
Systematically Examining Qualitative Documents
Examine documents for key or guiding metaphors
Look for insiders versus outsiders or an “us against them” mentality
List terms that characterize good or evil and appear repeatedly in documents
Look for the use of meaningful messages and graphics posted on common areas or on web pages
Recognize a sense of humor if present
Memos
Analysis of memos provides insight into the metaphors that guid the organizations thinking
Values, attitudes, and beliefs
Signs or Posters on Bulletin Boards or in Work Areas
Posted signs reveal the official organizational culture
Corporate Websites
Must provide context required to go to next stage in process
Technical, Aesthetics, Managerial
Business to consumer ecommerce (B2C) as well as those used for business-to-business ecommerce (B2B) examine the contents for metaphors, humor, use of design features (color, graphics, animation, and hyperlinks)and the meaning and clarity of any messages provided
Manuals
Analyze manuals following the five guidelines spelled out previously. Remember that manuals present the “ideal” the way machines and people are expected to behave
Policy Handbooks
Address policies about computer servics, use, access, security, and charges
Using Text Analytics
Software that can analyze qualitative data from any unstructured written source including transcripts of interviews, written reports, or customers’ communication collected through email, wikis, blogs, chat rooms, etc.
Leximancer
performs keyword count, shows ranked cocnepts for Open Source Communities project
Process Mining
Unobtrusively and automatically gather data about processes from enterprise systems like SAP and others.
Record all activities, which are the data used in process mining
Steps to process mining:
Discover
Process mining appreads the data colllected from enter. systems and creates an event log
Optimize/Automate
Improvement takes place
Monitor
Systems anlayst needs to observe and determine what effect the optimize/automate phase had on the path
Act
Incentives to move forward with any changes that are needed based on previous steps
Workforce Analytics
Ensure the right workers are in the right place
Balancing the workload among the staff
Comparing workers’ or team’s performance
Realizing where bottlenecks in workflows occur
Determining which apps are used more than others
Realizing which apps deliver more productvity
Understanding application usage and website visits
Possible to identify what activities are consuming the most amount of time
Identify distractions
determine redundant functions
Identifying When and Why Workers Lose Focus
Useful in increasing future productivity and improve performance
Comparing the Performance of Teams
See how teams can improve for comparison
Observing a Decision Maker’s Behavior
Can see firsthand the relationships that exist between decision makers and other members of the org
Observing a Typical Manager’s Decision-Making Activities
Observation allows the analyst to see firsthand how managers gather, process, share and use info and tech to get work done
analyst playscript
actor [ decision maker
Observing The Physical Environment
Reveals their human info requirements
offices, workplace, HCI concerns
Structured Observation of the Environment
STROBE Method
Applying STROBE
Requrest an analys texplicitly observe seven concrete elements ocmmonly found in offices
STROBE
Structured
Observation of the
Business Environment
Text Mining
Leximancer
NVivo
Removes conjuncted words
Process Mining
Solutions
SAP
Salesforce
Oracle
Celonis
Steps
Discover
Optimize/Automate
Monitor
Other Decision Making Activities
Task mining
An unobtrusive desktop capture of the tasks performed by an organization’s employees