Lecture 2: Utility, Preferences & indifference Curves
 Call Kai
 Learn
Learn Practice Test
 Spaced Repetition
 Match
Match Flashcards
 Knowt Play
1/22

There's no tags or description
Looks like no tags are added yet.
Name | Mastery | Learn | Test | Matching | Spaced | Call with Kai | Chat |
|---|
No analytics yet
Send a link to your students to track their progress
23 Terms
Topic 1: Modeling Consumer Behavior
Consumption Bundles
A combination of 2 or more items, also called a “basket”
What do we assume about consumption bundles
1) People know what they like and can rank all possible consumption bundles by preference.
2)They pick the best bundle out of what they can afford.
Topic 2: Utility
Utility
A numerical score describing the amount of satisfaction one gets from a consumption bundle
Utility function
A mathematical formula that assigns a level of utility to all consumption bundles
Jeremy Benthams Assumptions About Utility (4)
1) Utility can be measured (units of measurement= utils)
2) We can compare and add up peoples utility
3) Society is better off when it maximizes overall happiness
4) for individuals: U= f(income)
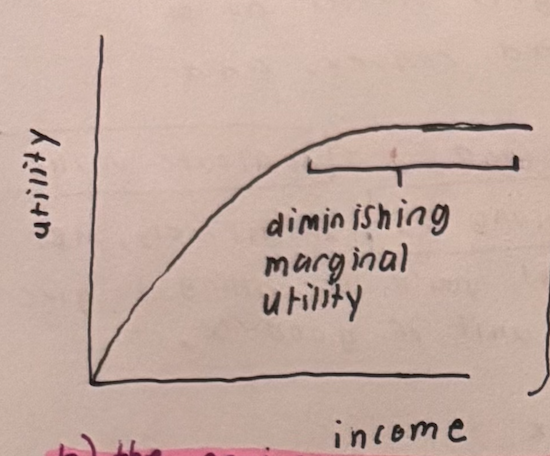
U= f(income) graphically

Marginal Utility (mu)
Intuition: For every unit increase in income, how much does your utility increase
Formula: mu= slope of above graph= first derivative = du/di
Graphically: du/di >0 because the slope is always

Diminishing Marginal Utility
Intuition: As individuals become more and more wealthy, the amount of utility they get from an increase in income begins to increase at a significantly lower rate; for example, the lifestyles of someone with 2.5 billion versus 2 billion would not vary so much, satisfaction-wise, because both people could reasonably afford everything they want.
Formula: this is exhibited by the second derivative (the rate at which the slope changes)- since the slope is decreasing the second derrivative will always be negative: d2u/ d2i < 0
Graphically: reference image
Historical Context: Shifting Ideas of Utility
19th century economists liked the idea of diminishing marginal utility but suggested that people get utility out of the goods they consume with their income, not just their income itself.
Formula: U= f(good1, good2, good3, ….)
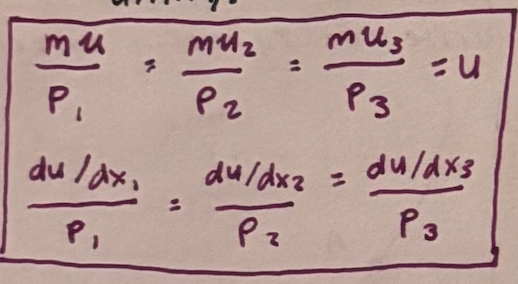
The equimarginal principle
Intuition
Mathematical rule for choosing the consumption bundle that maximizes utility,
Maximum satisfaction is obtained when an individual gets the same amount of satisfaction from the last unit of money spent on each commodity.
Formula
Reference image
Equimarginal Principle Practice Problem

Ordinal v. Cardinal Utility
When it comes to comparing the utility of differing consumption bundles ordinal utility (ordering things) rather than cardinal utility (utils of satisfaction/ magnitude).
Example of ordinal versus cardinal utility: see image

Why is ordinal utility preferred?
Ordinal Utility is the weaker assumption; however, it allows us to make “monotonic transformations”
A way of changing a set of numbers to a new set while keeping the same ordering from least to greatest.
see example photo

TOPIC 3:Assumptions about Indifference Curves (preferences)
1) Completeness
2) Transitivity
3) Non-satiation
4) DMRS
1) Completeness
For any bundles A and B, A is preferred to B (A>B), or B>A, or B~A. In other words you have complete information about the preference regarding the bundles.
2) Transivity
For bundles A, B, & C
If A > B
B > C
A > C
3) Non-satiation
Non-satiation- an individual always prefers more of a good or service rather than less.
How does non-satiation justify why IC’s never slope upward
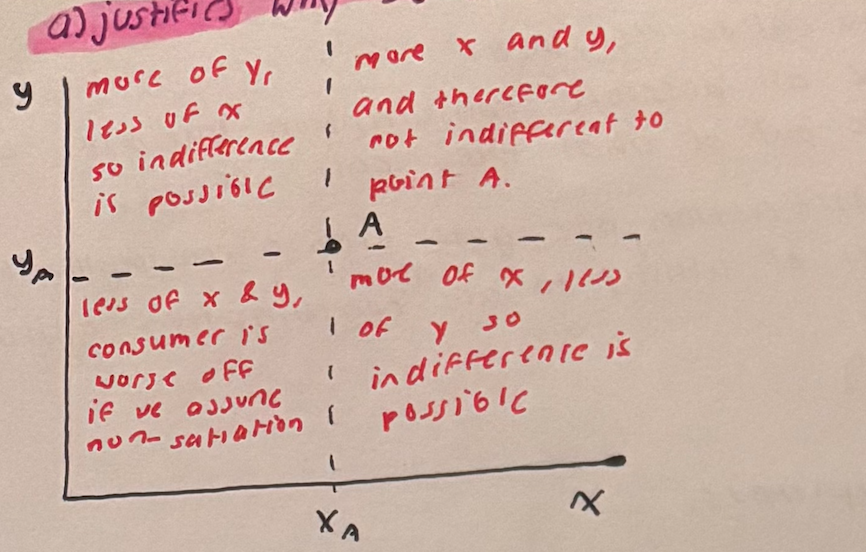
How does non-satiation and transitivity justify why IC’s never cross?

4) Diminishing Marginal Rate of Substitution (DMRS)
Marginal Rate of Substitution:
Intuitively: MRS= the amount of good Y that you’d be willing to give up in order to get one more unit of good X.
Formulaically: MRS= absolute value of the slope of IC= -dy/dx along IC.
Diminishing Marginal Rate of Substitution (DMRS):
The slope of the IC gets flatter as x increases; the implications of this are that IC’s are smooth and convex, and averages are preferred to extremes (see red line in attached image).

Topic 4: MRS and Marginal Utility (mu) relationship
