Chapter 6: Normal curve, standardization and Z scores
1/22
There's no tags or description
Looks like no tags are added yet.
Name | Mastery | Learn | Test | Matching | Spaced |
|---|
No study sessions yet.
23 Terms
What does the normal curve represent?
the curve represents all the possible values that the variable X can take on likelihood or relative frequency, that X takes on that value
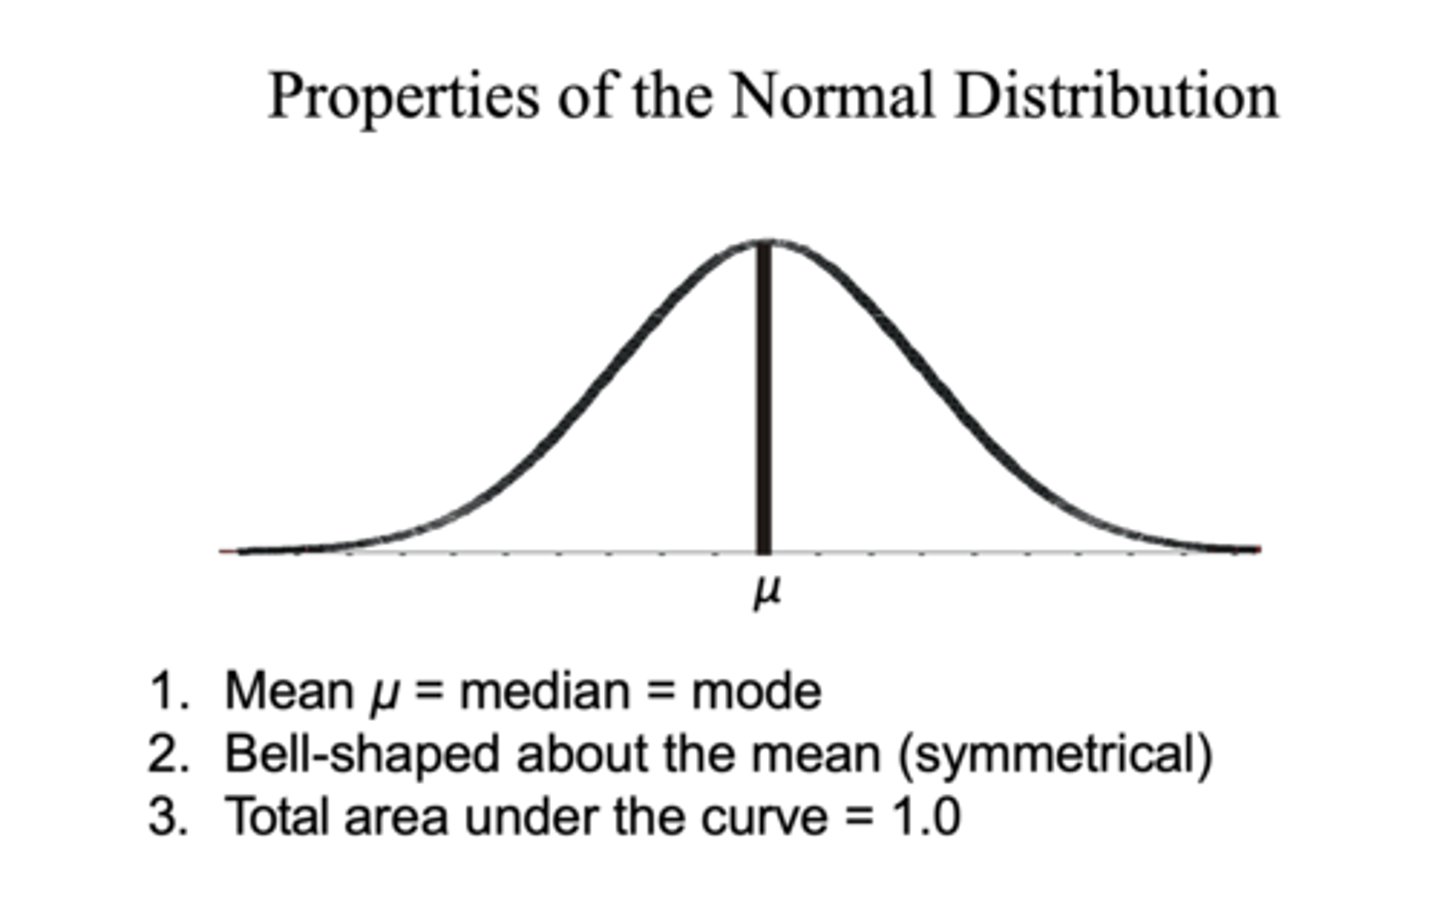
properties of the normal distribution:
1. Symmetric about the mean
- mode, median, and mean are at the same point
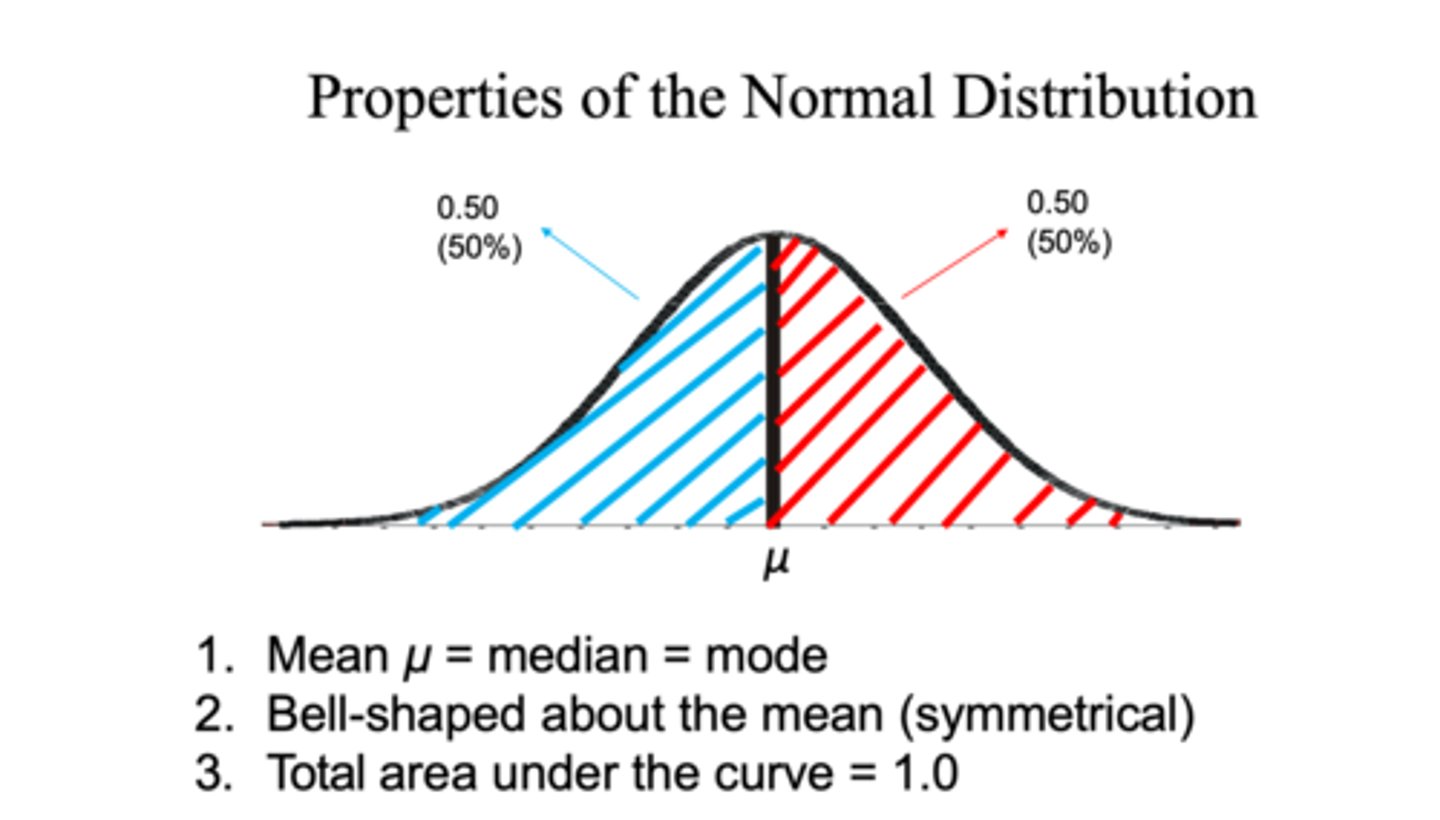
- the area under the curve to the right of the mean is equal to the area under the curve to the left of the mean (area= 0.5)
2. the curve approaches, but never touches zero
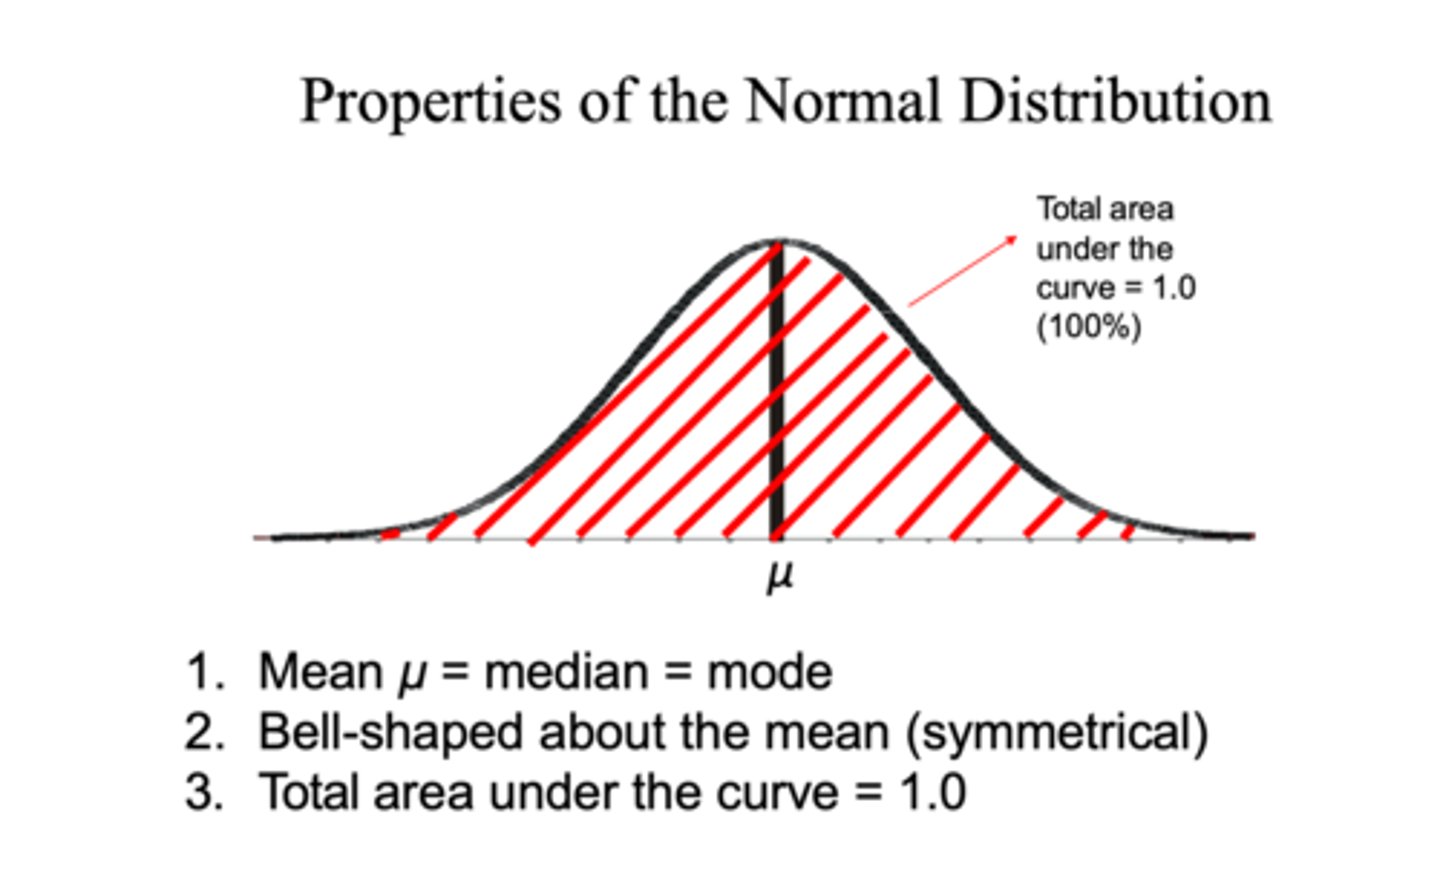
3. the area under the curve is exactly 1 by definition
properties of normal distribution
-Symmetric about the mean
-Mode, median, and mean are at the same point
-Area under the curve and to the right of the mean is equal to area to left of mean
-Curve approaches but does not touch zero
-Area under the curve is exactly 1
properties of normal distribution
1. Symmetric about the mean
- mode, median, and mean are at the same point
- the area under the curve to the right of the mean is equal to the area under the curve to the left of the mean (area= 0.5)
2. the curve approaches, but never touches zero
3. the area under the curve is exactly 1 by definition
Standardization
a way to convert individual scores from different normal distributions to a shared normal distribution with a known mean, standard deviation, and percentiles
a Z score
the number of standard deviations a particular score is from the mean
the only information we need to convert any raw score into a Z score is the?
the mean and standard deviation of the population of interest
the Z distribution always has a mean of?
and a standard deviation of?
0 and 1
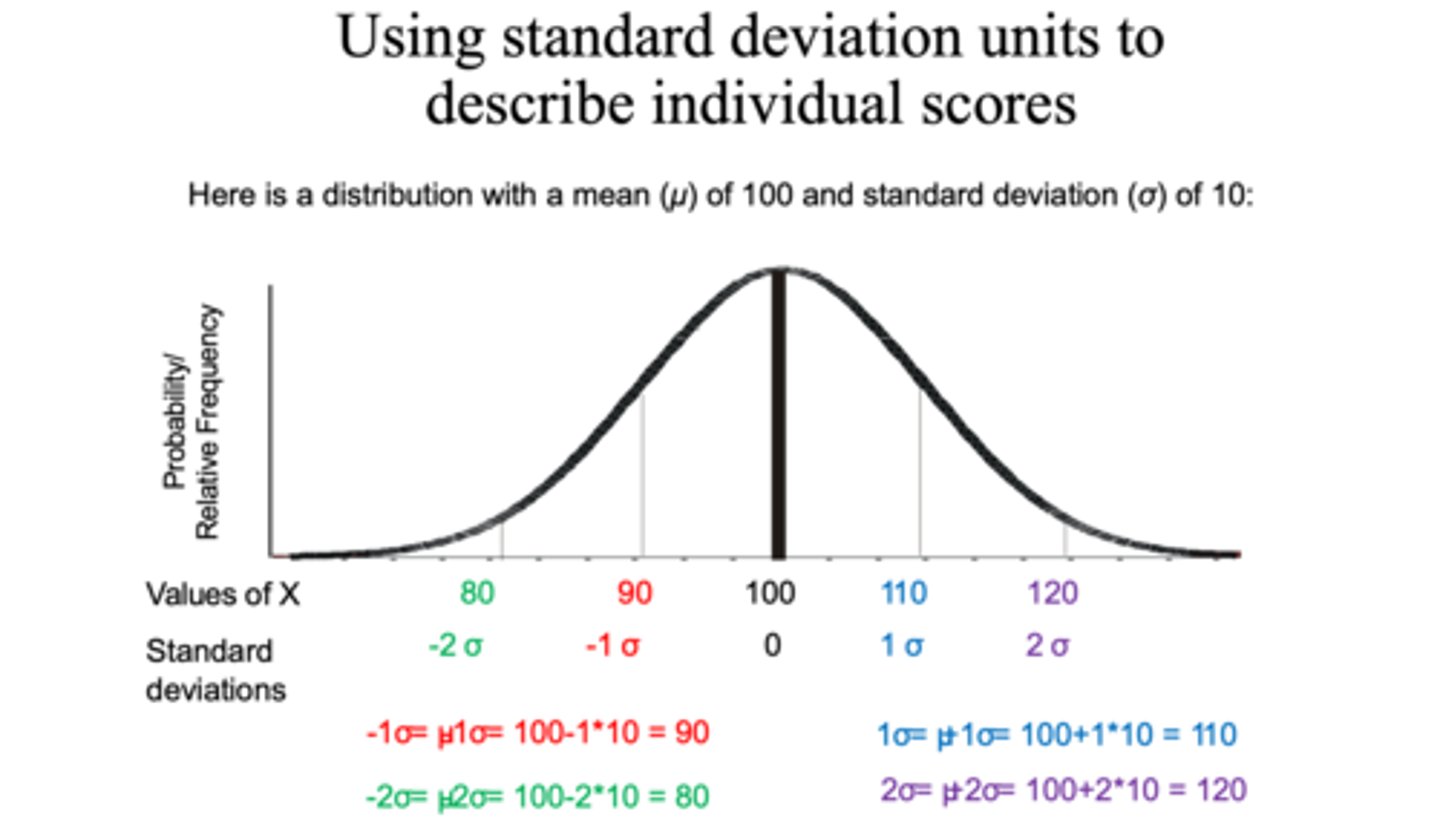
using Standard deviation units to describe individual scores
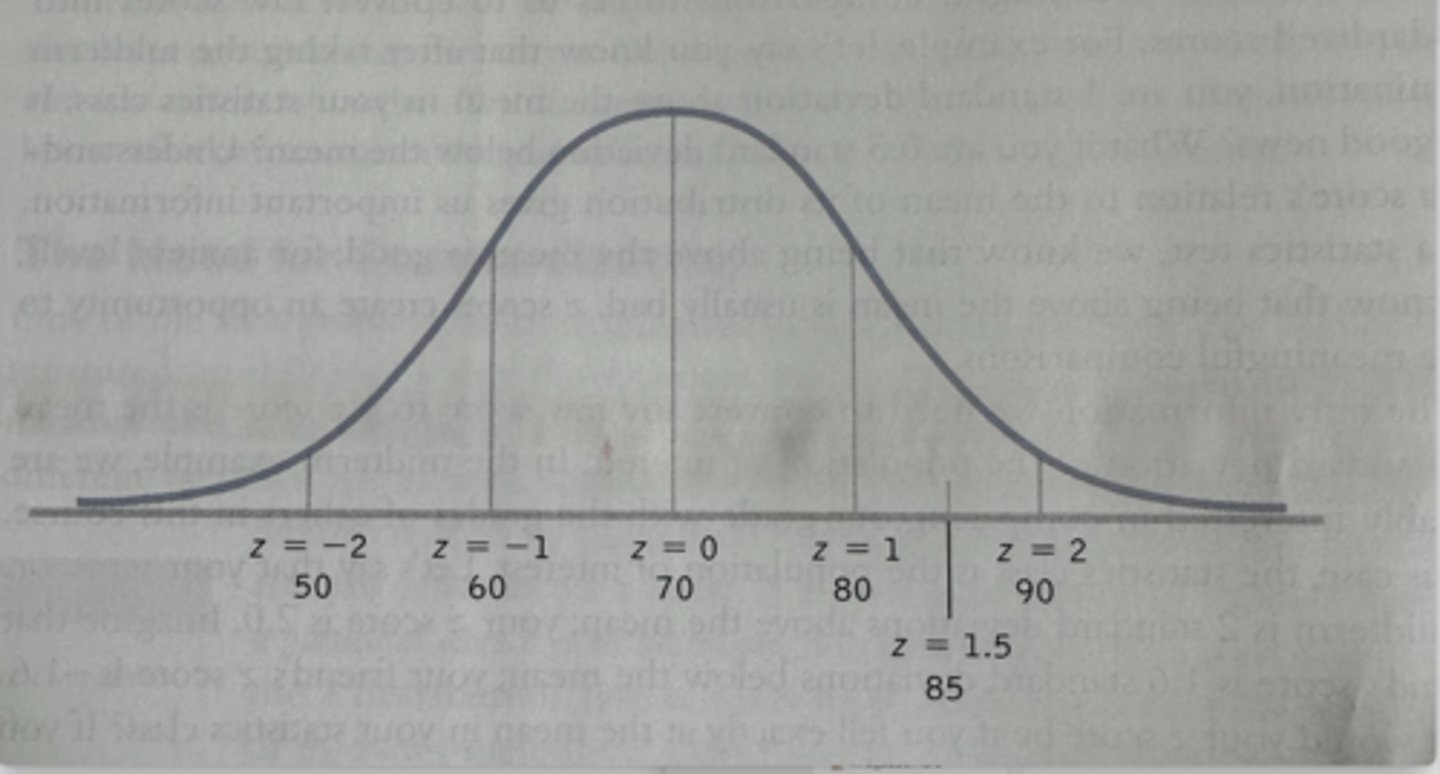
Calculating Z scores example:
a)if the mean on the statistics exam is 70, and the standard deviation is 10, and your score is 80, what is your Z score?
b) now let's say your score is 50, which is 20 points or 2 standard deviations, below the mean, so your z score will be?
c) what if your score is 85?
a) in this case you are exactly 10 points, or 1 standard deviation above the mean, so your Z score is 1.0
b) -2.0
c) now you're 15 points or 1.5 standard deviations above the mean so your Z score is 1.5
calculating a particular Z score with a formula:
step1) determine the distance of a particular person score (X) from the population mean (𝝁): (X-𝝁)
step 2) express the distance in terms of SD by dividing the population standard deviation 𝝈
-formula is: Z = (X-𝝁) / 𝝈
(transforming raw scores into Z scores)
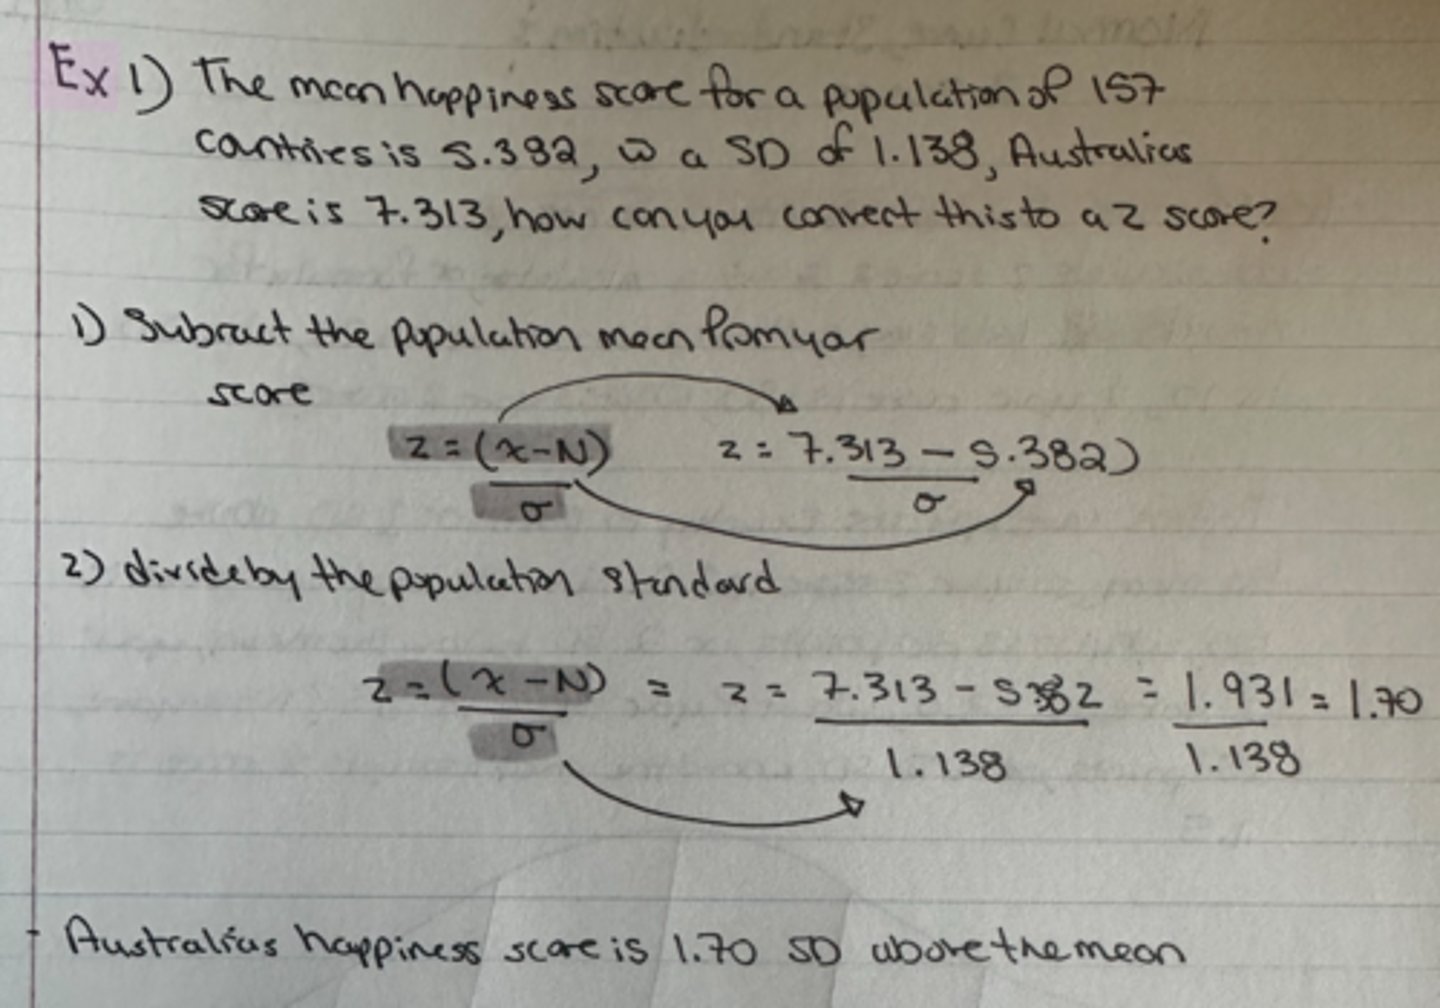
The mean happiness score for a population of 157 countries is 5.382, with an SD of 1.138, Australia's score is 7.313, how can you convert this score into a Z score?
Australia's happiness score is 1.70 SD above the mean
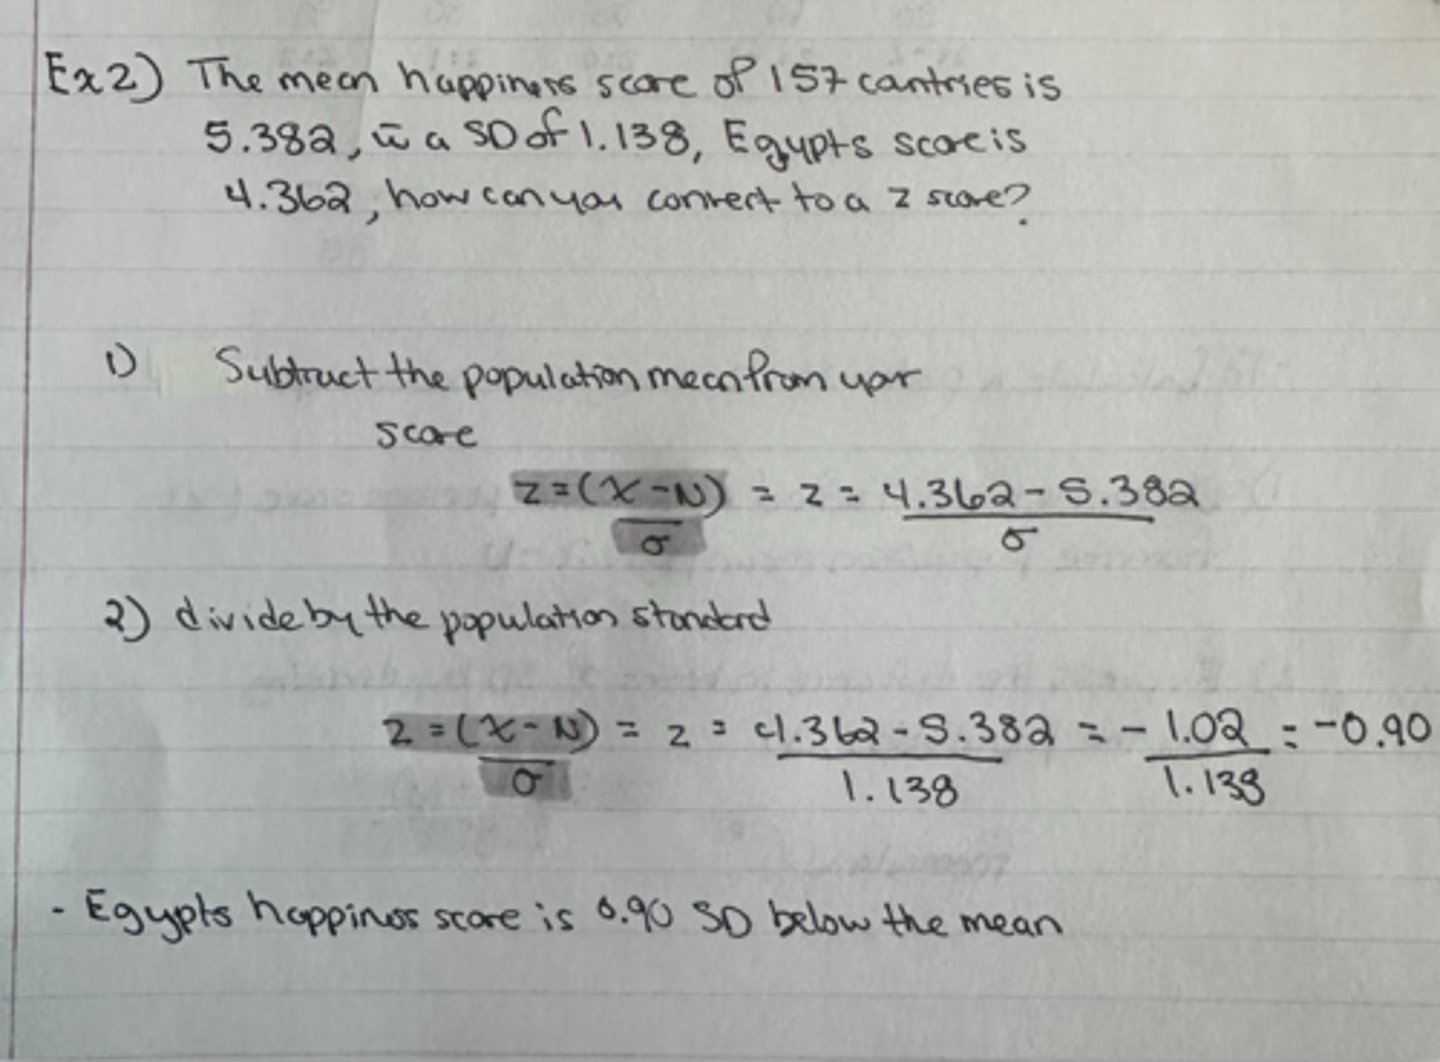
(transforming raw scores into Z scores)
The mean happiness score for a population of 157 countries is 5.382, with an SD of 1.138, and Egypt's score is 4.362, how can you convert this into a Z score?
Egypt's happiness score is 0.90 SD below the mean
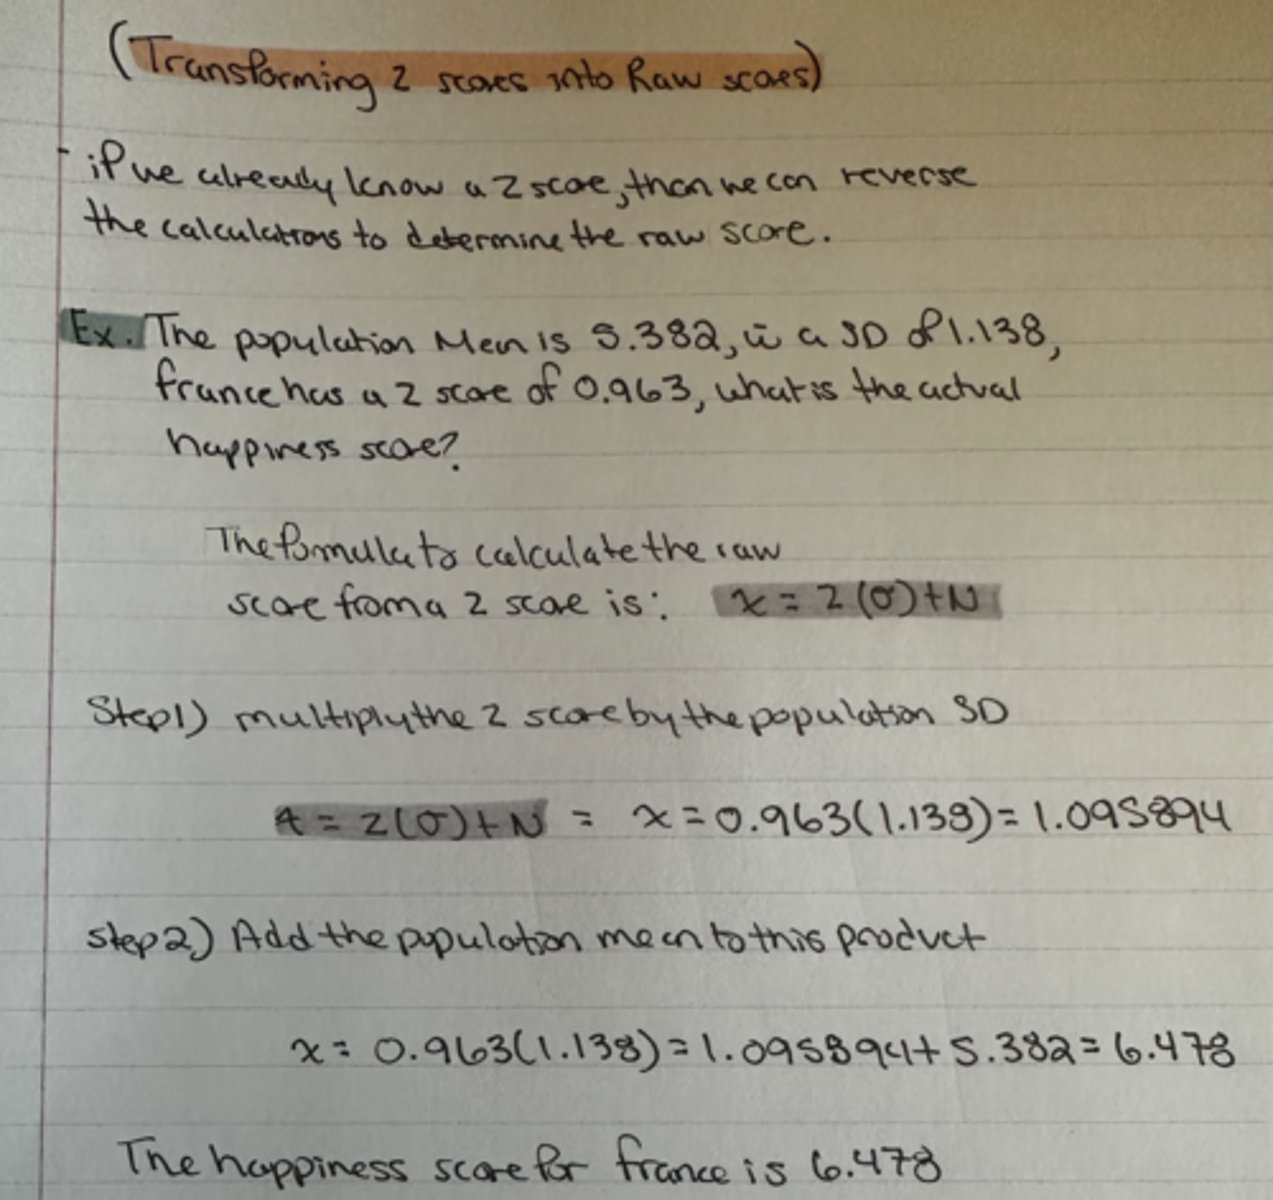
(Transforming z Scores into Raw Scores)
the population mean is 5.382, with an SD of 1.138, France has a Z score of 0.963, what is the actual happiness score?
the happiness score for France is 6.478
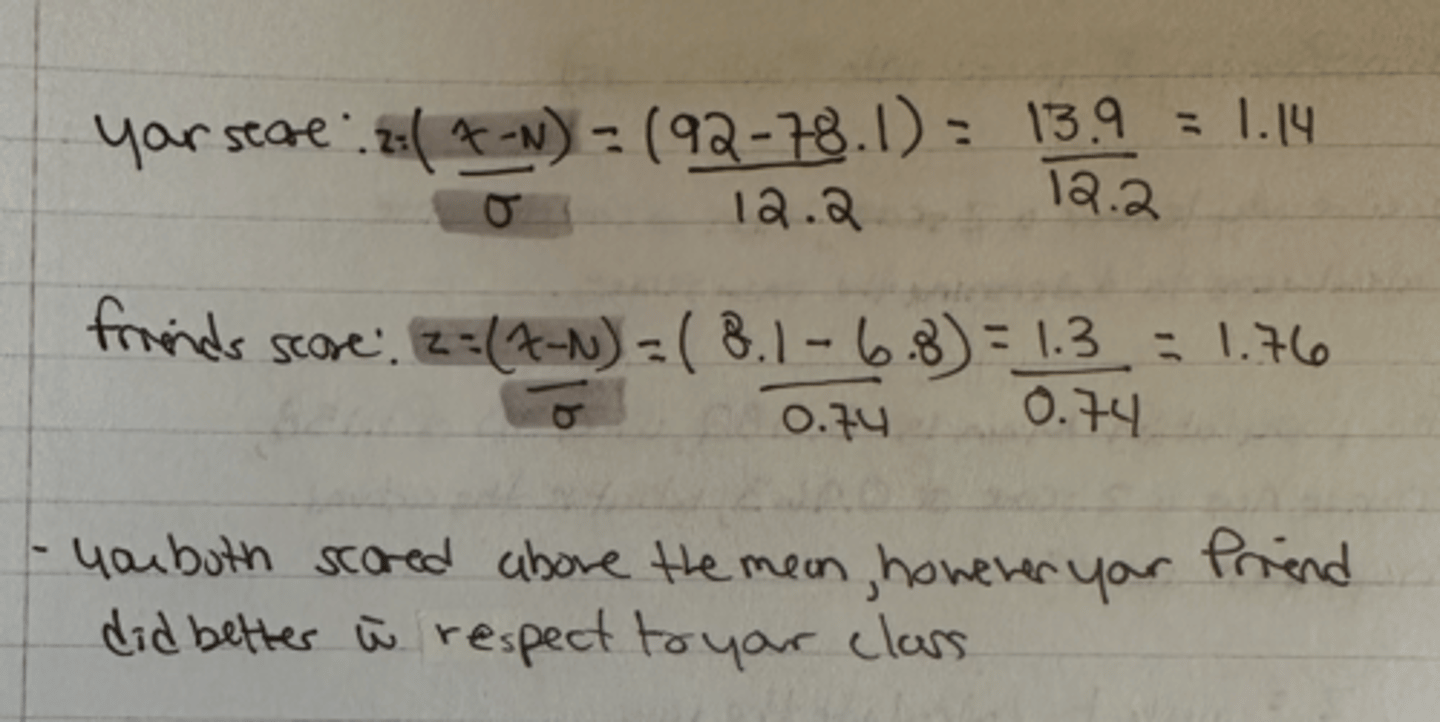
(comparing z scores w each other even when the underlying raw scores measured in different form)
you and your friend took a quiz, you earned 92 of 100, the distribution mean had a 78.1 and a SD of 12.2, your friend earned 8.1 out of 10, the distribution of his class had a mean of 6.8 and a SD of 0.74, again were only interested in the classes that took the test, so these are populations, who did better?
you both scored above the mean, however your friend did better with respect to his class
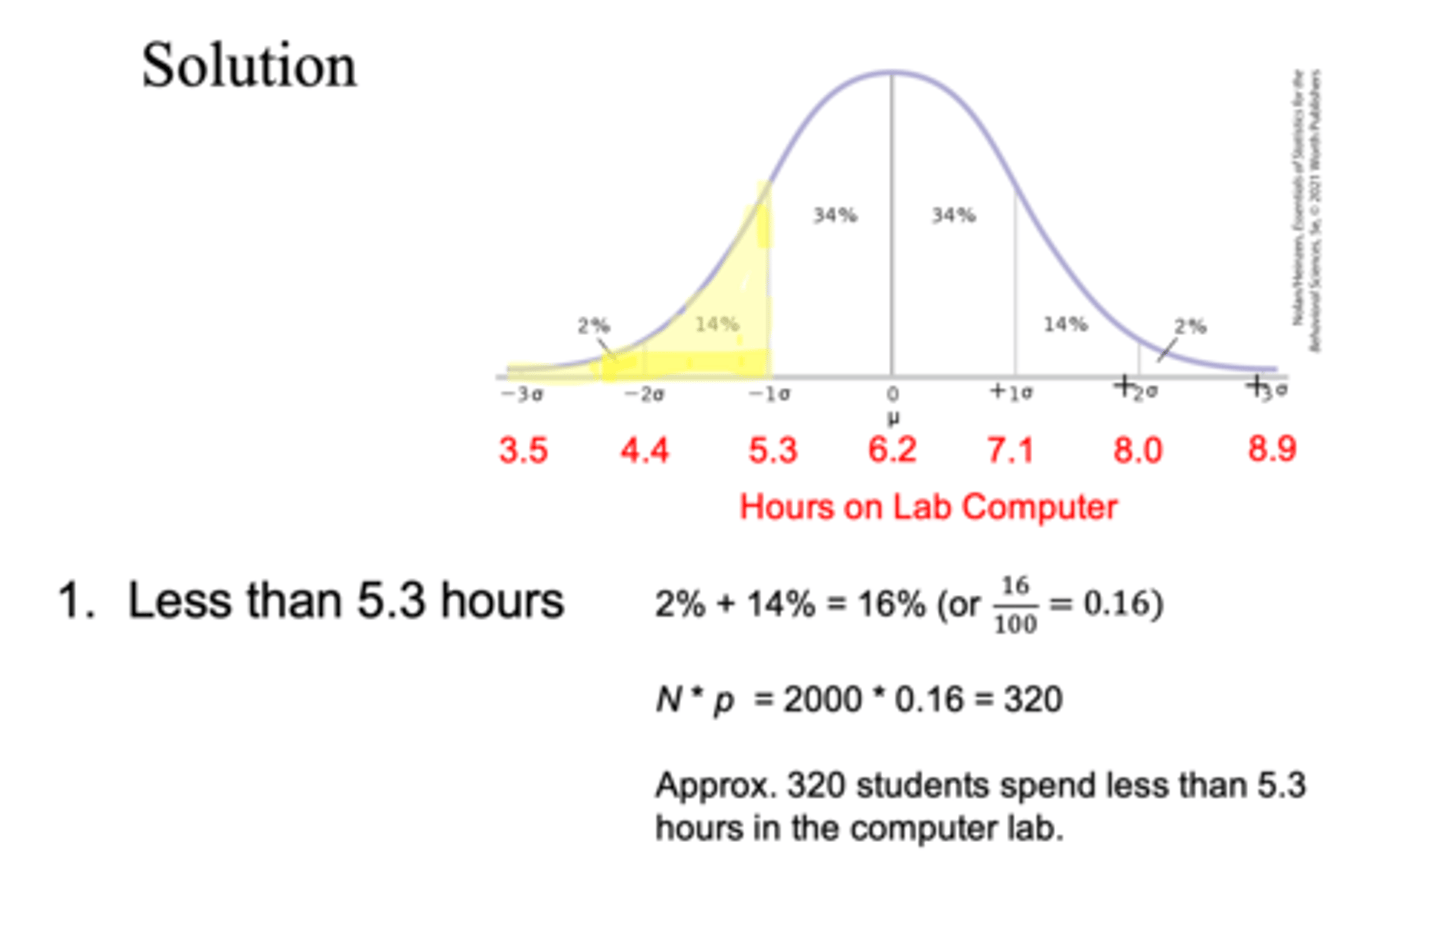
the time per week a student uses the lab is normally distributed, with a mean of 6.2 hours, and a SD of 0.9 hours, you are planning a schedule for the computer lab, of the 2000 students. estimate the number of students who will use the lab computer for less than 5.3 hours?
approx 320 students will spend less than 5.3 hours in the computer lab
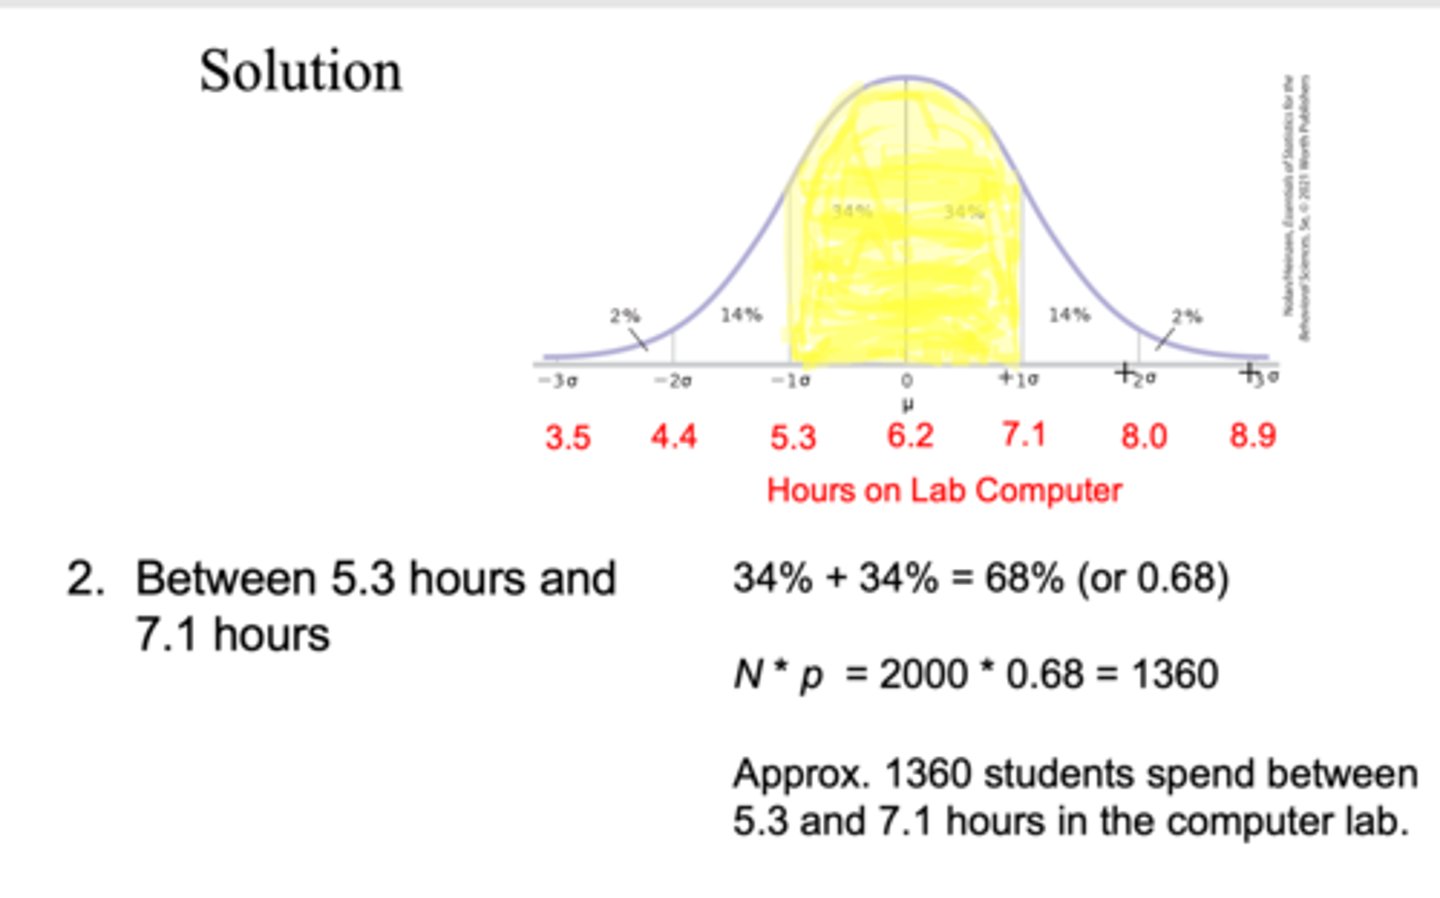
the time per week a student uses the lab is normally distributed, with a mean of 6.2 hours, and a SD of 0.9 hours, you are planning a schedule for the computer lab, of the 2000 students, estimate the number of students who will use a computer lab between 5.3 hours and 7.1 hours?
approx 1360 students spend between 5.3 and 7.1 hours in the computer lab
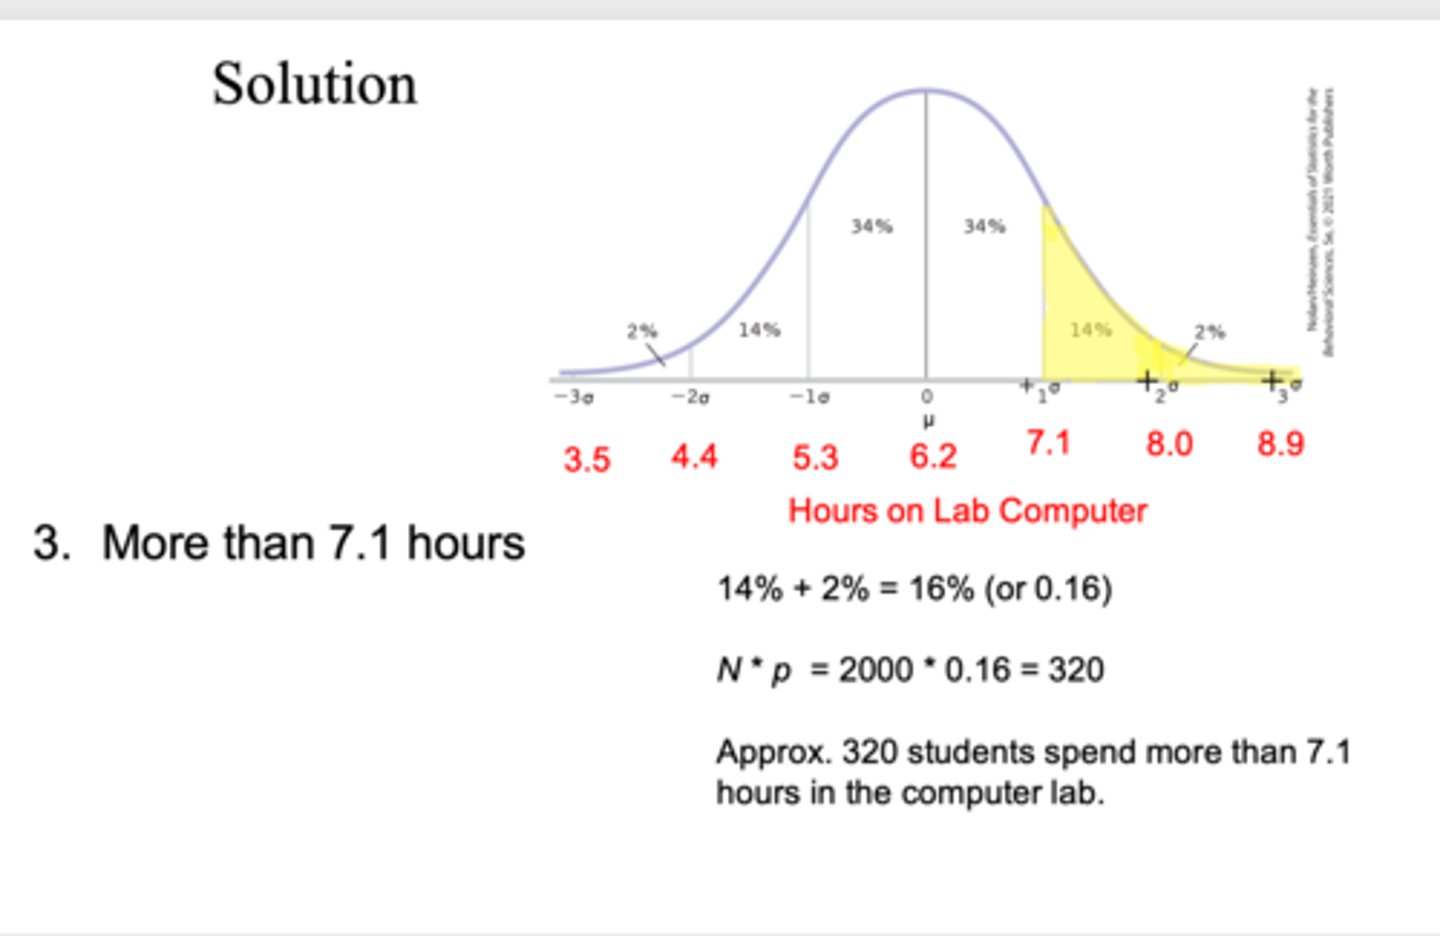
the time per week a student uses the lab is normally distributed, with a mean of 6.2 hours, and a SD of 0.9 hours, you are planning a schedule for the computer lab, of the 2000 students, estimate the number of students who will spend more than 7.1 hours in the computer lab?
approx 320 students spend more than 7.1 hours in the computer lab
what does it mean to say that the normal curve is unimodal and symmetric?
Unimodal means there is one mode or high point to the curve, symmetric means the left and right sides of the curve have the same shape and are mirror images of each-other
describe the process of standardization?
we convert individual scores to standardized scores for which we know percentiles.
what do the numeric value and the sign (negative or positive) of a z score indicate?
The numeric value tells us how many standard deviations a score is from the mean of the distribution. the sign tells us whether the score is above or below
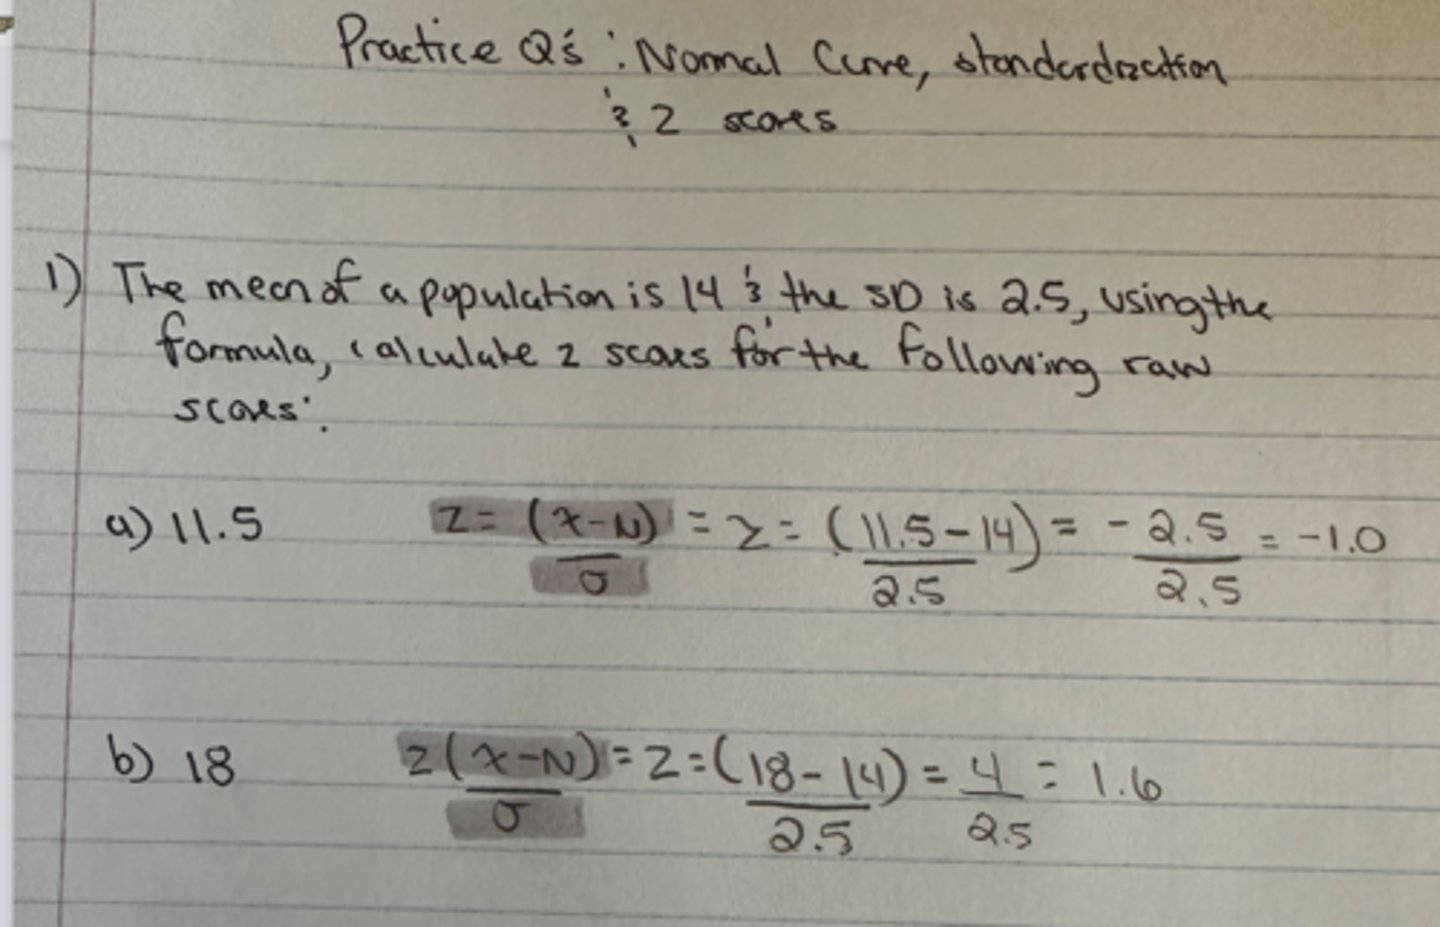
the mean of a population is 14, and the SD is 2.5, using the formula, calculate the Z scores for the following raw scores:
a) 11.5
b) 18
a) -1.0
b) 1.6
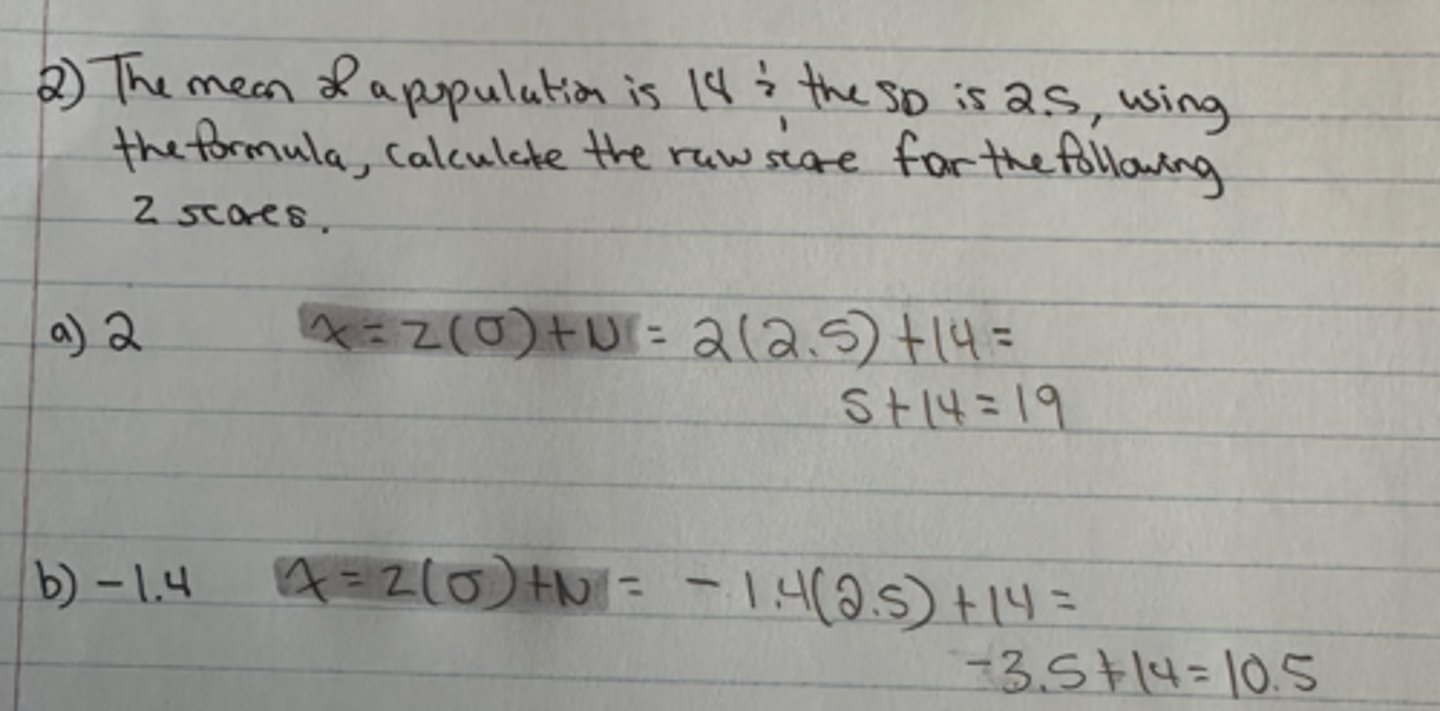
the mean of a population is 14, and the SD of 2.5, using the formula what is the raw score for the following z scores:
a)2
b)-1.4
a) 19
b) 10.5