Math TEAS
1/60
There's no tags or description
Looks like no tags are added yet.
Name | Mastery | Learn | Test | Matching | Spaced | Call with Kai |
|---|
No analytics yet
Send a link to your students to track their progress
61 Terms
Integer
Any positive or negative whole number, include zero
Does not include fractions, decimals or mixed numbers (7x3/4)
Prime number
Any whole number greater than 1 that has only two factors: itself and 1
E.g. 3, 5, 7, 13…
Composite number
Any whole number that is not a prime number
Even number vs Odd number
Can be divided by 2; cannot be divided by 2
Decimal number
Any number that uses a decimal point
E.g. 1.2456
Decimal place
The position of a number to the right of the decimal point
E.g. 0.143
1 - tenths
4 - hundredths
3 - thousandths
Rational vs irrational numbers
Rational - include all integers, decimals and fractions
Irrational - cannot be written as a fraction or decimal, because the number of decimal places is infinite and there is no recurring pattern of digits
E.g. pi number 3.141592…
Real numbers
All irrational and rational numbers
Whole number
Can only be zero or positive natural numbers, but integers can also be negative natural numbers
Explain the number 4,546.09, location of each number and reading:
4: thousands
5: hundreds
4: tens
6: ones
0: tenths
9: hundredths
Reading: four thousand five hundred and forty-six and nine hundredths
Factors are numbers that are multiplied together to obtain a __________.
Product
Define common factor vs prime factor
Common factor is a number divided into two or more other numbers.
E.g. Factors of 12 are 1,2,3,4,6,12
Factors of 15 are 1,3,5, 15
Common factors of 12 and 15 are 1 and 3
Prime factor is also a prime number.
E.g. prime factors of 12 are 2 and 3
Greatest common factor (GCF)
GCF is the largest number that is a factor of two or more numbers.
E.g. Factors of 15 are 1,3,5,15
Factors of 35 are 1,5,7,35
GCF of 15 and 35 is 5
LCF is going to be the smallest number that is a factor of two or more numbers. Using the above example the LCF of 15 and 35 is 1
Lowest common multiple (LCM)
LCM is the smallest number that is a multiple of two or more numbers.
E.g. Multiples of 3 are 3,6,9,12,15,etc
Multiples of 5 include 5,10,15,20, etc
The LCM of 3 and 5 is 15
**To find the LCM of two numbers, just divide the answer by both numbers and see which one is divisible by both.
The result of an addition is the _________.
The result of a subtraction is the _________.
The result of a multiplication is the ________.
The result of a division is the _________.
A) Sum
B) Difference
C) Product
D) Quotient
PEMDAS
Parenthesis, exponent, roots, multiplication, division, addition and subtraction
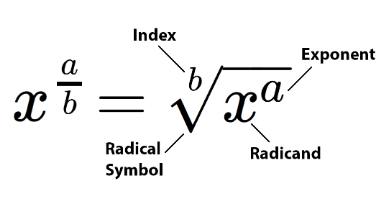
How to simplify roots. Talk about the name of the three components of the root.
The number on the outside is called index (e.g. 3)
Define a fraction
(X/Y)
A fraction is a number that is expressed as one integer written above another integer. Top number is the numerator and bottom number is the denominator. Denominator cannot be 0.
Fractions written differently can be equivalent such as (2/10) = (3/15)
Proper vs improper fraction
A fraction whose denominator is greater than its numerator is known as proper fraction.
Fraction in which the numerator is greater than its denominator is known as improper fraction.
A mixed number contains both an integer and a fraction.
E.g. 1(3/5) = 1 + (3/5) = 5/5 + 3/5 = 8/5
Adding or subtracting fractions:
Must have the same denominator
(1/2)+(1/4) = (2/4 +1/4) = 3/4
Multiplying Fractions
Dividing Fractions
Multiplying Fractions
(1/3) x (2/3) = (1×2/3×3) = 2/9
Dividing Fractions
(2/3)/(3/4) = (2/3)x(4/3) = (8/9)
Writing a Decimal
0.24 = 24/100 = 6/25
Irrational number examples
Square roots and pi
A proportion is a relationship between two quantities that dictate how one changes when the other changes. Can be direct proportion (same direction) or indirect proportion (opposite direction).
Matt drives his car 62 miles per hour on a 250-mile road trip from Arizona to California. He travels at a consistent speed the entire way. What is the constant of proportionality in this scenario?
62 miles
y=kx, in which y is the distance, 62 is the x and k is the hour.
Ratio is a comparison of two quantities in a particular order. E.g. student to computer ratio is 20:14
What is not a proper way to write a ratio: A) 3/2; B) 3 over 2; C) 3:2; D) 3 to 2
Constant of proportionality exists when two quantities have a personal relationship. Represented by t = pn, in which p is constant.
For example, if the constant of proportionality is the price of lemons ($0.25/per lemon), then you can find the final cost based on the variable number of lemons you buy
Unit rate expresses a quantity of one thing in terms of one unit of another. For example, $2.75 for 5 eggs, unit rate is $0.55/egg

How to calculate the slope. Slope is between two consecutive points in a graph. If graph line is upward, slope will be positive. If graph line is downward, slope will be negative. Turn around to learn how to determine slope-intercept formula calculation
If two lines have the same slope, they are said to be perpendicular.
Remember, the Y number is always the second number within the parenthesis.
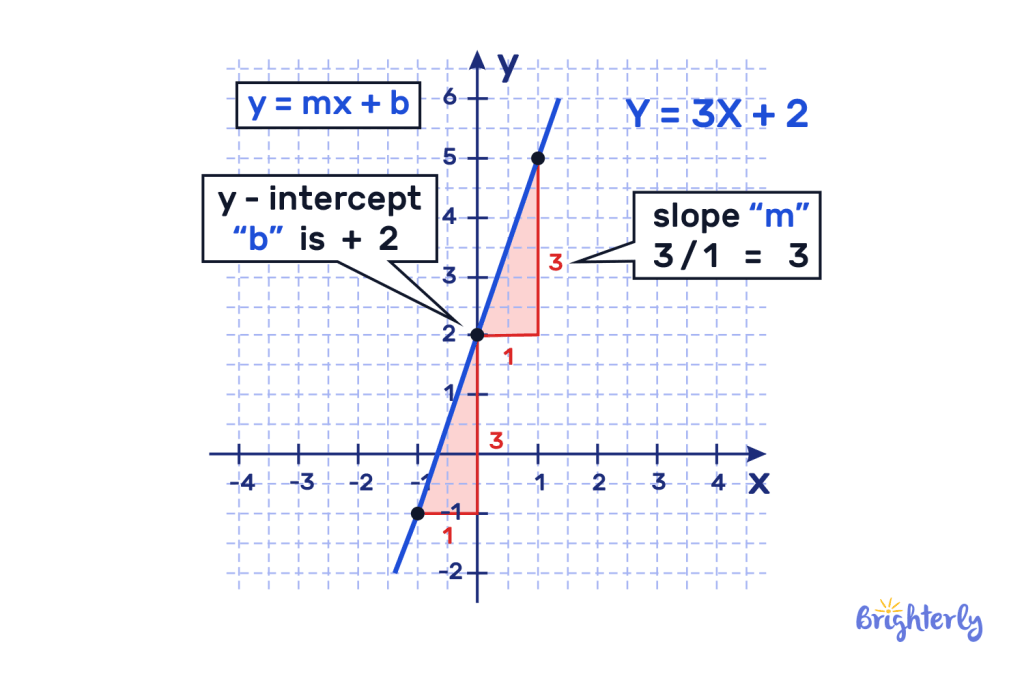
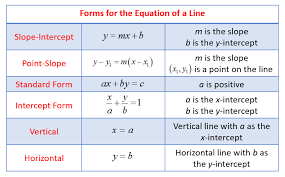
For standard form the slope is -A/B and the y-intercept is C/B
t = 1t, 1 is the constant term while t is the variable term
A single variable linear expression has only one variable term. E.g. 5x - 3 = 0
The equation ax + b =0 is referred to as one variable linear equation, in which the solution the root. E.g. 5x + 10 =0, the root is x = -2
The solution set comprises all solutions possible for one equation. When no solution is available if called an empty set.
Mathematical expressions that do not equal each other are called inequality. For example, 7x > 5.
If you multiply or divide inequalities by a negative number, the sign will flips sides, for example from > to <
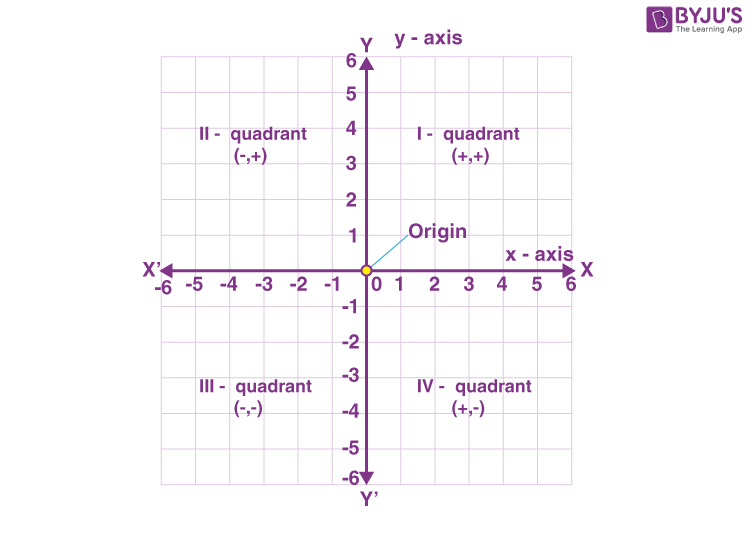
Cartesian coordinate plate is used to show equations graphically.
Precision vs Accuracy vs Error
Precision - how reliable and repeatable the measurement is. (E.g. if I measure the amount of cells collected from the same volume)
Accuracy - how close the data is to the correct data. E.g. if people try to guess my height
Error - the amount of error in a physical measurement. Can be expressed as number ± (SD)
Rounding vs estimation
Rounding - reducing the digits in a number while still trying to keep the value similar
Estimation - use rounding to estimate the approximate value of the equation
All numbers must be rounded the same for an estimation!!
1 ft = ____ in
1 in = ____ cm.
1 ft2 = ____ in2 = ____ cm2
1 m = ____ cm
1 yd = ____ ft = ____ in = ____ m
1 mi = ____ ft (mile) = ____ km
1 ac = ____ yd2 acre
1 mi2 = ____ acres
1 m - ____ mm
1 mm = ____ um
1 km = ____ m = _____ cm
1 ft = 12 in
1 in = 2.54 cm.
1 ft2 = 1 ft2 × 12 in x 12 in = 144 in2 = 929.03 cm2 (144× 6.452)
1 m = 100 cm
1 yd = 3 ft = 36 in = 0.914 m
1 mi = 5280 ft (mile) = 1.609 km
1 ac = 4840 yd2 acre
1 mi2 = 640 acres
1 m - 1000 mm
1 mm = 1000 um
1 km = 1000 m = 100000 cm
Giga = ______
Mega = ________
Kilo = _________
Deci = _________
Centi = _________
Milli = ___________
Micro = ____________
Giga = 1 billion
Mega = 1 million
Kilo = 1 thousand
Deci = 1-tenth
Centi = 1-hundredth
Milli = 1-thousandth
Micro = 1-millionth
1 fluid oz = _____ mL
1 cup = _____ oz
1 pint (pt) = _____ oz
1 quart (qt) = _____ pints = _____ oz
1 gallon (gal) = _____ qt = _____ pt = _____ oz
1 tsp = _____ ml
1 tbps = _____ ml
1 cubic centimeter (cc) = _____ ml
1 L = ______ mL
1 fluid oz = 29.573 mL
1 cup = 8 oz
1 pint (pt) = 16 oz
1 quart (qt) = 2 pints = 32 oz
1 gallon (gal) = 4 qt = 8 pt = 128 oz
1 tsp = 5 ml
1 tbps = 15-16 ml
1 cubic centimeter (cc) = 1 ml
1 L = 1000 mL
1 oz = _____ g
1 lb = ______ oz = ______ kg
1 ton (tn) = _______ lb = _______ kg
1 oz = 28.35 g
1 lb = 16 oz = 0.4536 kg
1 ton (tn) = 2000 lb = 907.2 kg
C → F (1.8 x oC) + 32
F → C 0.55 (oF - 32)
How to calculate unique diagonals:
n(n-3)/2
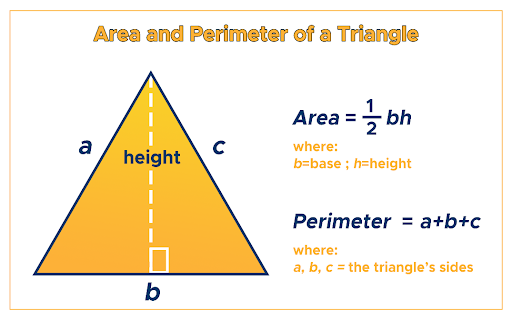
Triangles
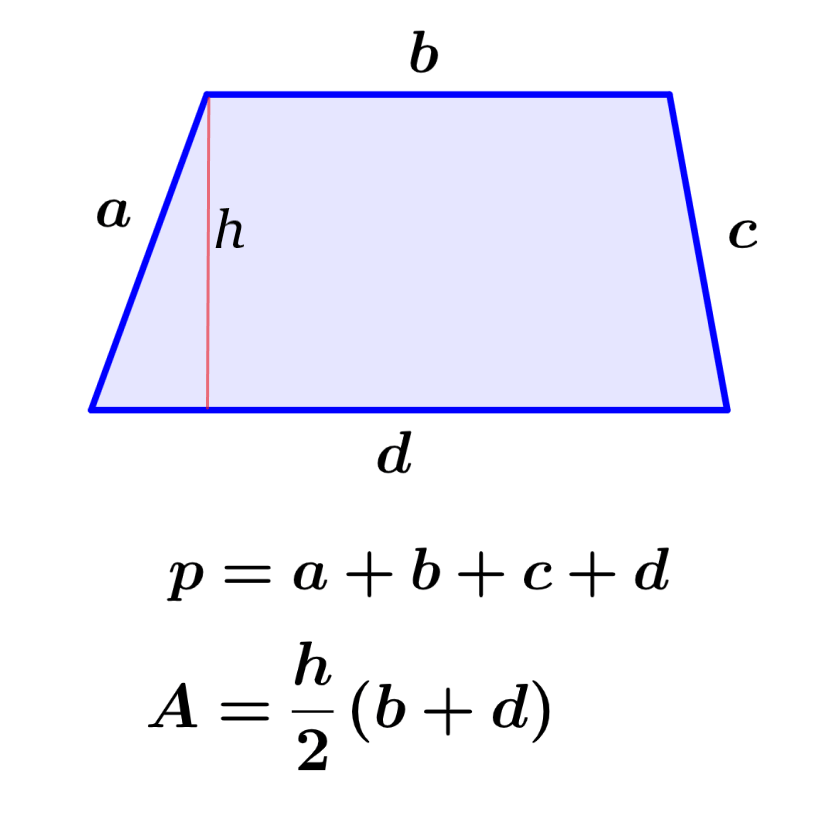
Trapezoids are a type of quadrilaterals.
A=1/2H(b + d)
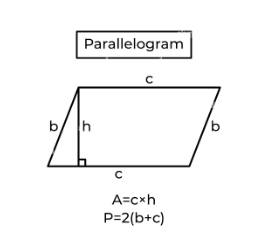
Parallelogram
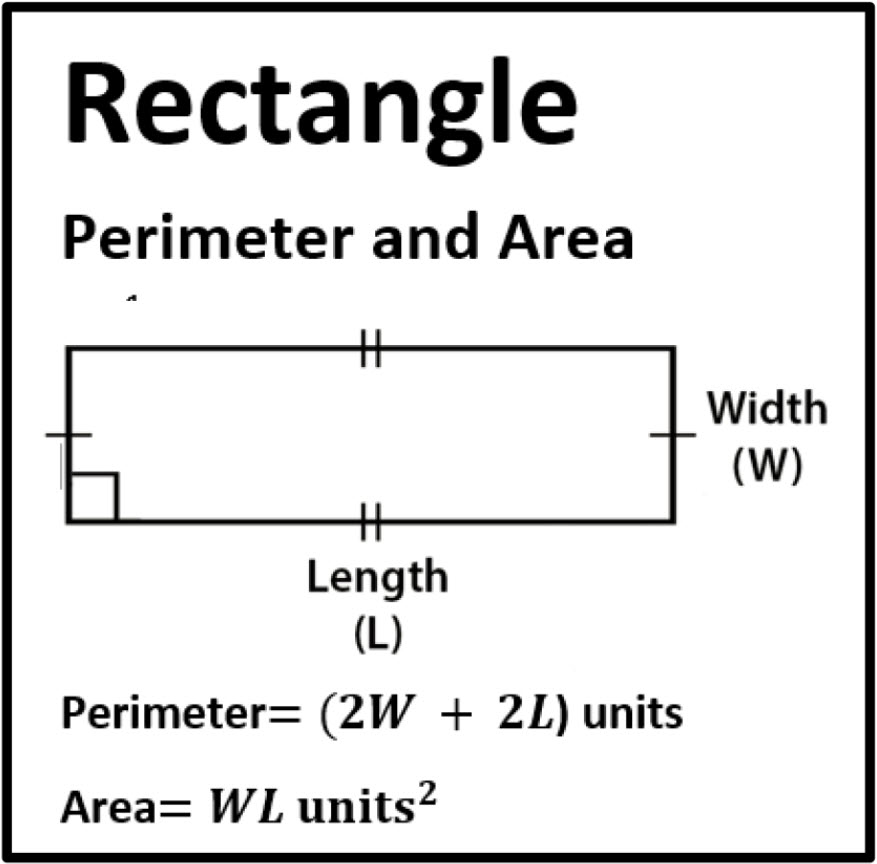
Rectangles: all rectangles are parallelograms and trapezoids
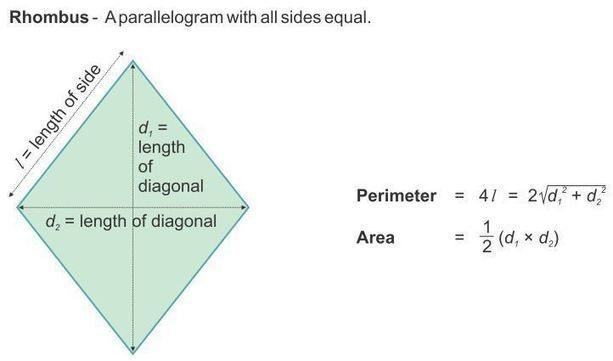
Rhombus: all rhombuses are parallelograms and kites
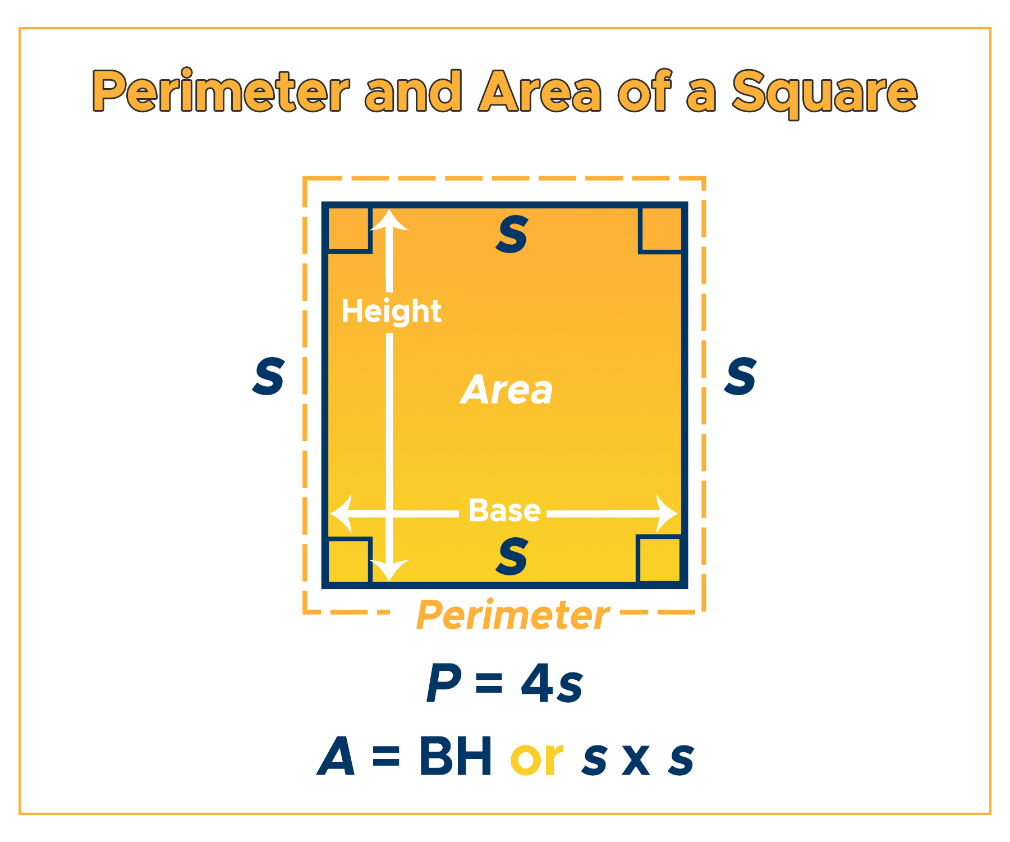
Square
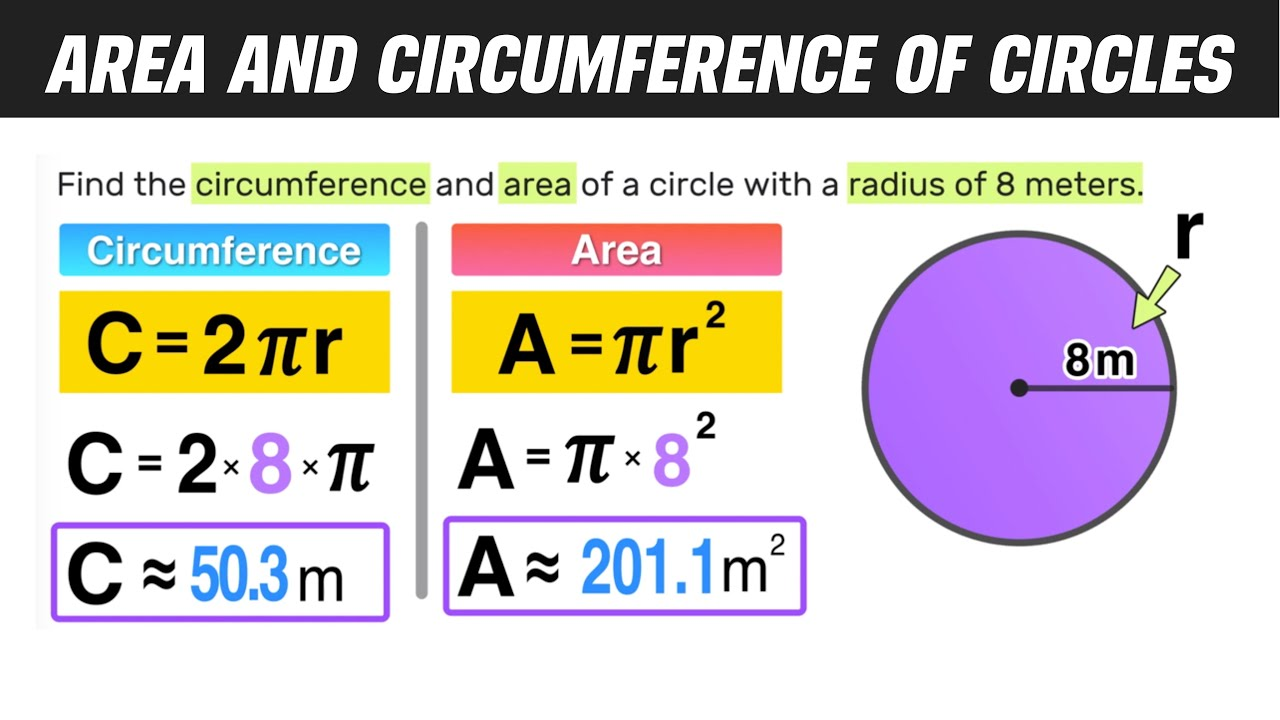
Circle
The center of a circle is the single point from which every point on the circle is equidistant.
Diameter is equal to 2x the radius of the circle.
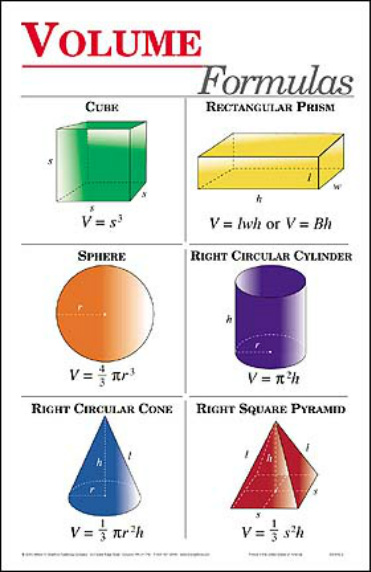
Volumes Formula
Review from book, some are wrong
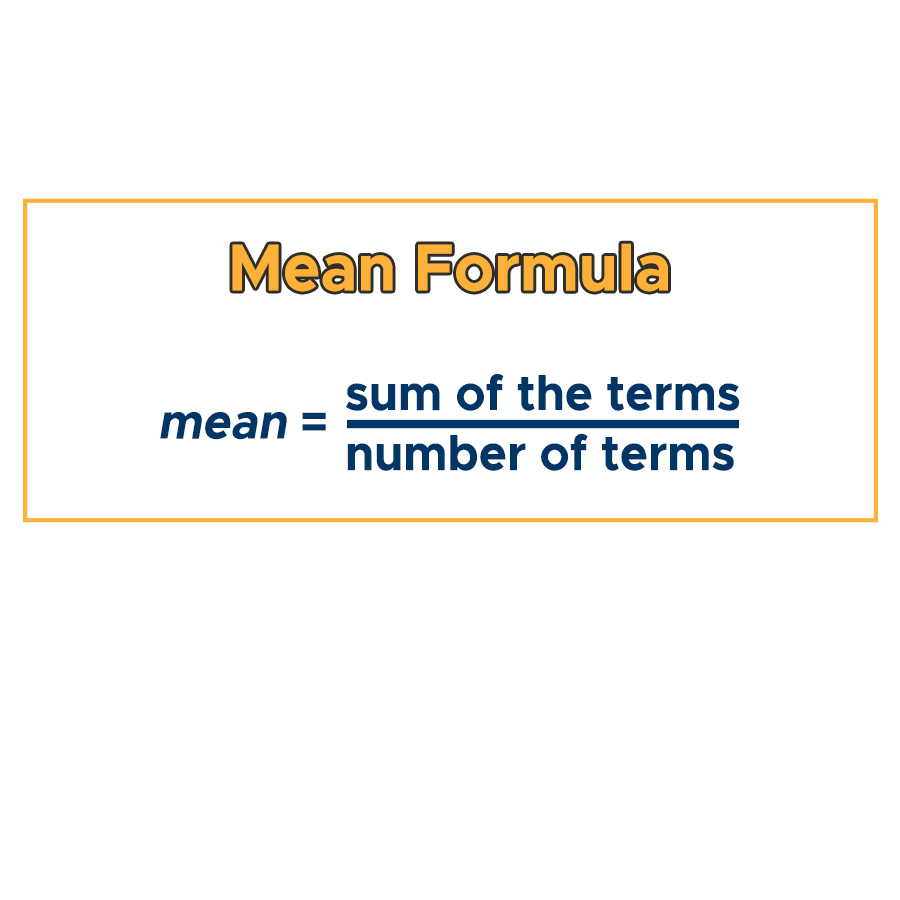
The statistical mean is the same as the arithmetic average of that group.
It can be misleading as the sole measure of central tendency if the data gas outliers.
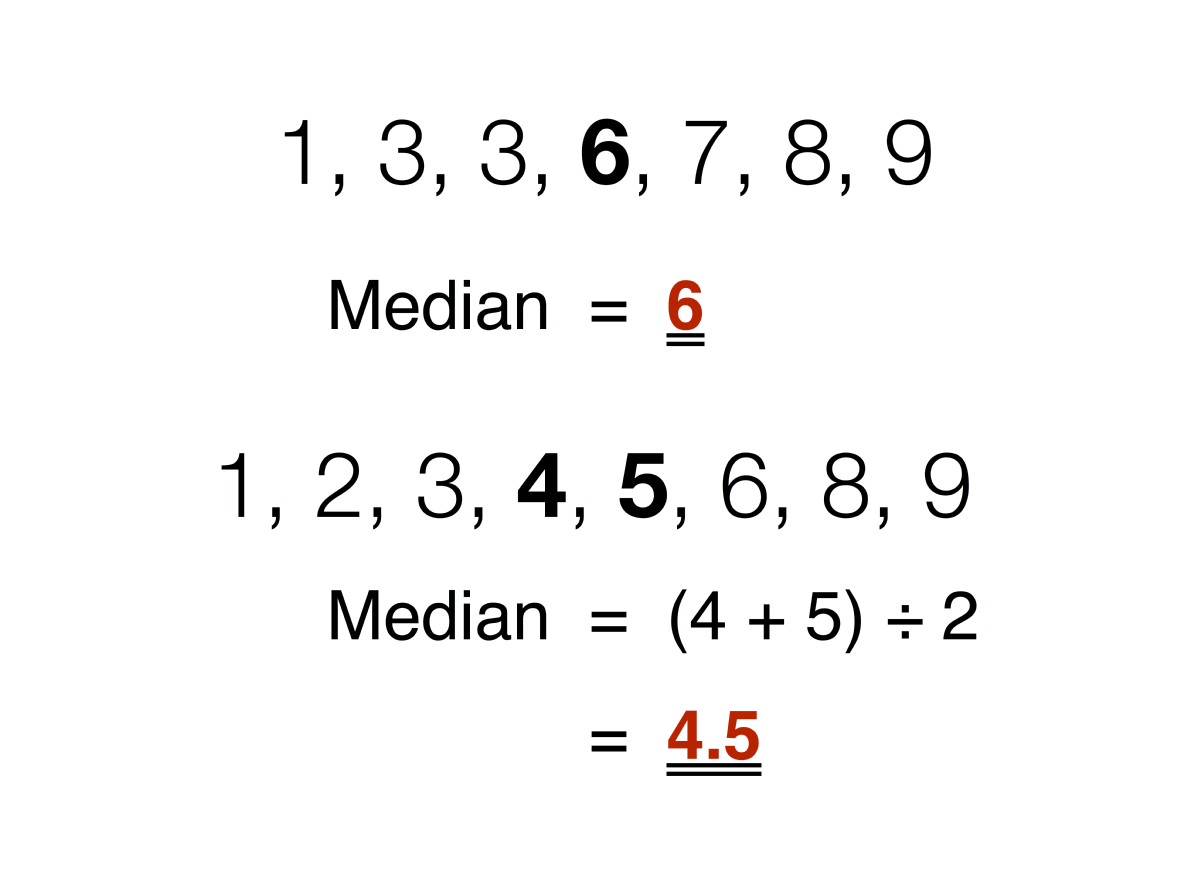
The statistical median is the value in the middle of the set of data. If there are an odd number of data values, the median is the value in the middle of the list. If there is an even number of data values, the median is the arithmetic mean of the two values.
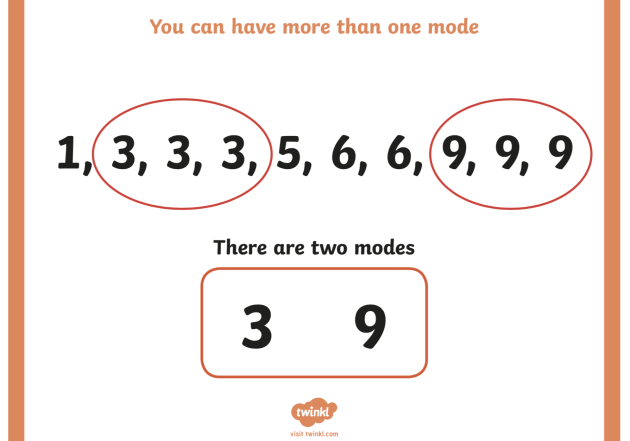
The statistical mode is the data value that occurs the greatest number of times in the data set. It is possible to have exactly one mode, more than one mode, or no mode.
A measure of dispersion is a single value that helps to interpret the measure of central tendency by providing more information about how the data values in the set are distributed about the measure of central tendency.
1) Statistical Range - difference between the greatest and lowest values of the data in the set (Range = highest number - lowest number)
2) Standard Deviation - measure of dispersion that compares all the data values in the set to the mean of the set to give a more accurate picture
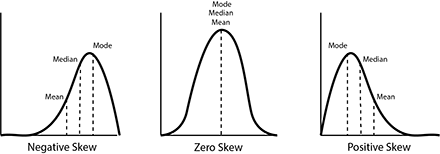
3) Skewness - describe the symmetry or asymmetry of the distribution of values in a dataset
• Symmetrical - no skew, all values closer to the mean
• Positively skewed - mean is to the right of the median
• Negatively skewed - mean is to the left of the median
4) Unimodal vs Bimodal - if distribution has a single peal it is considered unimodal, but if it has two peaks it is considered bimodal
• A uniform distribution has no distinct peak or variation in the data
Theoretical probability can usually be determined without actually performing the event.
P(A) - Number of acceptable outcomes/ Number of possible outcomes
The addition rule of probability is used for finding the probability of a compound event (two or more independent events happening at the same time).
P(A or B) = P(A) + P(B) - P(A and B)
Conditional probability is the probability that event A will occur given that event B has occurred.
P(B|A) = P(A and B)/ P(A)
For example, what is the odd you will buy a black shirt in small. You have 10 black shirts in small and 60 small shirts total in the store
P(B|A) = 10/60
The multiplication rule can be used to find the probability of two independent events occurring.
P(A and B) = P(A) x P(B)
To find the probability of at least one outcome of the element will occur.
P(at least one event occurring) = 1-P (no outcomes occurring)
Theoretical probability can usually be determined without actually performing the event.
P(A) - Number of acceptable outcomes/ Number of possible outcomes
The addition rule of probability is used for finding the probability of a compound event (two or more independent events happening at the same time).
P(A or B) = P(A) + P(B) - P(A and B)
__________ variables are those that determine the grouping or the order of your information, like time or category.
__________ variables are those that are of interest when compared across the independent variables, like growth or frequency.
Independent
Dependent
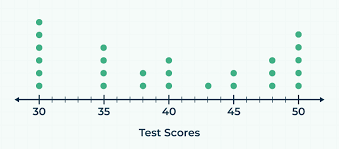
A _________, also known as a dot plot, has plotted points that rate not connected by line segments. The horizontal axis lists the different possible values for the data and the vertical axis lists the number of times the individual value occurs.
Line plot
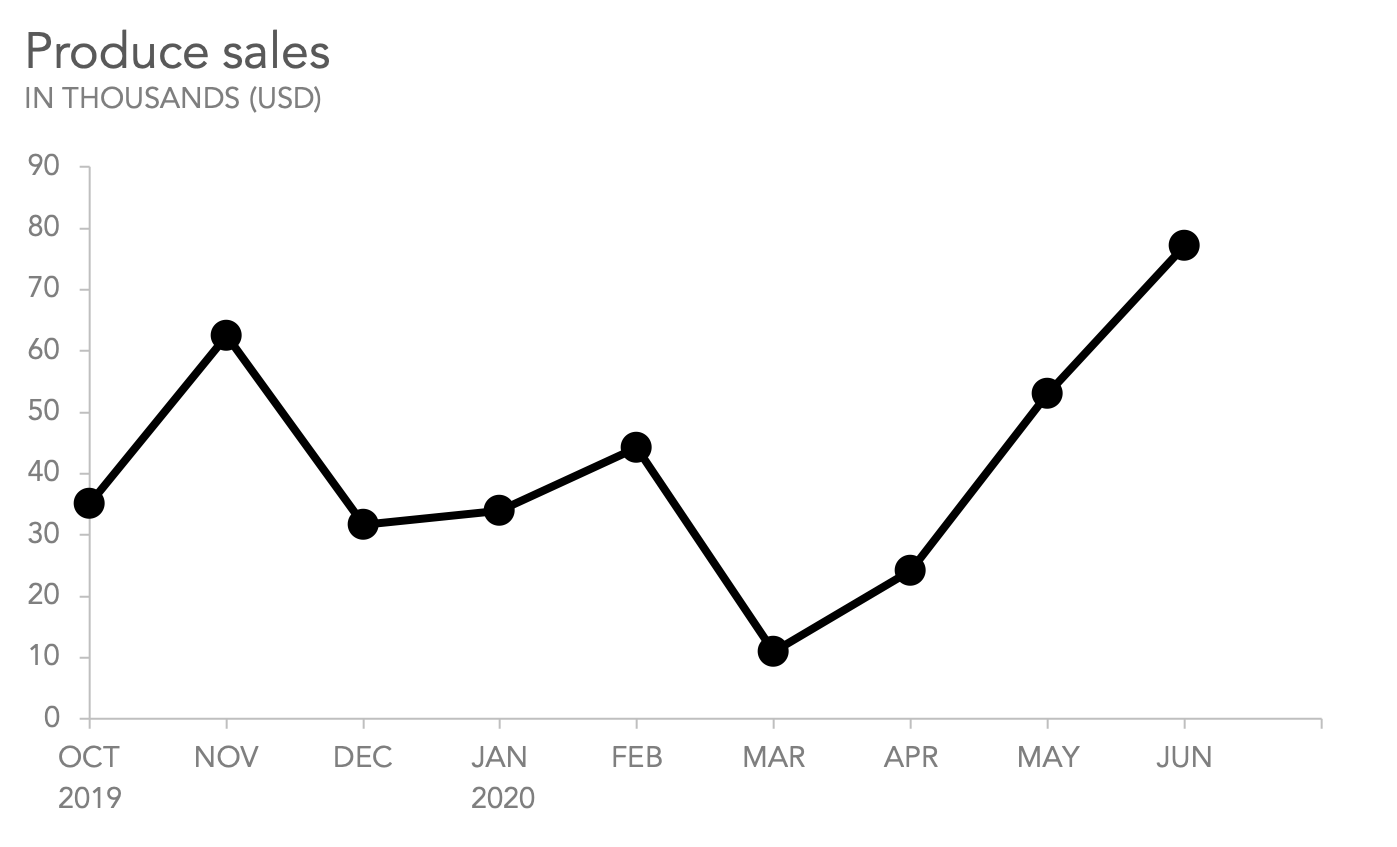
________ graphs have one or more lines of varying styles to show the different values for a set of data over time. The x- and y- axes are defined in terms of their units, such as dollars or time. The individual plotted points are joined by line segments to show whether the value of the date is increasing, decreasing or staying the same
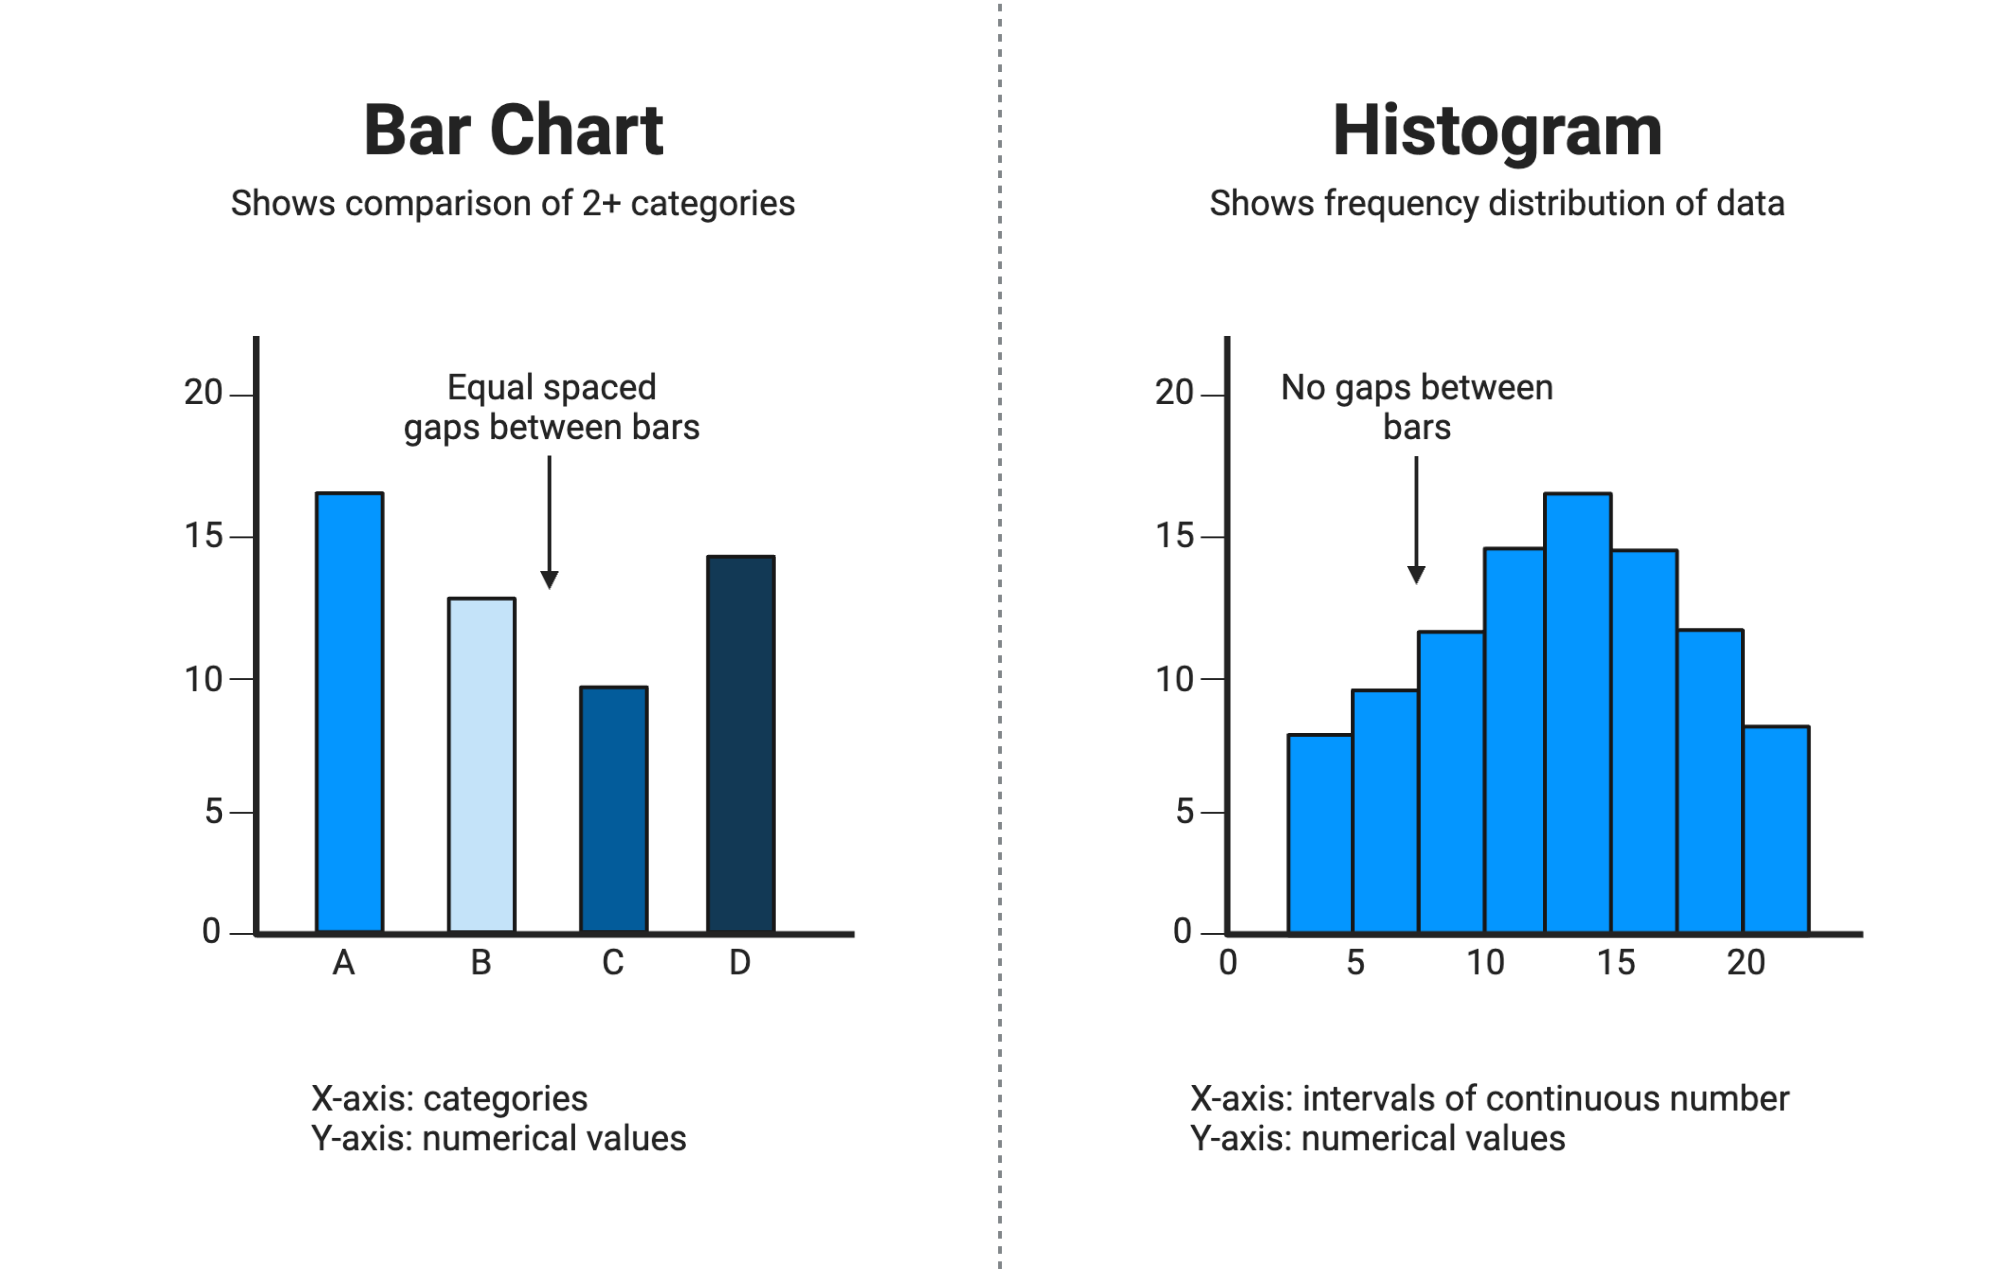
A ________ graph can be drawn correctly in two different configurations - horizontally and vertically. It’s similar to a line plot. They are a good way to represent large or small counts in various categories.
Although a _______ graph might look similar to a bar graph, it is not. While bar graph has a separate bar for each piece of data, a histogram has one continuous bar for each range of data. While bar graph has numerical values on one axis, a histogram has numerical values on both axes.
Bar graph
Histogram
____________ is simply data from two different variables. It can be nicely represented by a ____________ graph. By looking at the pattern formed by the points on the grid, you can often determine whether or not there is a relationship between the two variables, and what that relationship is. It may be directly proportionate, inversely proportionate, or show no proportion at all.
Linear scatter plots may be _____________ correlation or ____________ correlation
Bivariate data, scatter plot, positive, negative