Microeconomics ECON 101 MT1
1/82
There's no tags or description
Looks like no tags are added yet.
Name | Mastery | Learn | Test | Matching | Spaced | Call with Kai |
|---|
No analytics yet
Send a link to your students to track their progress
83 Terms
What are the four principles of economics?
Cost Benefit Principle
Opportunity Cost Principle
Marginal Principle
Interdependence Principle
Define the Cost Benefit Principle
Costs and benefits are the incentives that shape decisions. You should evaluate the full set of costs and benefits of any choice, and only pursue those whose benefits are at least as large as their costs.
Define the willingness to pay
The maximum amount a buyer would be willing to pay for something. To convert costs or benefits into their monetary equivalent, ask yourself: “What is the most I am willing to pay to get this benefit (or avoid that cost)?”
Define Economic Surplus
ES = TB - TC, if ES < 0, then it is not a good decision, if ES >= 0, it is.
The total benefits minus total costs flowing from a decision. It measures how much a decision has improved your well-being.
Define the framing effect
When a decision is affected by how a choice is described, or framed. You should avoid framing effects altering your own decisions.
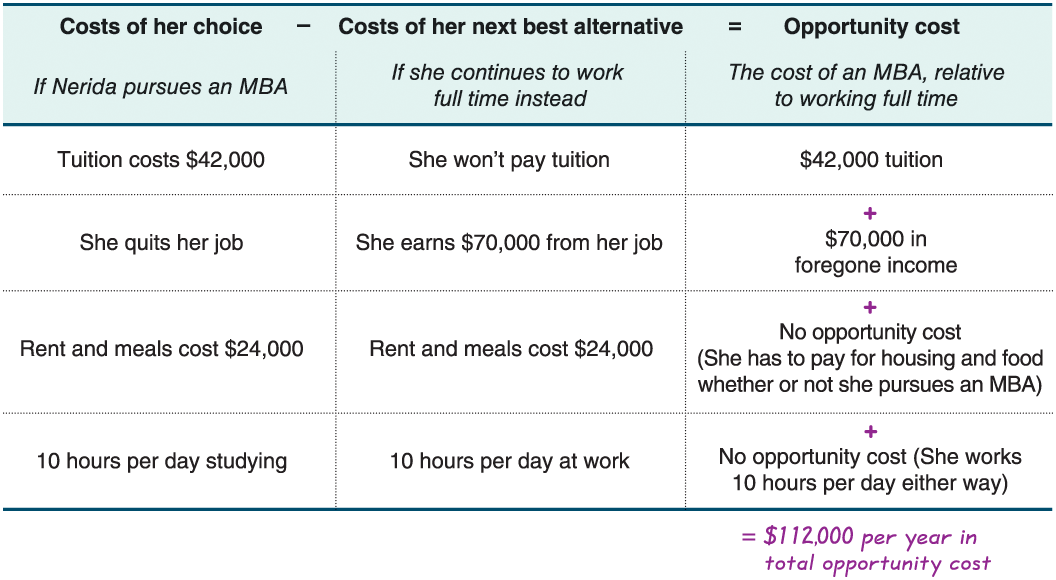
What is the formula of Opportunity Cost?
Costs of her choice - Costs of her next best alternative = Opportunity Cost
Remember Costs of her next best alternative
Losing a wage of a previous job to do something else would be negative since it was a benefit but living expenses stay the same sign. This way losing wages is subtracting a negative ADDING to the opportunity cost.
When calculating opportunity costs, what should you keep in mind when including/excluding?
Some out-of-pockets costs, explicit costs and are included in calculating opportunity costs.
Opportunity costs include more than the money spent, they also should subtract what you give up when you choose one option over another.
Not All Out-of-Pocket Costs Are Opportunity Costs - Not every expense you face counts as an opportunity cost. An expense is only a true opportunity cost if it changes depending on your choice.
Some Nonfinancial Costs Are Not Opportunity Costs - Opportunity costs can include nonfinancial factors like time and effort, but they only matter if they differ across alternatives.
Define sunk cost
A cost that has been incurred and cannot be reversed. A sunk cost exists whatever choice you make, and hence it is not an opportunity cost. Good decisions ignore sunk costs.
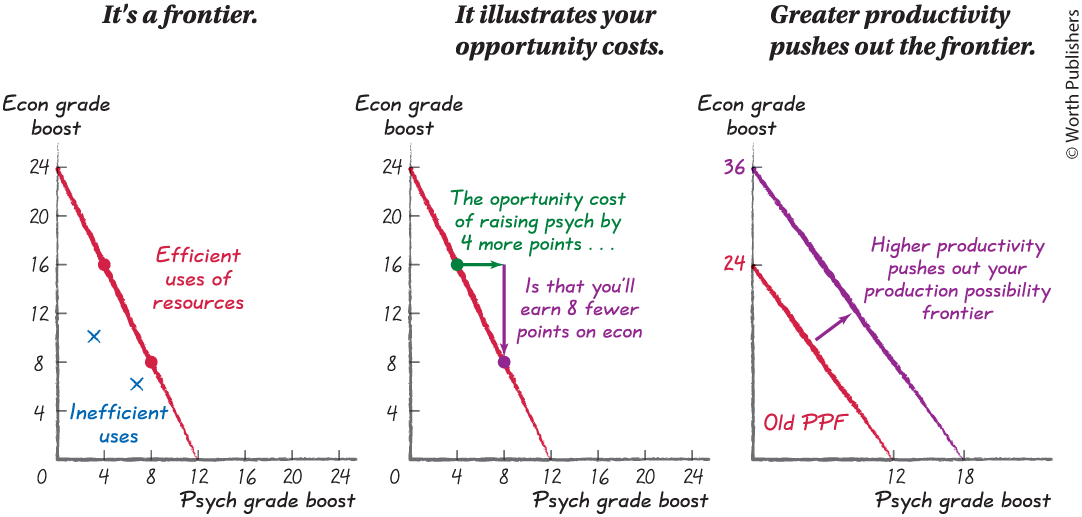
What is the PPF?
Production Possibility Frontier - Shows the different sets of output that are attainable with your scarce resources.
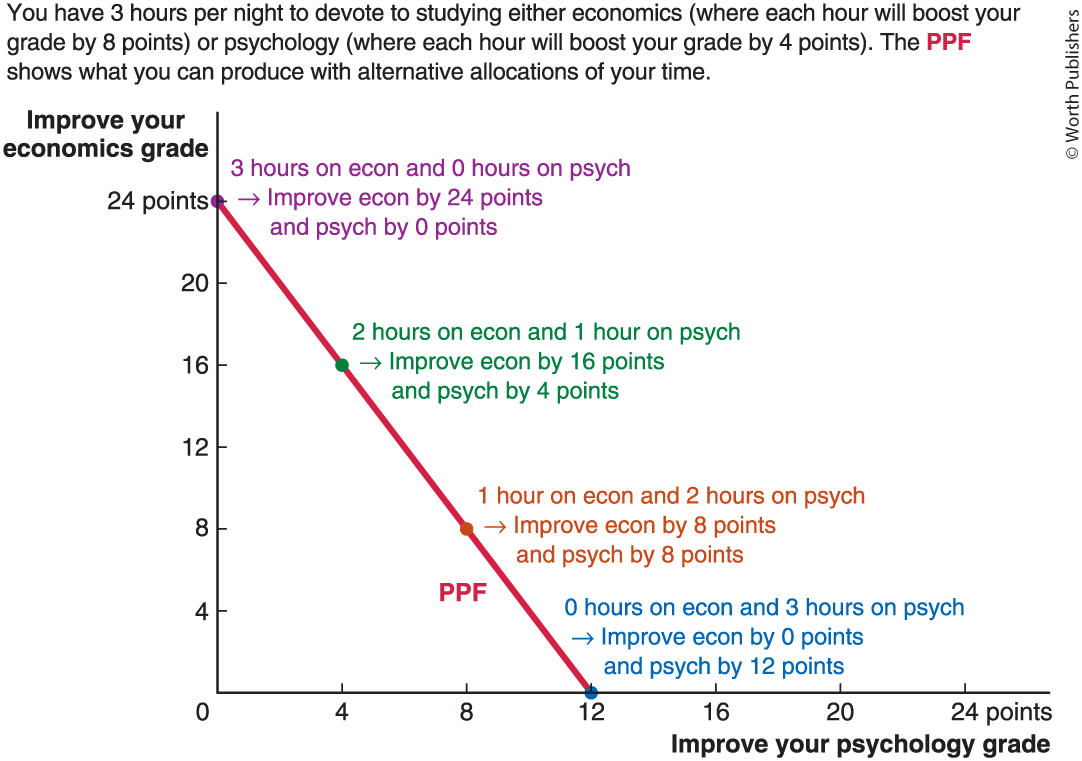
Describe PPF points, slope, movements
Define the marginal principle
Decisions about quantities are best made incrementally. You should break “how many” questions into a series of smaller, or marginal decisions, weighing marginal benefits and marginal costs.
Define Marginal Benefit and Cost
Benefit/Cost of adding one more unit of something
Define the Rationale Rule
If something is worth doing, keep doing it until your marginal benefits equal your marginal costs. The moment marginal costs is strictly greater than marginal benefits, stop.
Define the Interdependence Principle, what 4 factors affect your choice?
Your best choice depends on:
Dependencies between each of your individual choices
Dependencies between people or businesses in the same market
Dependencies between markets
Dependencies through time
Explain the interdependence of choices between your individual choices
You have limited resources, every choice you make affects the resources available for every other decision” E.g. your time, attention, money, etc
Explain the interdependence of choices between people or businesses in the same markets
The choices of others in your market affect the options available to you. Because resources are scarce, what others get often reduces what’s left for you.
Competing buyers: Businesses or people compete to purchase the same scarce resource (e.g., firms hiring from the same pool of workers, a better firm will get the better workers leaving less for you).
Competing sellers: People or businesses compete to sell to the same buyers (e.g., job seekers applying for the same job, if someone gets it you have a cant get that job).
Your outcome depends on their decisions, and their outcomes depend on yours.
Explain the interdependence of choices between markets
Choices in one market depend on conditions in other markets.
Examples of market links:
Credit → Housing: Higher interest rates make mortgages more expensive → fewer home purchases.
Housing → Child Care: Lower housing demand → homes converted into child care centres → more child care availability.
Child Care → Labour: Easier access to child care → more parents return to work.
Labour → Cars: More working family members → higher demand for multiple cars.
Key Idea: Markets are connected in chains. Ignoring interdependence risks missing how costs/benefits shift across markets.
Explain the interdependence of choices through time
Choices involve a time trade-off: act today vs. act tomorrow.
Applies to consumers (buy now or later), executives (when to produce/sell), investors, employers, and workers.
Expectations about the future shift the trade-off and can change the best choice.
Investments today expand future options:
New factory → more production later
Education → better job opportunities
Fitness → better health
Key Idea: Future outcomes depend heavily on today’s choices → investment decisions today hinge on expectations about tomorrow.
Define the individual demand curve
A graph, plotting the quantity of an item that someone plans to buy, at each price.
Law of Demand
The tendency for quantity demanded to be higher when the price is lower.
How does the individual demand curve link to marginal benefit and rational rule for buyers?
Price = Marginal Benefit, each point shows: “For the nth unit, the buyer values it at $X of marginal benefit.”
Rational Rule for Buyers: Keep buying until the price is greater than the marginal benefit (stop when Price > MB).
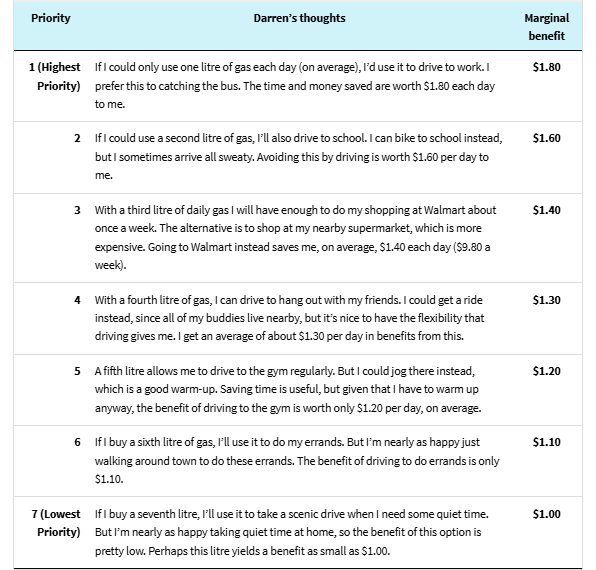
Example: Darren at $1.39 per litre:
1st litre → MB = $1.80
2nd litre → MB = $1.60
3rd litre → MB = $1.40
4th litre → MB = $1.30 (below price, so he stops)
Therefore, Darren buys 3 litres.
How does diminishing marginal benefit link to the individual demand curve’s downward slope?
It is downward sloping because each additional item is evaluated with a smaller marginal benefit than the previous item, so the price are willing to pay must go down for each successive item.

What is the market demand curve?
A graph plotting the total quantity of an item demanded by the entire market, at each price. (Horizontal sum of quantity demanded by individual demand curves at each price level)
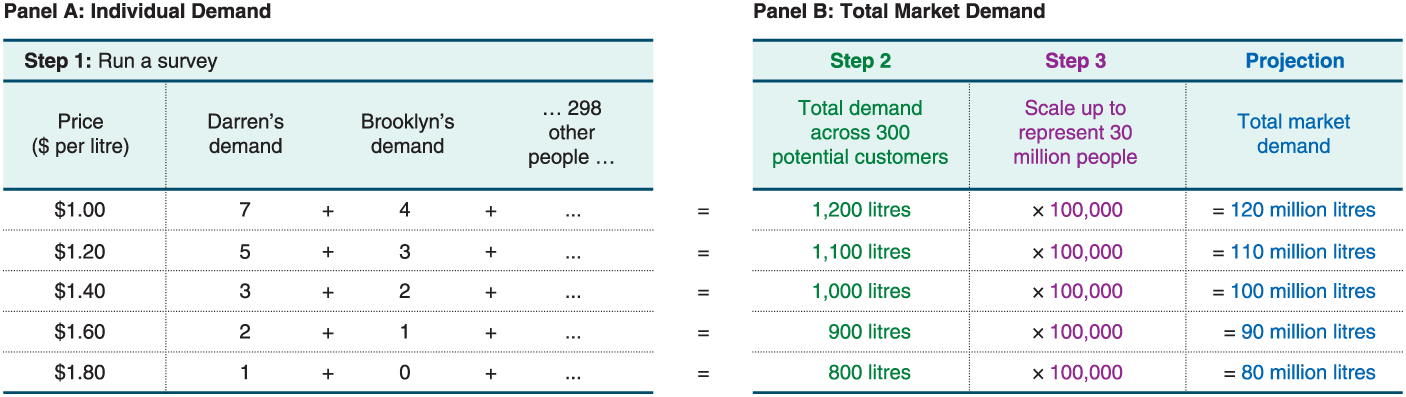
How would you survey the market demand curve?
Steps to Calculate the Market Demand Curve:
Survey a representative sample, asking how much each person would buy at each price.
Add up the total quantity demanded by the people surveyed at each price.
Scale up the survey results to represent the entire market (project to population size).
Plot the total quantity demanded at each price to get the market demand curve.
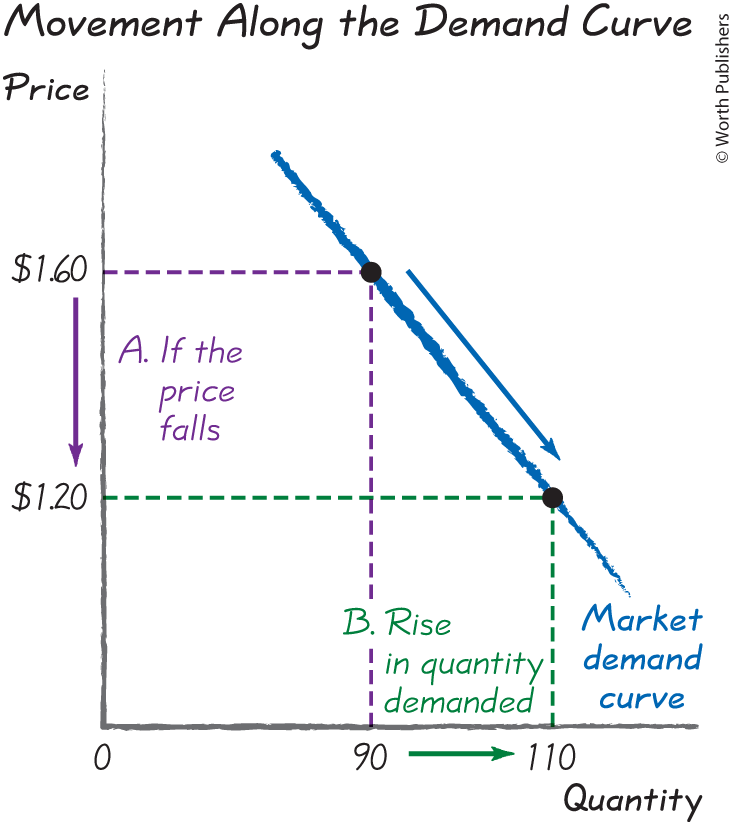
What causes a movement along the demand curve?
A price change causes movement from one point on a fixed demand curve to another point on the same curve.
What factors shift the demand curve?
Things that shift the demand curve are PEPTIC:
Preferences
Expectations
Prices of related goods
Type and number of buyers
Income
Congestion and network effects
Changes in all but type and number of buyers shift individual demand curves, and because the market demand curve is built up from individual demand curves, they shift the market demand curve. The type and number of buyers—only shifts market demand curves.
How does income affect demand?
It depends on the type of good, if it is normal or inferior.
Normal - demand increases with income (everything else)
Inferior - demand decreases with income (instant ramen, making do items, old shit)
Impact of price of related goods on Demand?
Complements
Goods that are used together (e.g., cars & gas, printers & ink).
Price ↑ of complement → Demand ↓ for this good (pair becomes more expensive).
Price ↓ of complement → Demand ↑ for this good (pair becomes cheaper).
Example: If cars get cheaper, demand for gas rises.
Substitutes
Goods that replace each other (e.g., tea & coffee, bus & subway).
Price ↑ of substitute → Demand ↑ for this good (this looks cheaper).
Price ↓ of substitute → Demand ↓ for this good (you buy the cheaper substitute instead).
Example: If tea gets cheaper, demand for coffee falls.
How do expectations of the future affect demand?
If you expect future to be cheaper, your demand now will decrease.
If you expect prices to rise in the future, your demand now will increase.
What are congestion and network effects?
Network Effect: A product becomes more useful as more people use it → increases marginal benefit & demand.
Example: Social media platforms (TikTok, Instagram, WeChat).
Business implication: Early adopters attract more users → snowball effect → long-run success.
Congestion Effect: A product becomes less useful as more people use it → decreases marginal benefit & demand.
Example: Roads (traffic congestion), fashion (less unique if others wear the same dress).
How do the number and types of buyers impact demand?
Market demand = sum of individual demand.
Shifts in demographics (types of buyers) change demand patterns.
Example: Baby Boom → baby clothes → schools → houses → healthcare.
Millennials → different preferences → new demand shifts.
Number of buyers matters too:
More buyers → demand curve shifts right.
Fewer buyers → demand curve shifts left.
Long-run drivers: population growth, immigration, and access to foreign markets (international trade).
Define perfect competition, what are its characteristics?
Markets in which:
1) all businesses in an industry sell an identical good
2) there are infinitely many sellers and many buyers, each of whom is small relative to the size of the market.
3) No barriers to entry/ free entry and exit of of sellers (FROM LECTURE)
4) Sellers are “price takers” — because with infinitely many sellers offering the same good, no single firm can influence the market price. If a firm charges more, buyers switch instantly to other sellers. If it charges less, it doesn’t gain extra demand, since it could already sell as much as it wanted at the market price, (Infinitely many demand, nothing to gain more)
Individual supply curve
A graph plotting the quantity of an item that a business plans to sell at each price.
Law of supply
The tendency for the quantity supplied to be higher when the price is higher.
Define Price Takers
Someone who decides to charge the dictated market price and whose actions do not affect the market price.
Why does assuming perfect competition simplify supply analysis?
In most markets, firms face two decisions: (1) what price to charge, since price affects demand, and (2) how much to produce at that price, depending on costs. But under perfect competition, firms are price-takers — the market sets the price. This removes the price-setting problem and leaves only the quantity decision. That’s why supply can be cleanly defined as the relationship between market price and the quantity firms are willing to produce.
In a perfectly competitive market, the producer’s marginal benefit is the… and the marginal cost is …?
The marginal benefit is the market price, it’s what you get for what you sell.
The marginal cost is the variable cost, no fixed costs
What is the variable cost?
Those costs—like labour and raw materials—that vary with the quantity of output you produce
What are fixed costs?
Those costs that don’t vary when you change the quantity of output you produce.
What is the rational rule for sellers?
Sell one more item if the price, the marginal benefit, is greater than (or is equal to) the marginal cost. Keep doing it until price equals marginal costs. Stop when marginal cost is greater than the price.

Define Marginal Product
The increase in output that arises from an additional unit of an input, like labour.
Why does the individual supply curve slope upwards, why is it that marginal cost increasing for a business? Give 2 reasons
1) Diminishing marginal product: when you increase one input while others are fixed, each extra unit of that input adds less output than the previous one (e.g., crowded workers, waiting for shared machines, overcrowded land).
2) Rising costs:
Rising Input costs: more time to pay higher for overtime pay, offer more high paying jobs to attract workers from farther away, raising search costs - it takes longer and longer to find the next worker, rising transport costs - you have to get resources from farther away.
Rising Opportunity cost rises: Because extra inputs are less productive, at some point the gain from one more unit is so small that the input could create more value elsewhere. This is rising opportunity cost. You are basically paying so much for so little improvement that you need to argue for a higher price to justify not spending it elsewhere.
Rising costs
So, firms will only supply more output if they get a higher price to cover rising marginal costs → supply curve slopes upward
More output → lower extra productivity → higher extra cost → higher required price.
Define Diminishing Marginal Product
Diminishing marginal product: when you increase one input while others are fixed, each extra unit of that input adds less output than the previous one (e.g., crowded workers, waiting for shared machines, overcrowded land).
What is a market supply curve?
A graph plotting the total quantity of an item supplied by the entire market, at each price.
Why does the market supply curve slope upwards? 2 Reasons
1) A higher price leads individual businesses to supply a larger quantity. (Inherited from individual supply curve)
2) A higher price means more businesses are supplying their goods and services; a lower price means fewer businesses are doing so.
A higher price means that it’s more profitable to be a supplier in your industry. And that’s the sort of signal that leads existing firms to expand into your market, or new entrepreneurs to start new businesses. As a result, a higher price leads to more suppliers, leading to a larger quantity supplied.
What causes a movement along the supply curve?
A price change causes movement from one point on a fixed supply curve to another point on the same curve.
What are the five factors that shift supply?
PIPET
Productivity and technology
Input Prices
Prices of Related Goods
Expectations
Type and number of sellers (This only shifts market supply curve, rest shift both individual supply curve of businesses)
NOT A CHANGE IN PRICE
How do Input Prices affect supply?
↑ Input prices (raw materials, labor, machinery, etc.) → ↑ marginal cost → ↓ supply → Supply shifts left
↓ Input prices → ↓ marginal cost → ↑ supply → Supply shifts right
How do Productivity/ Better technology affect supply?
↑ Productivity / better technology → ↓ marginal cost → ↑ supply → Supply shifts right
Ways to improve: new machinery, refined processes, better management, R&D, learning by doing
Often influenced by other industries’ innovations (interdependence principle)
How do price of related outputs impact supply?
Substitutes-in-production (resources can produce either good A or B):
↑ Price of substitute → ↑ marginal cost (opportunity cost increases, we lose out more on not producing the substitute) → ↓ supply of current good → Supply shifts left
↓ Price of substitute → ↓ marginal cost (decreasing opportunity cost) → ↑ supply → Supply shifts right
Complements-in-production (goods produced together):
↑ Price of complement → ↓ marginal cost (extra revenue from complement help lower marginal cost of production, think inputs can be used to create the complement goods and good in question together)→ ↑ supply of current good → Supply shifts right
↓ Price of complement → ↑ marginal cost (less revenue from complement, higher marginal cost than before) → ↓ supply → Supply shifts left
Key note: Substitutes/complements in production shift supply curves, not to be confused with substitutes/complements in consumption (which shift demand).
Define substitutes in production
Alternative uses of your resources. Your supply of a good will decrease if the price of a substitute-in-production rises.
Define complements in production
Goods that are made together. Your supply of a good will increase if the price of a complement-in-production rises.
How do expectations impact supply?
Link through time: Expectations connect current and future supply decisions.
Short run:
If firms expect higher prices in the future, they reduce supply today (shift left) to store goods and sell later.
Supply increases in the future when the goods are sold (shift right).
This reflects the opportunity cost principle: selling today means giving up potentially higher profits tomorrow.
Storage matters: Expectations only affect supply if goods can be stored (e.g., gasoline vs. fresh fish).
Production vs. supply: Firms may still produce now but hold back supply by storing output for the future.
Long run: If higher prices are expected to persist, firms invest in capacity (new equipment, workers), expanding both production and supply.
How do Type and number of sellers impact supply?
Market supply = sum of all sellers’ supply.
Entry: When new businesses enter, total supply increases → supply curve shifts right.
Exit: When businesses shut down, total supply decreases → supply curve shifts left.
Composition matters: If the types of businesses change, the mix of supply changes too.
Driven by profits: Entry and exit decisions depend on expected future profits.
Define Market
A setting bringing together potential buyers and sellers.
What are the three main questions surrounding a market?
Who Makes What? Who Gets What? How Much Gets Bought and Sold?
What is a planned economy?
Centralized decisions are made about what is produced, how, by whom, and who gets what.
What is a market economy?
Each individual makes their own production and consumption decisions, buying and selling in markets.
What is equillibrium?
The point at which there is no tendency for change. A market is in equilibrium when the quantity supplied equals the quantity demanded.
What are the three symptoms of market disequllibrium? (From the textbook)
1. Queueing
Waiting in line or spending extra time to obtain a scarce good or service
Increases the “effective price” because of time and effort
Example: Driving around looking for a parking spot, queuing for a new videogame console
2. Bundling of Extras
Having to purchase additional items or services to get the desired good
Raises the “effective price” indirectly
Example: Buying dinner to use valet parking, stores bundling games with a console
3. Secondary Market
Goods are resold outside the official market
Often sold at higher prices during shortages, or lower prices during surpluses
Example: Parking in someone’s driveway, reselling a new console on eBay or Craigslist
Formula for PED
\epsilon_{d}=\left|\frac{\left(\frac{\%\Delta Q_{d}}{\overline{Q}_{d}}\right)}{\left(\frac{\%\Delta P_{d}}{\overline{P}_{d}}\right)}\right|
What does PED measure? What is elastic and inelastic?
PED for perfectly elastic and perfectly inelastic
A measure of how responsive buyers are to price changes. It measures the percent change in quantity demanded that follows from a 1% price change.
Think 1/slope * average Q/ average P to be safe
PED > 1 elastic. Less Steep
PED < 1 inelastic. More Steep
PED = infinity, Perfectly elastic, horizontal line, infinite change of demand.
PED = 0, perfectly inelastic, vertical line - PED of zero. Small change in price does not affect quantity demanded.

What are the determinants of PED?
1) Substitutes Available
More substitutes, more elastic, more sensitive to price change
Less Substitutes, more inelastic, less sensitive
2) Necessity vs Luxury
Necessity → more inelastic, will buy regardless of change in price
Luxury → more elastic, more of a want, will be responsive
3) Narrow vs Broad Definition
Like think market for apple smart phones versus market for smartphones in general
A narrow definition is more elastic
A broad definition is less elastic
4) Time Horizon
In the long run, demand always tends to be elastic, more responsive to long/sustained price changes.
In the short run, demand tends to be inelastic. Less responsive, less time to consider different substitutes, etc.
5) Ease of search/price comparison
When consumers can easily search for alternatives, demand becomes more elastic.
Extensive searching increases the chance of finding acceptable, lower-priced substitutes.
If one seller raises their price, customers engaged in searching are more likely to switch to alternatives.
Consumers who are most willing to search are also the most responsive to price changes.
Demand for storable goods (e.g., laundry detergent) is more elastic than for perishable goods (e.g., fresh fish).
A small price discount on storable goods can be multiplied by stocking up, leading to greater total savings.
For perishable goods, savings are limited to today’s purchase, making consumers less responsive to price changes.
Substitutability also applies across time: buying detergent at a low price today substitutes for buying it later at a higher price.
Cross Price Elasticity of Demand Formula
A measure of how responsive the demand of one good is to price changes of another. It measures the percent change in quantity demanded that follows from a 1% change in the price of another good.
\epsilon_{AB}=\frac{\left(\frac{\%\Delta Q_{A_{d}}}{\overline{Q}_{A_{d}}}\right)}{\left(\frac{\%\Delta P_{B}}{\overline{P}_{B}}\right)}
If Cross Price Elasticity > 0, it is a substitute,
If Cross Price Elasticity < 0, it is a complement
If it is equal to 0/ near 0, for independent goods.
Income Elasticity of Demand
A measure of how responsive the demand for a good is to changes in income. It measures the percent change in quantity demanded that follows from a 1% change in income.
\epsilon_{Y}=\frac{\left(\frac{\%\Delta Q_{d_{}}}{\overline{Q}_{d}}\right)}{\left(\frac{\%\Delta Y_{}}{\overline{Y}_{}}\right)}
Income Elasticity is positive for normal goods.
Income Elasticity is negative for inferior goods.
Necessities tend to have a small income elasticity for many of the same reasons that their price elasticity of demand is inelastic. You have to buy soap, and just because your income goes up, you aren’t going to buy that much more.
What does PES measure? What is elastic and inelastic?
PES for perfectly elastic and perfectly inelastic
A measure of how responsive sellers are to price changes. It measures the percent change in quantity supplied that follows from a 1% price change.
\epsilon_{s}=\frac{\left(\frac{\%\Delta Q_{_{s}}}{\overline{Q}_{_{s}}}\right)}{\left(\frac{\%\Delta P_{s}}{\overline{P}_{s}}\right)}
PES = 0, vertical, quantity supplied is unchanged for any change in price
PES < 1, inelastic
PES > 1, elastic
PES = infintiy, horizontal, quantity supplied infitely changes for a change in price

Determinants of PES
Basically, how easily and cheaply you can mobilize resources to expand production when prices rise, and how easily you can cut your expenses or repurpose your resources when the price falls.
1. Inventories
Supply is more elastic if products can be stored.
Inventories break the link between production and supply, allowing quick response to price changes.
Works for storable goods (e.g., gasoline), not perishables (e.g., sandwiches).
2. Availability of Variable Inputs
If variable inputs (labor, materials) are easily available, supply is more elastic.
Businesses can expand output quickly when prices rise.
Flexibility also comes from reallocating resources (e.g., shifting planes to profitable routes).
3. Extra Capacity
Firms with unused capacity can increase production more easily → elastic supply.
If already at full capacity, expansion requires costly new investment → inelastic supply.
Example: catering with spare kitchen space vs. airlines limited by airport gates.
4. Ease of Entry and Exit
Supply is more elastic if new firms can easily enter or exit the market.
Low barriers to entry (e.g., catering) → elastic supply.
High entry costs (e.g., airlines) → inelastic supply.
5. Time Horizon
Supply is less elastic in the short run, more elastic in the long run.
Short run: rely on inventories or small adjustments.
Long run: firms can expand capacity, and new firms can enter.
Elasticity grows over time depending on industry (catering = short, oil refineries = decades).

Who bears more of the economic burden when taxes are levied?
Whichever is more inelastic gets more of the economic burden.
Quota Versus Mandate
Quota - Maximum Quantity that can be exchanged in the market, binding if to the left of Q*
Mandate - a Minimum Quantity that must be exchanged in the market, binding if to the right of Q*.
What is Positive Analysis
Describes what is happening, explaining why, or predicting what will happen.
Normative Analysis
Prescribes what should happen, which involves value judgments.
What is economic efficiency?
An outcome is more economically efficient if it yields more economic surplus. (SIZE OF PIE ANALOGY)
What is an equitable outcome/policy? (Equity)
An outcome yields greater equity if it results in a fairer distribution of economic benefits.
Consumer Surplus Formula
Consumer Surplus = Marginal Benefit - Price, Area under demand curve, above the price
Producer Surplus
The economic surplus you get from selling something.
Producer Surplus = Price - Marginal Costs
Area enclosed between supply curve and price
What is Economic Surplus as a concept and as a formula?
A measurement of the economic pie, the net “benefit”
Marginal Benefit - Marginal Cost, Area under demand Curve and Above Supply Curve
Efficient production/ Productive Efficiency
Producing a given quantity of output at the lowest possible cost, which requires producing each good at the lowest marginal cost.
Note for the image, any other change in distribution over how something gets produced increases the total cost for the market.

Efficient allocation/ Allocative Efficiency
Allocating goods to create the largest economic surplus, which requires that each good goes to the person who’ll get the highest marginal benefit from it.
Any other configuration will decrease the total benefit in the market

What is market failure and what are its sources?
When the forces of supply and demand lead to an inefficient outcome.
1) Market Power - domination by a few number of producers allow them to price higher causing consumers to buy a smaller quantity. The result is that market power leads to underproduction as businesses with market power tend to produce less than the efficient quantity
2) Externalities - whenever the choices of buyers and sellers have side effects on others not part of the exchange. There could be additional costs or benefits that are not fully taken into account, could result in overproduction of goods with alot of negative externalities and underproduction for ones with positive externalities.
3) Information Problems - private information (information one party has but the other doesn’t) /information asymmetry, if a seller knows more about the quality of the used car they’re selling than you do, you might wonder why they’re selling it. Your fears about what they’re hiding might lead you not to buy that secondhand car.
4) Irrationality - Buyers and sellers dont follow rational rule, unlikely to achieve efficient outcome
5) Government Regulations can impede market forces - shortages/surpluses, taxes and subsidies moving away from equilibrium
What is the Efficient Outcome
When the economic surplus is maximised?
What is efficient quantity
The quantity that produces the largest possible economic surplus.
What is deadweight loss? What is its formula?
How far economic surplus falls below the efficient outcome;
Deadweight loss = Economic surplus at efficient quantity − Actual economic surplus
What are some critiques of the economic efficiency model?
Critique 1: Distribution Matters (Equity Concerns)
Economic efficiency focuses only on maximizing total surplus (the size of the pie).
It ignores who receives the benefits and costs — the distribution of gains and losses.
Many argue that fairness and equity are just as important as efficiency.
The key idea: it’s not just the size of the pie, but how it’s sliced.
Critique 2: Willingness to Pay Reflects Ability to Pay
Efficiency assumes willingness to pay reflects marginal benefit.
In reality, willingness to pay depends on income and wealth.
Wealthier individuals can pay more even if they value the good less.
Example: the “Kim Kardashian problem” — a rich person outbids someone who values the good more simply because they can afford to.
Thus, efficiency may favor the rich rather than those who benefit most.
Critique 3: The Means Matter, Not Just the Ends
Economic efficiency evaluates only outcomes, not the fairness of the process.
People often care about how outcomes are achieved — procedural fairness.
Examples:
If you made the pie, perhaps you deserve a bigger slice.
Equality of opportunity or democratic decision-making may matter more than results.
Efficiency ignores moral or ethical judgments about process and rights.