chapter 11- frequency distributions and histograms
1/6
There's no tags or description
Looks like no tags are added yet.
Name | Mastery | Learn | Test | Matching | Spaced | Call with Kai |
|---|
No analytics yet
Send a link to your students to track their progress
7 Terms
Histogram
A bar trap expect-
the bars touch (a continuous type)
The width of each bar is the same and represents a quantitative value (age, years, length)
Number of classes (bars) should be between 5 and 15
The width of each class (bar) is the class width, CW- the next highest integer.
For a histogram, the midpoint is used to
scale the horizontal axis
Class boundary
Halfway between the upper limit of one class and the lower limit of the next.
Drawing the bars from class boundary to class boundary will assure the bars touch
the lowest lower class boundary is the low data values minus 0.5 (each successive class boundary is found by adding the class width to the previous class boundary)
Stem and leaf display
Gives much of the same information as a histogram
Used to rank-order and arrange data.
Show information similar to a bar but retain original data values
Accuracy requires the digits of each leaf unit be of equal width
EVERY VALUE MAINTAINS ITS NUMBER
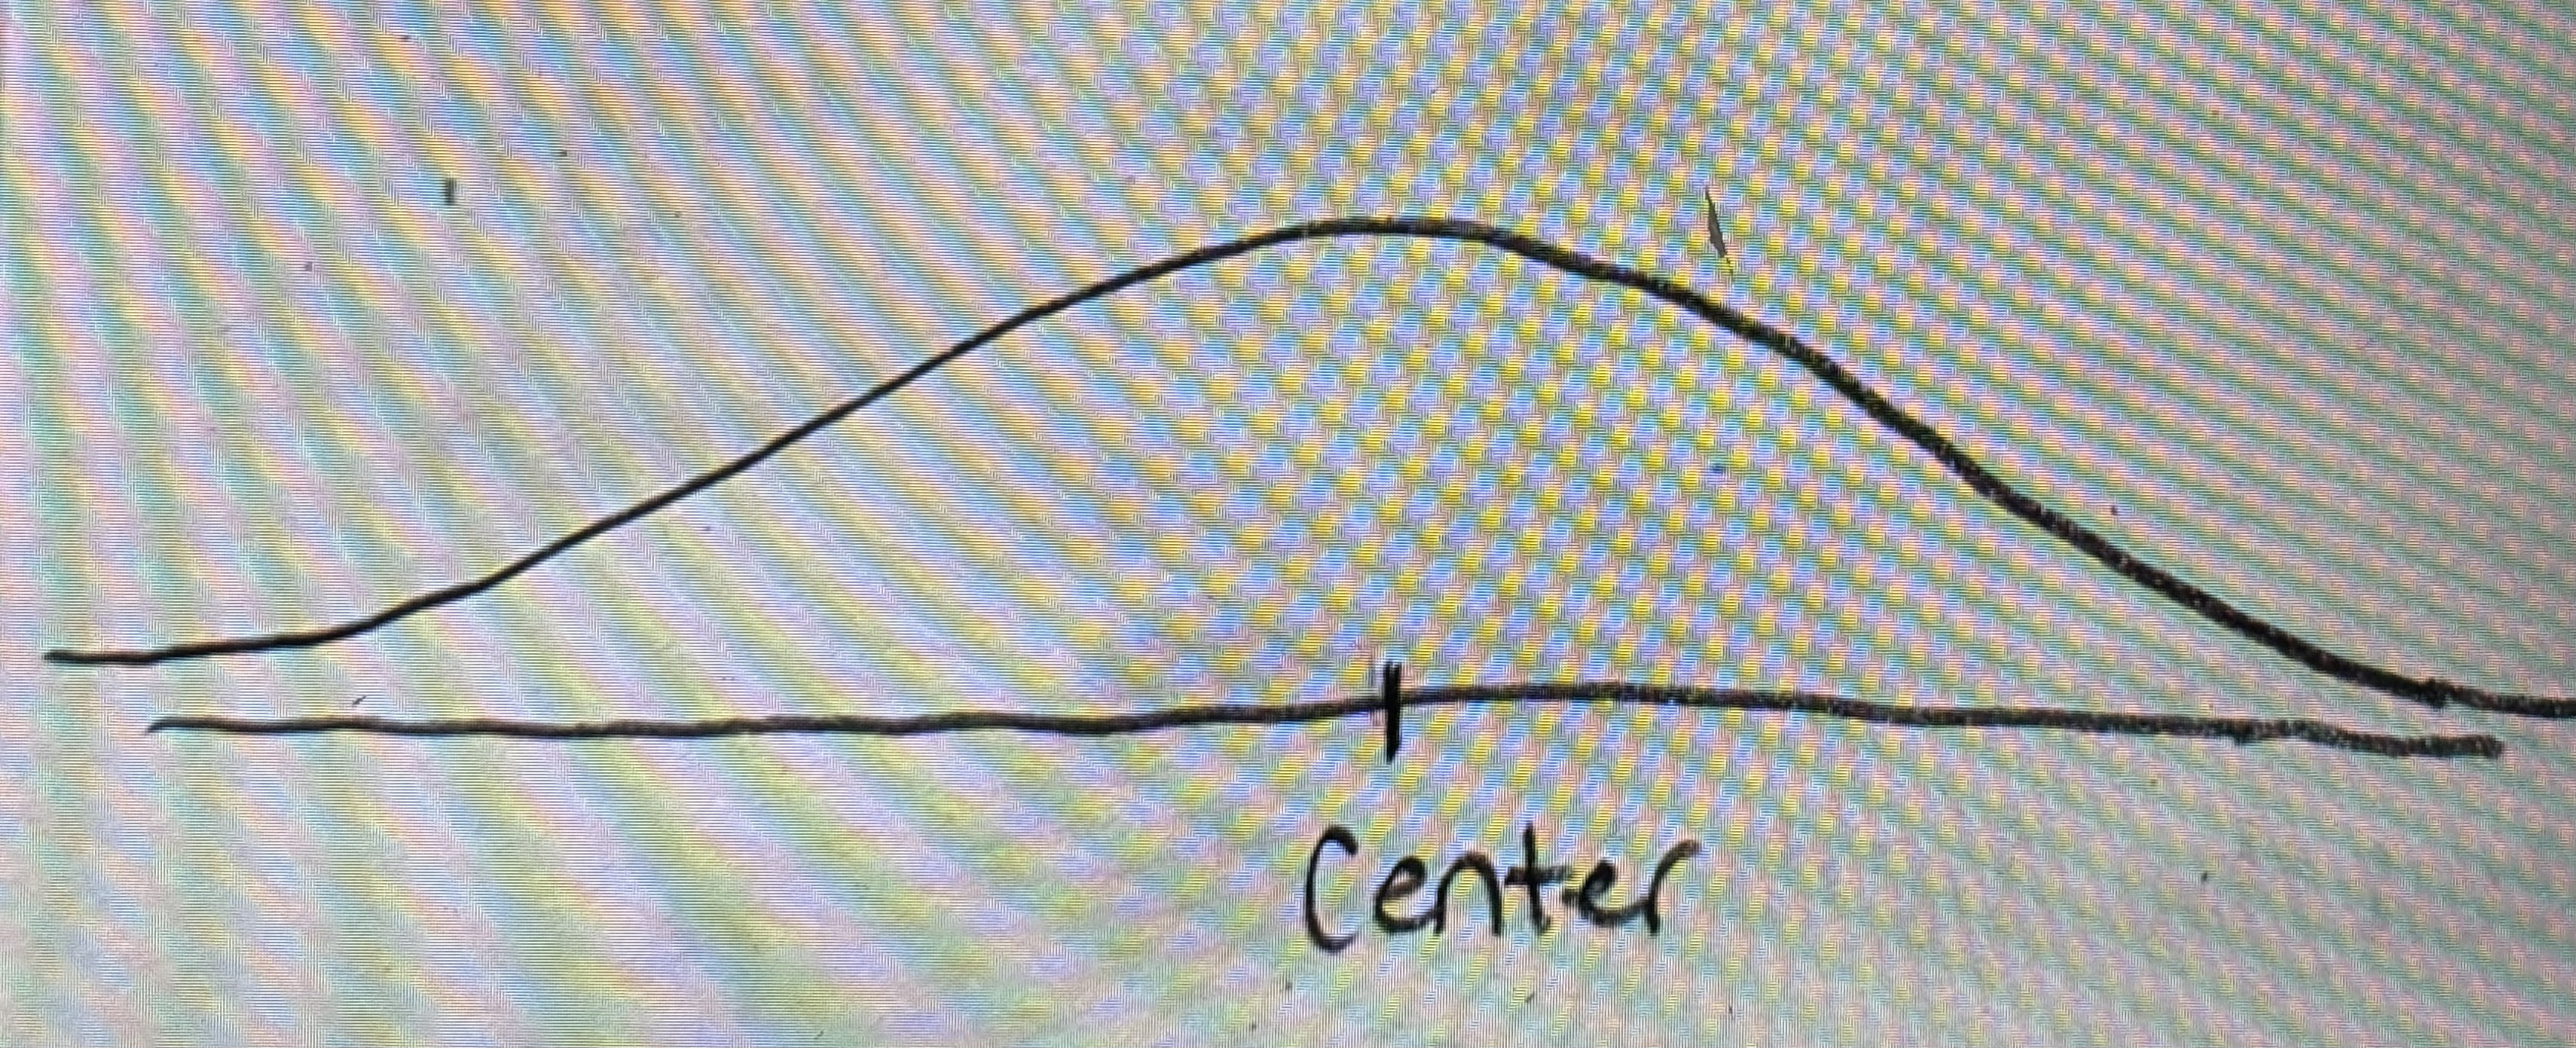
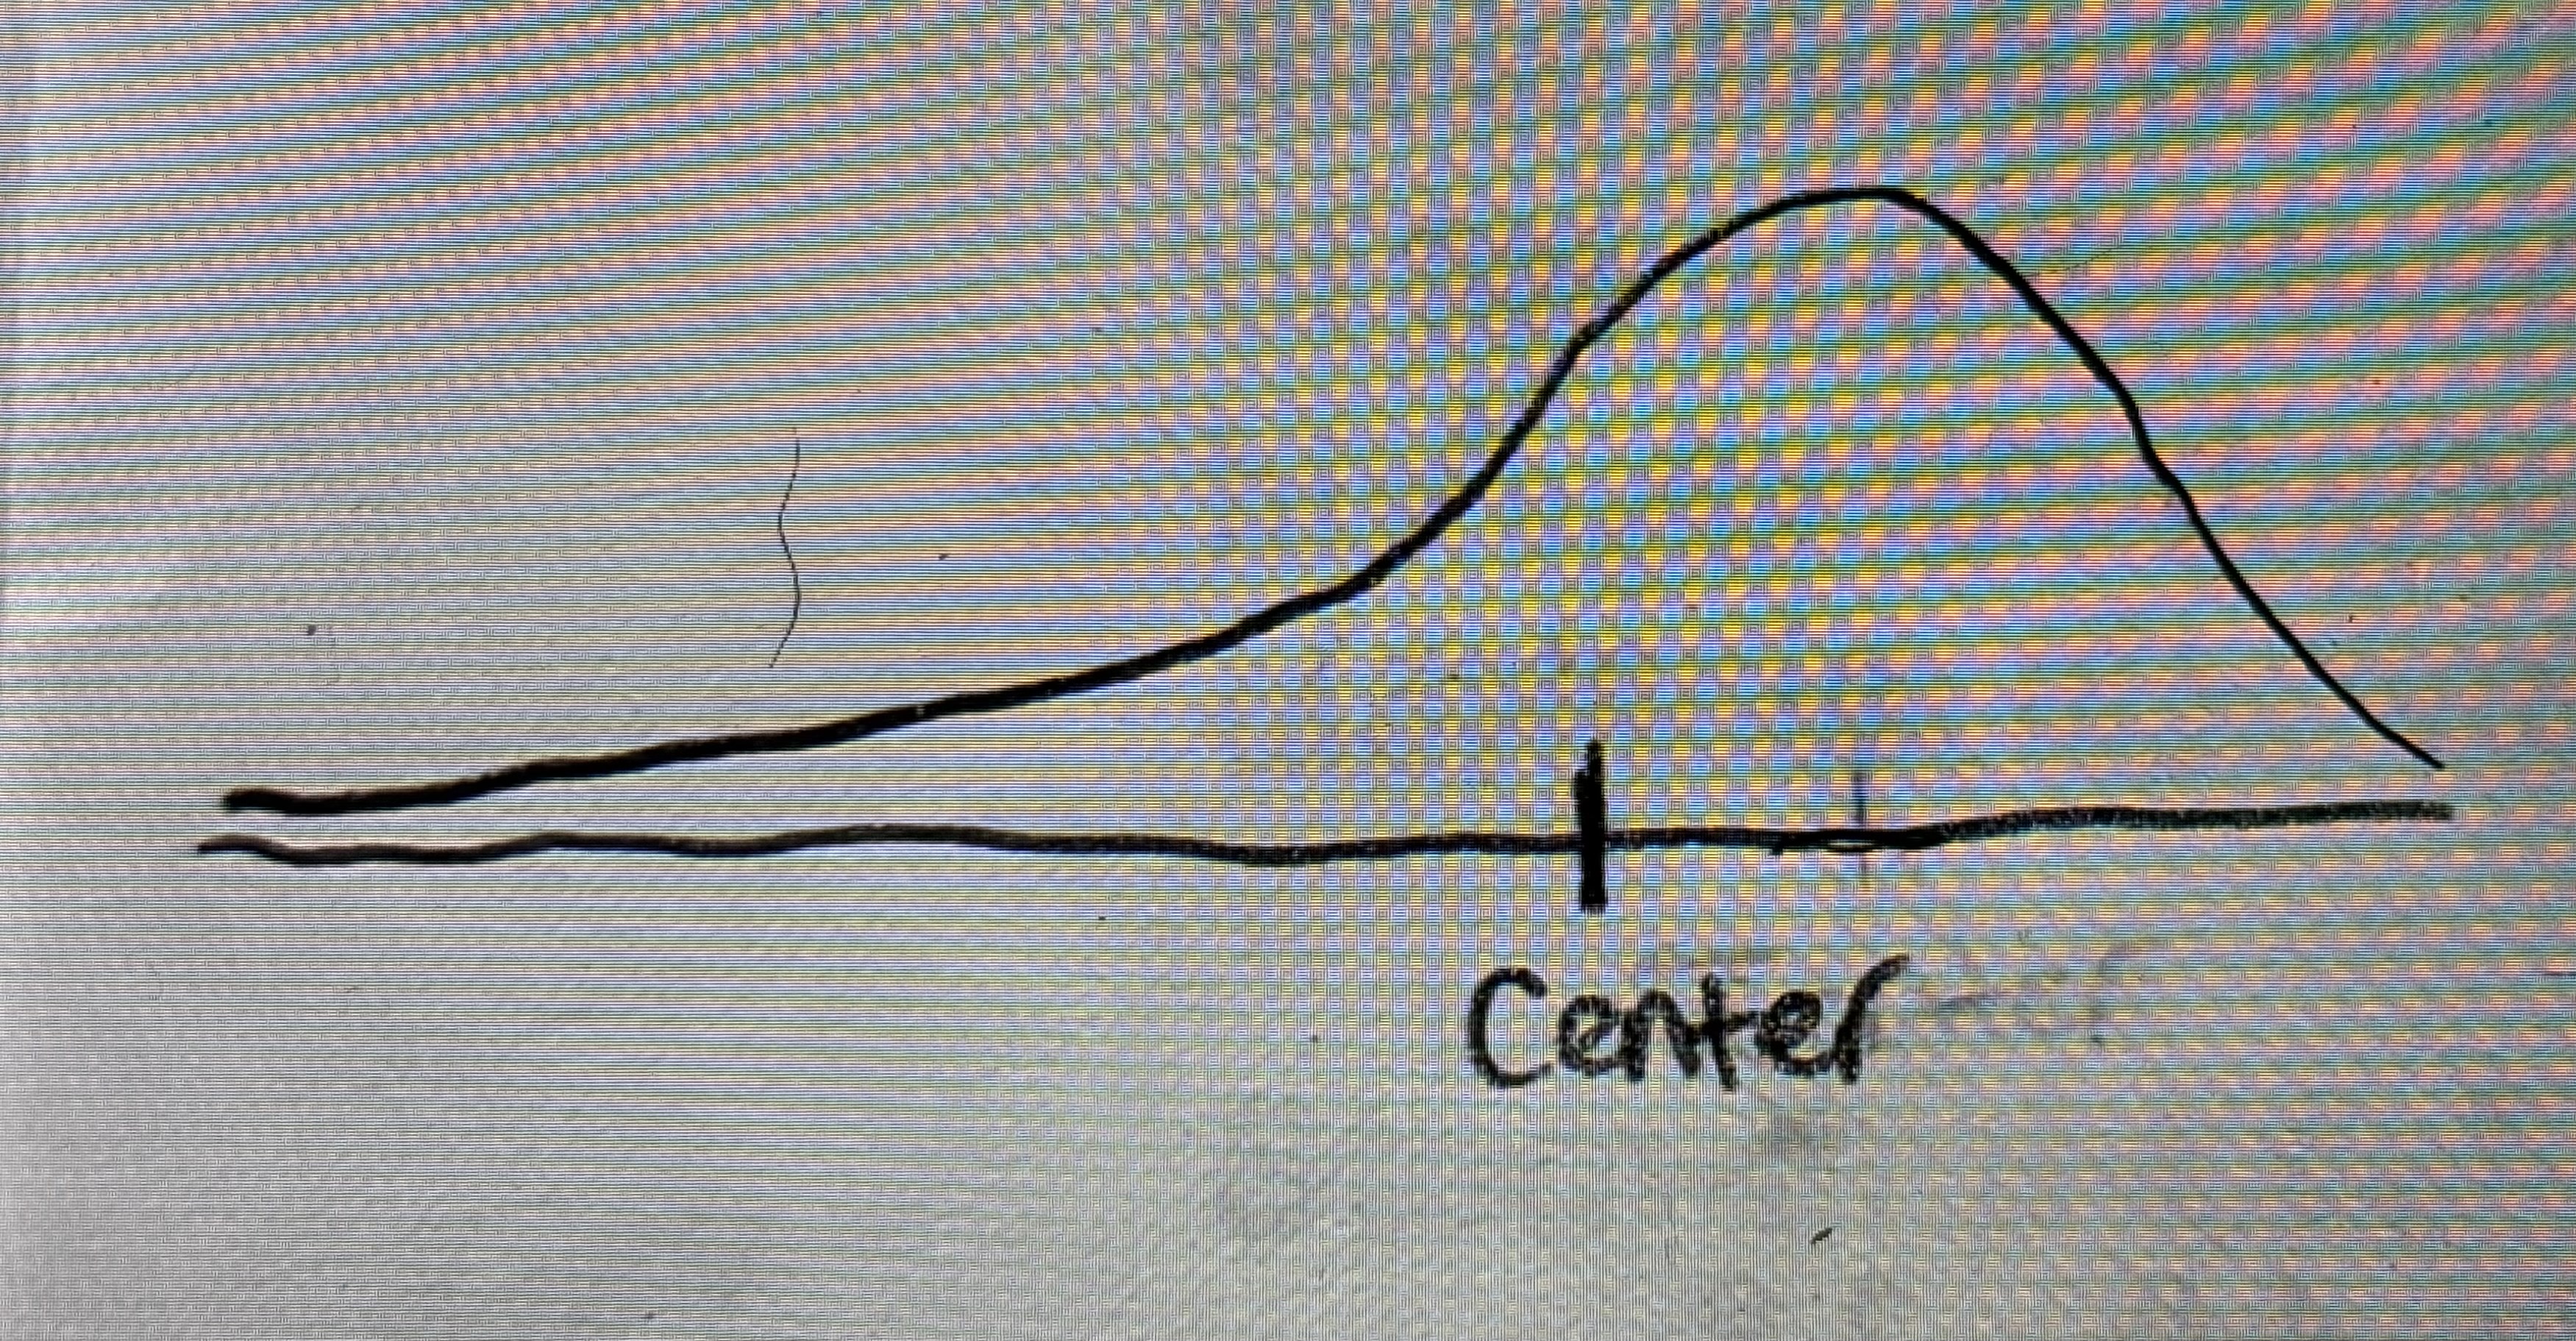
Right skewed
Also knocked as positively skewed
Data-
Salaries (how much they make)
Ages
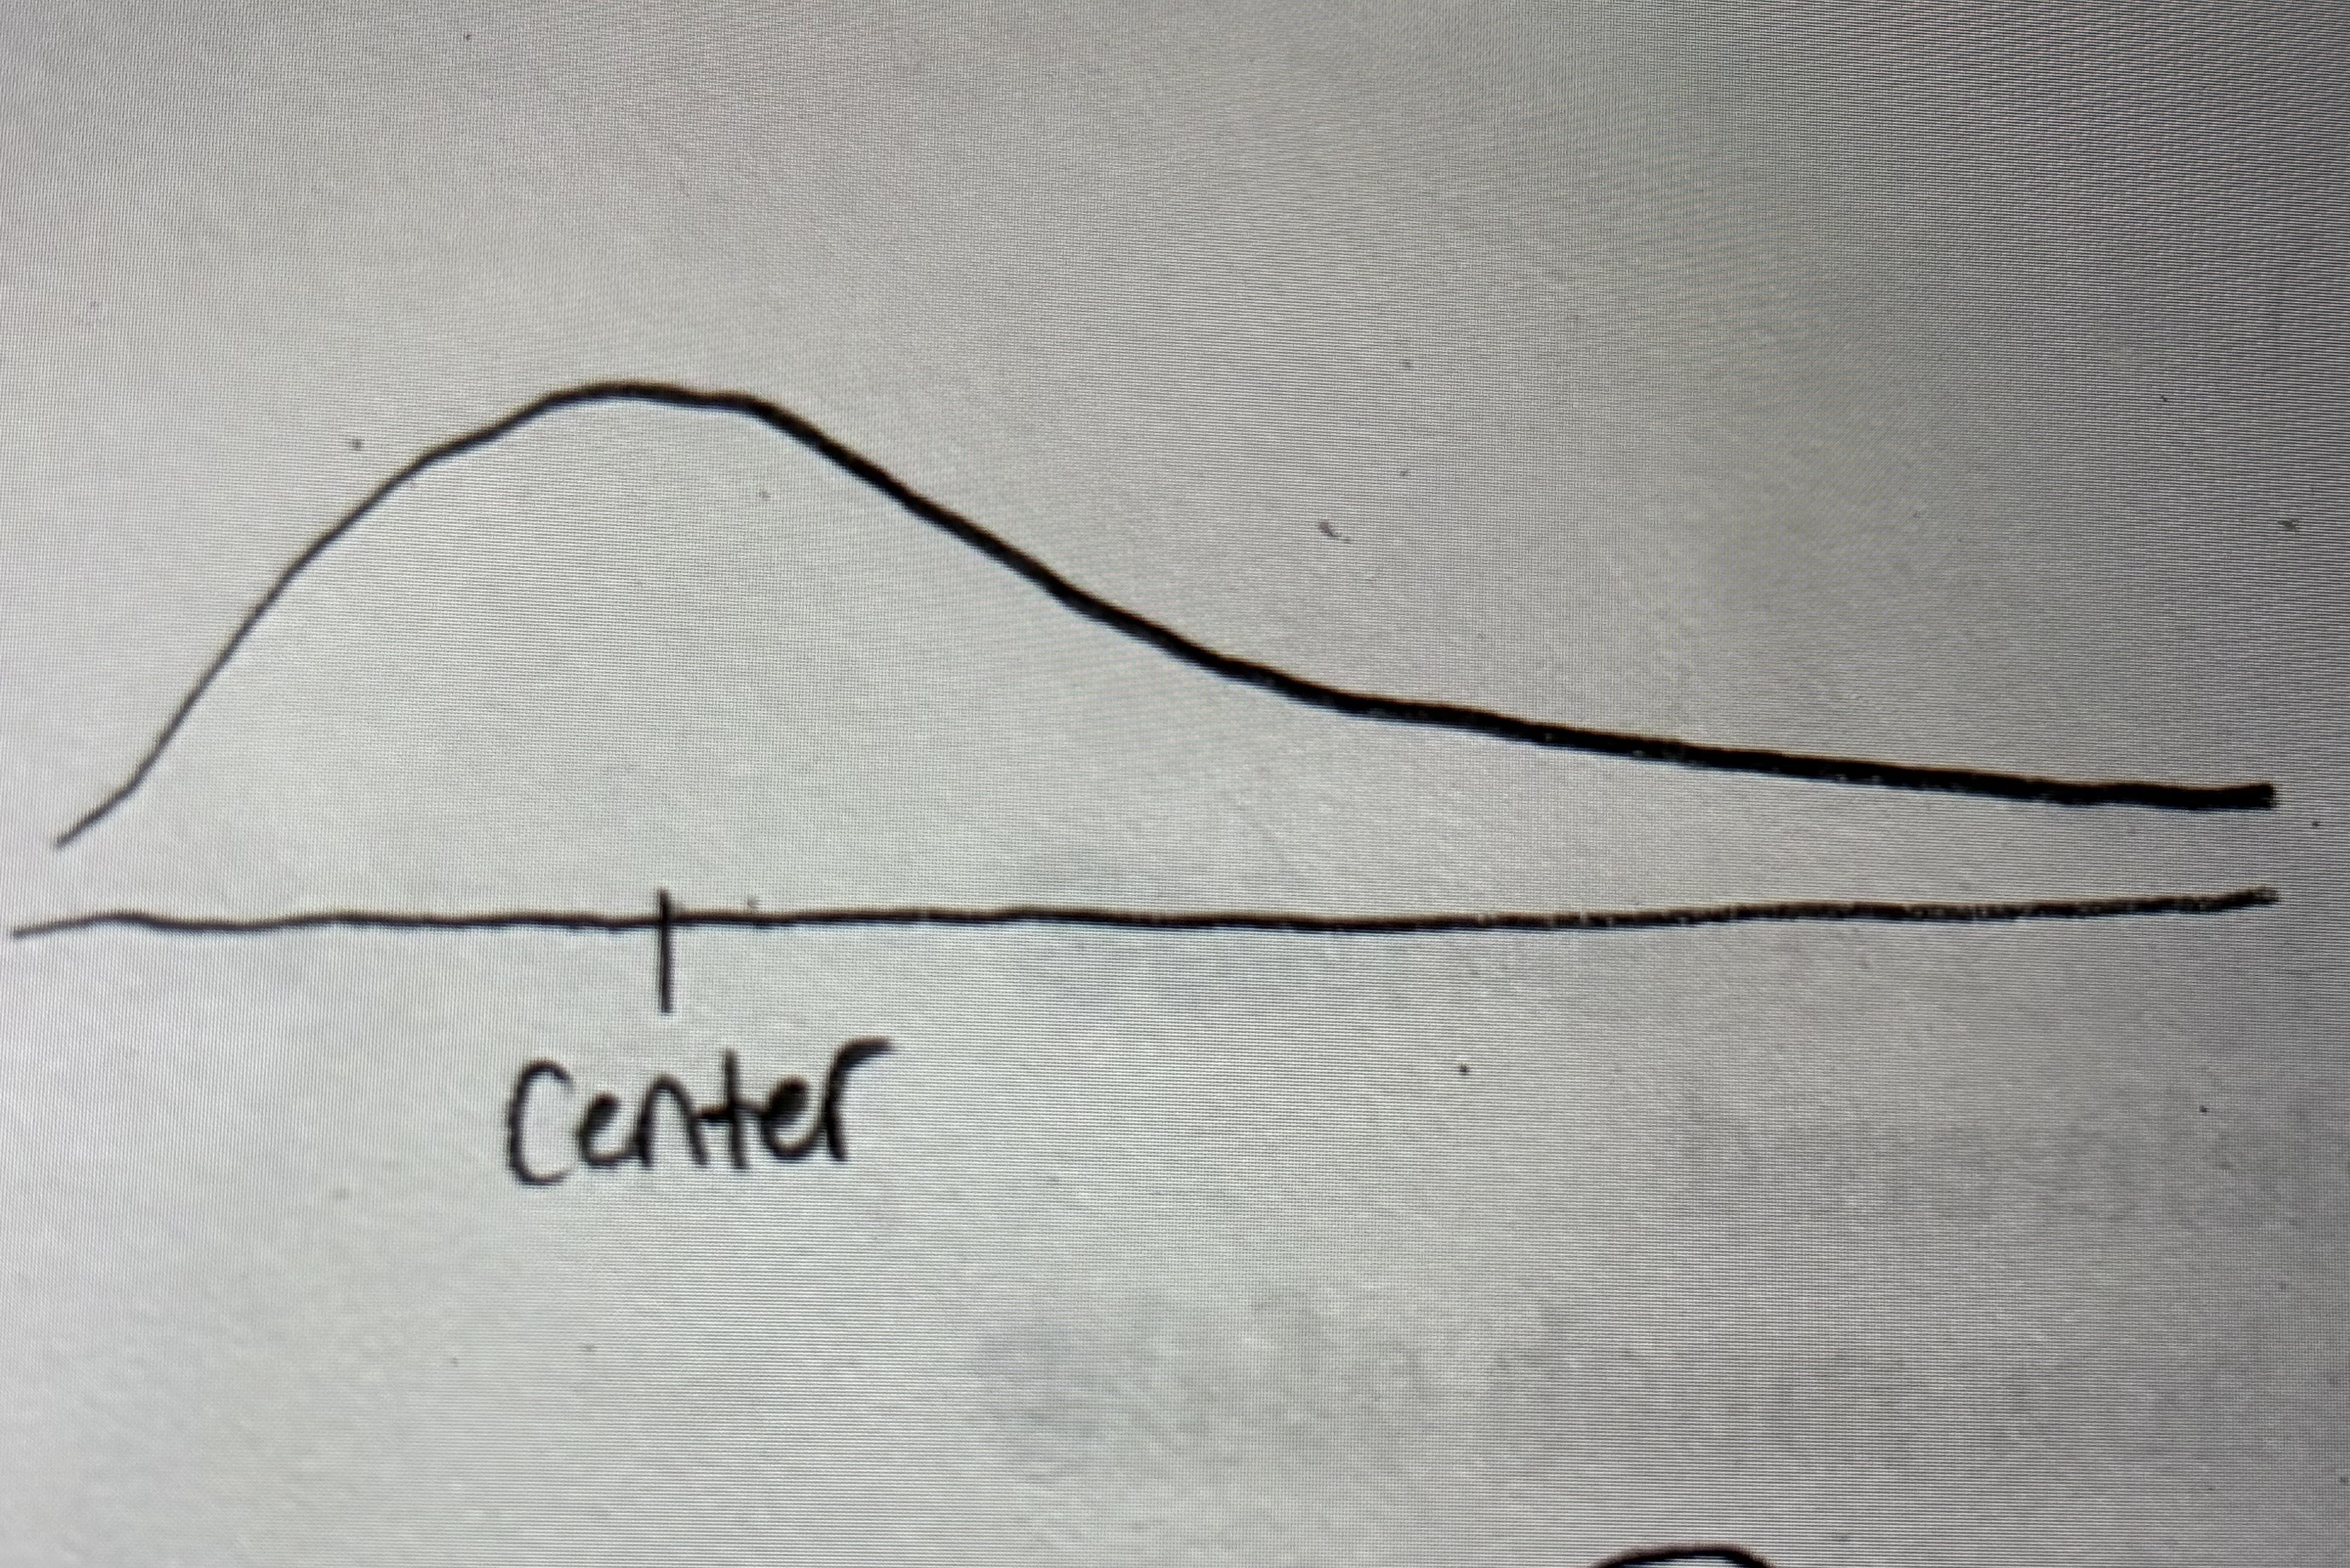
Left skewed
also known as negatively skewed
Data-
Number days of snowfall
Grades on a test
Life expectancy
Symmetric Graph