Looks like no one added any tags here yet for you.
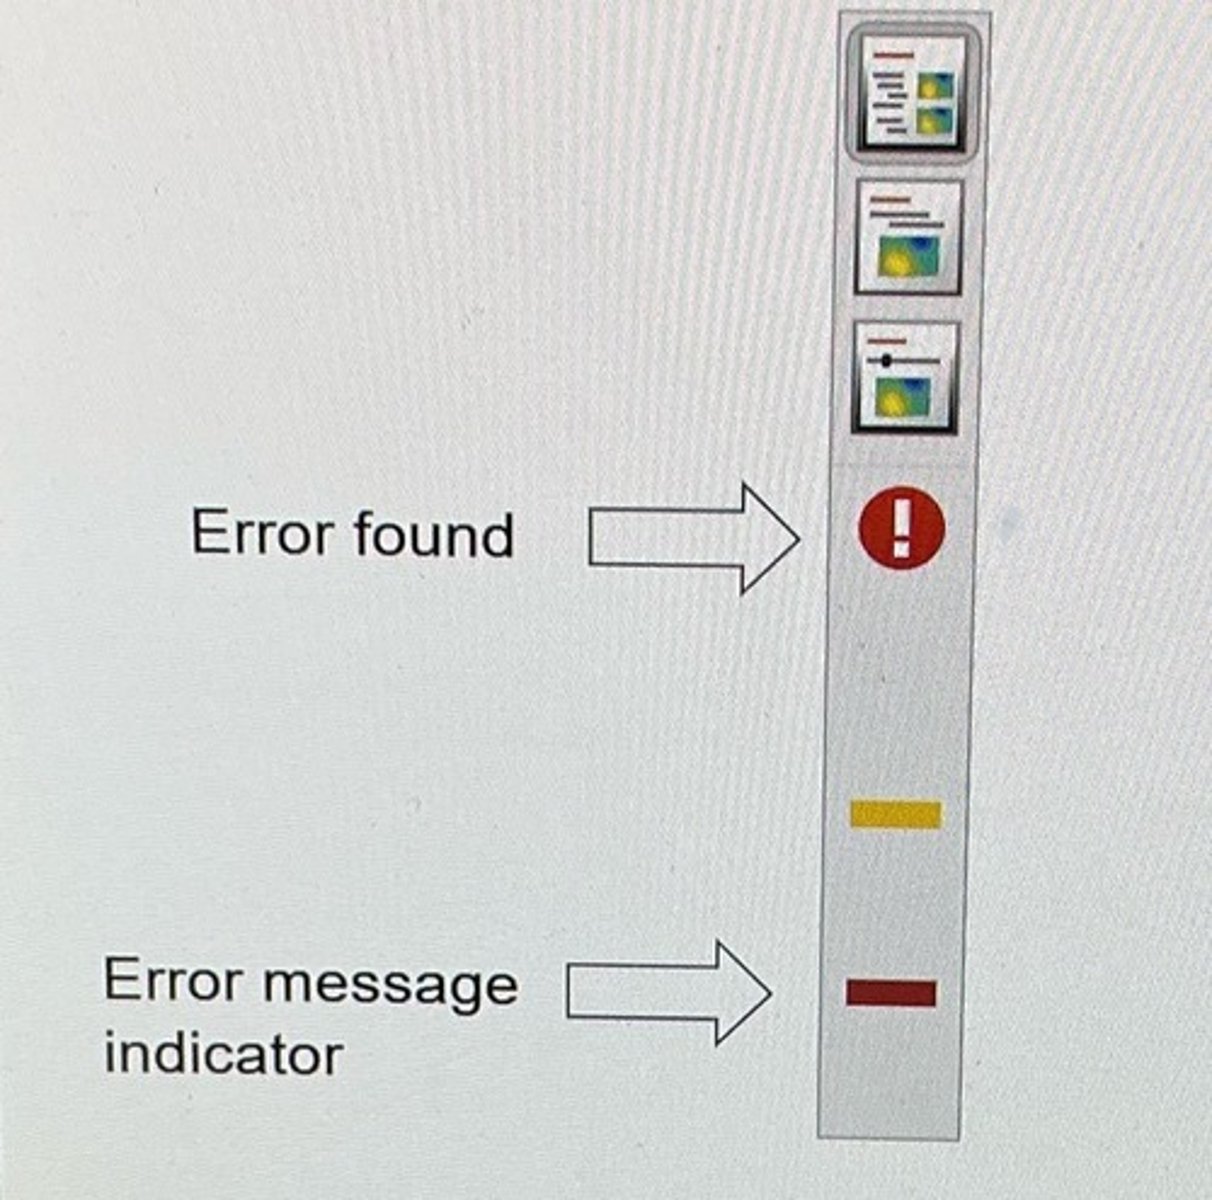
Error icon
Shows where code is invalid
Array
orderly arrangement of numbers, terms, or symbols. (Columns and rows)
Square Brackets
How you create an array.
ex y = [7 9] creates the array 7 9
also called a row vector
Row vector
Array with one row and multiple columns
[ ; ] (square brackets separating data with semicolons)
creates a column vector
y = [7;9] produces
7
9
Matrix
Made with a combonation of rows and column's
Ex: c = [ 5 6 7; 8 9 10]
creates
5 6 7
8 9 10
:
colon is how you create evenly spaced row vectors
1:9 creates
1 2 3 4 5 6 7 8 9
more practial for larger rows
How to change spacing when using a colon :
add step inbetween
Ex 22:2:26 would produce
22 24 26
If you know the number elements instead of the spacing use what command
linspace(starting number, ending number, number of elements)
How to convert linspace and : into columns instead of rows?
Use ' at the end
Ex linspace(1, 5, 3)'
rand(row, column) command
creates random matrices of random numbers, number in parentheses denotes how large it is
Ex rand(5) creates a 5 by 5 matrix
How to create a matrix of certain numbers
use the number in place of rand
ex. zeros(3, 2)
0 0 0
0 0 0
How to extract a single data point from a matrix
variable = datafilename(row, column)
End
Refers to last row or column
: when extracting data points
When x = data(:, 2)
The colon refers to all the elements in the second column
So it will extract a whole row or a whole column
Or it can set a range
ex y = data(:, end-1:end) extract's the last two columns of data
How to change a single number in a matrix
dataname(element location) = new value
Getting max and mins
max(dataname)
.*
Preforms element wise multiplication
Size function
Tells you rows and columns in a data set
You can also define rows and columns
Ex [r, c] = size(data) will produce r = # of rows and c = # of columns
How to create a random matrix with min and max numbers and a specific amount of rows and columns
Variable name = randi([lowest number, highest number], number of rows, number of columns)
Hold on command
Plots two functions on the same graph
Plot(x, y, "specifications")
Hold on
Plot(x, y, "specifications")
Hold off
Plots no longer on the same graph
Vector plotting with line width
Plot(y, linewidth = #)