Transport of Oxygen (Haemoglobin)
1/11
There's no tags or description
Looks like no tags are added yet.
Name | Mastery | Learn | Test | Matching | Spaced |
|---|
No study sessions yet.
12 Terms
Adaptations of Erythrocytes (RBCs)
Biconcave shape maximizes SA for gas exchange
Small and flexible to pass through narrow capillaries
No nucleus - more room to carry respiratory gases (O2)
Packed with Haemoglobin (Hb)
Haemoglobin (Hb)
Made up of 4 globular proteins (amino groups)
4 Fe2+
allows RBCs to carry respiratory gases (especially O2)
It has an affinity (attraction) for oxygen (can carry 4 O2 molecules)
When Hb becomes oxygenated, it’s known as oxyhaemoglobin
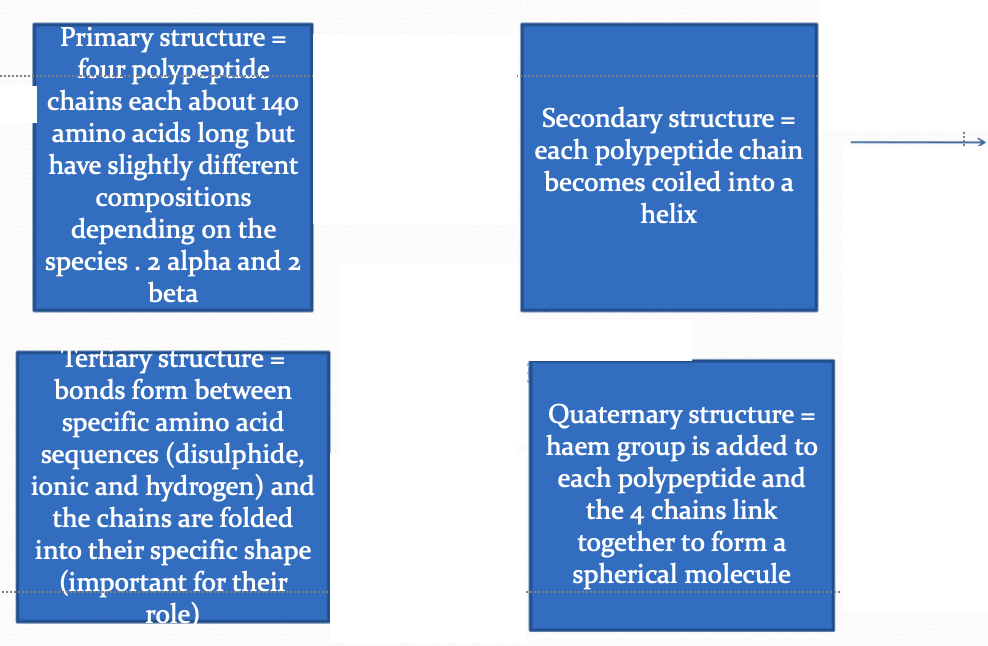
The structure of Hb
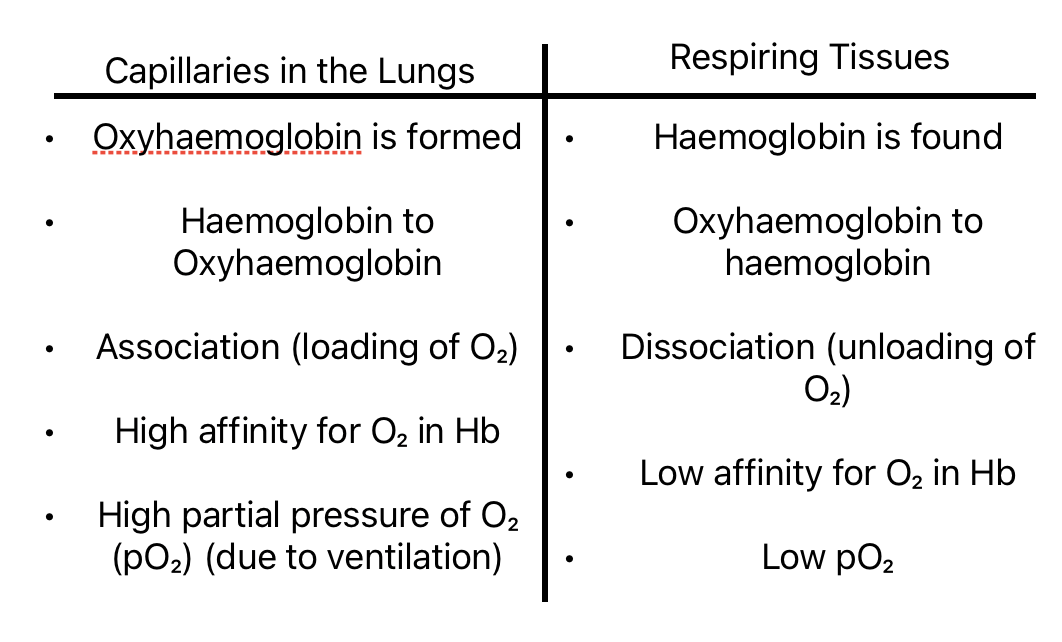
O₂ Transport: Capillaries in the lungs and respiring tissues
Describe the quaternary structure of Hb
Haem group is added to each polypeptide and the 4 chains link together to form a spherical molecule
Explain how DNA leads to different Hb molecules having different affinities for O₂
Different primary structure resulting in a different secondary, tertiary and quaternary structure
When the body is at rest only 1 of the 4 O₂ molecules carried by Hb is normally released into the tissues. Suggest why this could be an advantage when the organisms becomes more active.
Faster rate of respiration;
More CO2 produces and so more O2 dissociated at respiring tissues to meet the increased demands
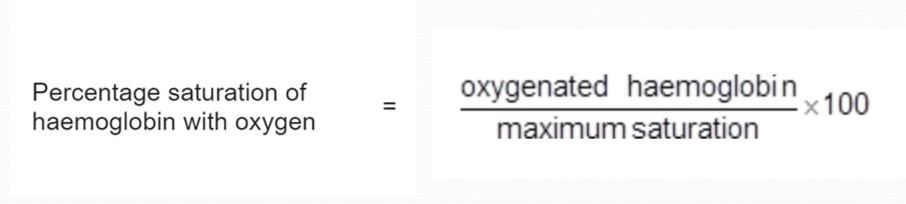
Formula for % saturation of Hb with O2
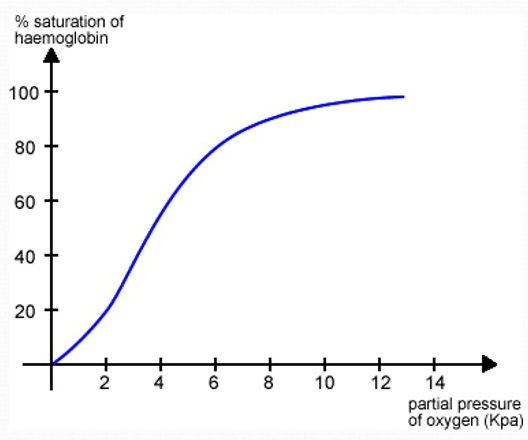
O2 Dissociation Curve
After the 1st O2 molecule associates, the conformation (shape) of Hb changes
Conformational changes makes it easier for the 2nd and 3rd O2 molecule to associate
It’s difficult to associate a 4th O2 molecule . This is because the Hb becomes full and O2 struggles to find a free binding site - curve plateaus below 100%
The effect of exercise in muscle tissue
More CO2 produced
More Carbonic Acid (H2CO3) formed
More H+ dissociated - RBC is more acidic
Greater the shape change of Hb
More O2 dissociation
Meets the demand of the respiring muscle cells
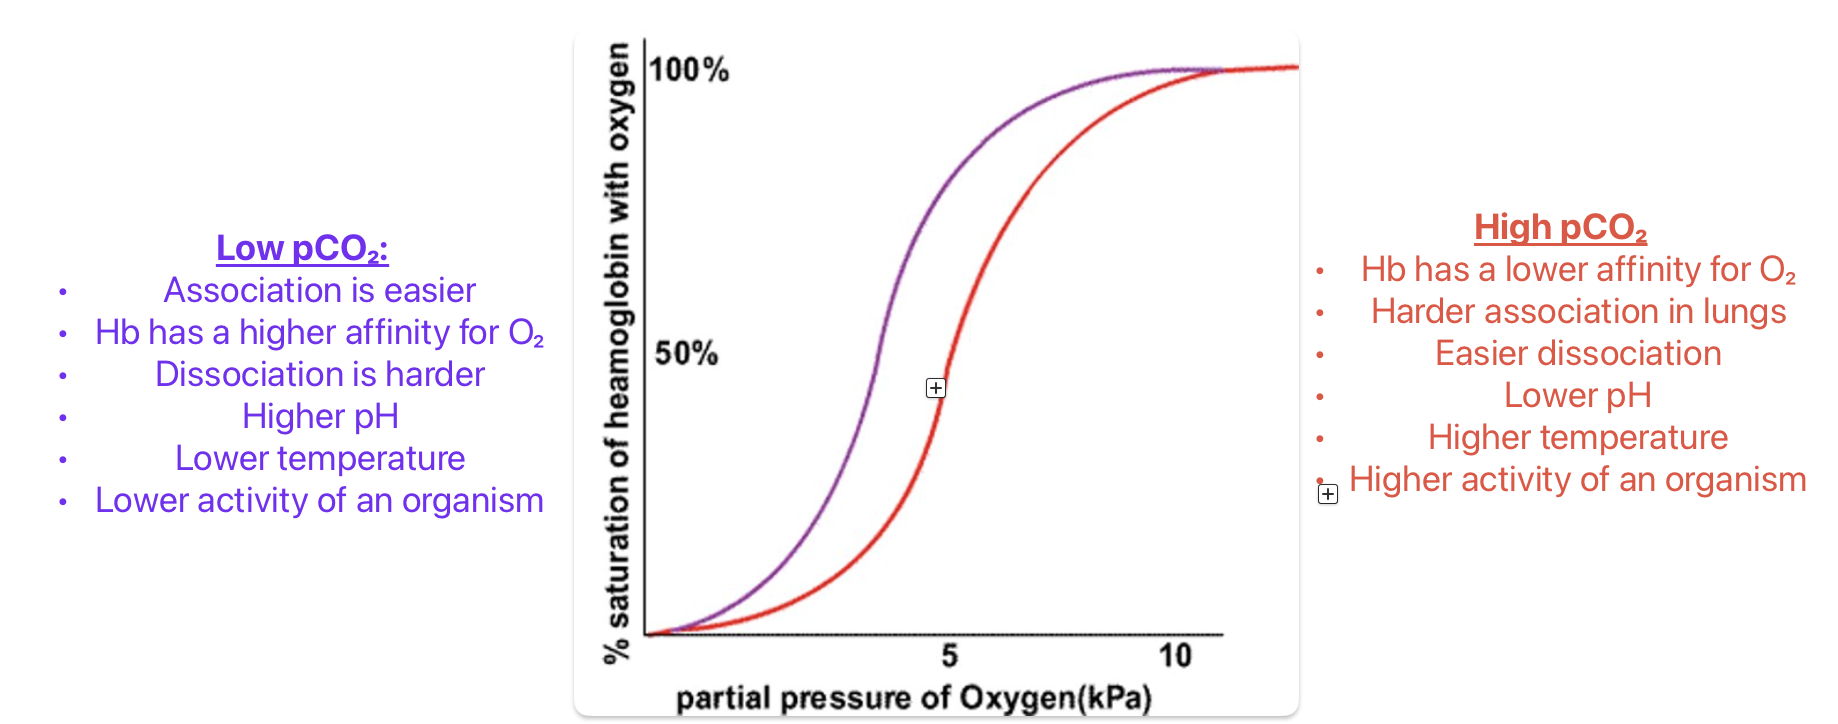
CO2 effect on O2 dissociation - Bohr effect
In a CO2 - rich environment (all respiring tissue) more O2 dissociates from oxyhaemoglobin
O2 dissociation curve shifts to the right
Low pCO₂ vs High pCO₂ effect on graph