MHS AP Psych Modules 7-8
1/23
Earn XP
Description and Tags
Ap psych workbook answers for modules 7-8
Name | Mastery | Learn | Test | Matching | Spaced |
|---|
No study sessions yet.
24 Terms
How does animal research help psychologist better understand human behavior?
Animals share a common biology with humans
They can be used to test experimental treatments like surgeries or vaccines
Many animals share the same behaviors as humans
Describe each ethical guideline:
Informed consent
Participants need to know what they are getting into before volunteering
Parents give informed assent if their children can’t consent (not 18)
Harm
Avoid all unneeded harm/discomfort mentally and physically
Confidentiality
Do not share info/data/results about the student. Hippocrates’ Oath
Deception
Keep deception to a minimum, but sometimes deception is necessary for a study to work (Using a confederate). Afterwards, participants must be told they were decepted
Debriefing
Participants must be told of the research/methodology/findings the researchers found after the study is over
IRB
Group that reviews and approves research studies based on if they are humane/ethical
What are descriptive stats?
They describe characteristics, and provide different ways to describe the data. Includes mean, median, mode, range, and standard deviation
Mean
Average. Sum of all data and divide by # of data points
Mode
The most common datapoint in a dataset
Median
Sort the data from least to greatest and pick the value in the middle. (Average the 2 middle ones if the dataset is even)
What is data skew?
Data skew is when the data is influenced by a few way out or outlier scores.
Positive Skew
The outliers boost the mean up. the mean is less than the median which is less than the mode. For example, 65% of households make less than the average annual income because the average is increased by the # of billionaires
Negative Skew
The outliers bring the mean down. Mean is less than median which is less than mode. A baby in a group of elderly people
Bimodal distribution
More than one “peak”/mode in the graph
Range
Span of scores in a dataset. Biggest-smallest
Std. Dev.
Way to describe how spread out the data is.
What is a normal curve?
A normal curve is when the mean, median and mode are all equal.
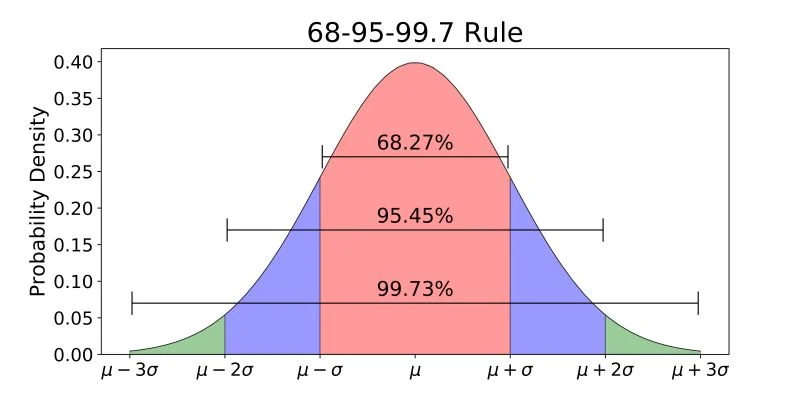
68-95-99% rule
68% of the data is between -1 sigma (unit for 1 standard deviation) or +1 sigma.
95% of the data is between -2 and +2 sigma
99% of the data is between -3 and +3 sigma
Percentile:
If something is +1 sigma, then it is in the 84% percentile
If it is +2 sigma, then it is 13.5% above that, 97.5% percentile
If it is +3 sigma, than it is 2% above that again, so 99.5% percentile
Inferential statistics.
Allows someone to infer or draw conclusions. Determines how reliable/relevant the data is. Statistical significance and effect size.
Stat. Significance
How likely the results of a study were due to chance. This simply means that the results are consistent/reliable not that there is an actual significant effect. The measurement is p and p<0.05 for the research to be taken seriously.
Effect size
Term that quantifies the actual significance of the difference between 2 groups. Sometimes the p value might be low, but there will be no noticeable difference because the effect size is small.
3 things to keep in mind when generalizing conclusions
Representative samples are better than biased ones
Less variable observations are more reliable (not better) than more variable ones
More cases are better than fewer