government intervention in markets
1/60
There's no tags or description
Looks like no tags are added yet.
Name | Mastery | Learn | Test | Matching | Spaced | Call with Kai | Chat |
|---|
No analytics yet
Send a link to your students to track their progress
61 Terms
reasons for government intervention → to achieve efficiency
key assumption of markets: free markets allocate resources efficiently
allocative efficiency: resources are allocated to produce the combination of goods and services most wanted by society
productive efficiency: goods and services are produced at
the lowest possible average cost of production based on current technology
however, some markets when left on their own, generate allocative and/or productive inefficient outcomes ⇒ government
intervenes to correct these inefficiencies in order to achieve efficiency
reasons for government intervention → to reduce inequity
inequity: the situation where the distribution of economic welfare is unfair
equity: the situation where the distribution of economic welfare is fair
free markets can generate inequitable outcomes where the rich enjoy an unfairly disproportionate amount of a country’s resources compared to the poor, with the poor having a lack of access to necessities ⇒ governments intervene in these markets to redistribute welfare from the rich to the poor to reduce inequity
reasons for government intervention → to raise tax revenue
a government’s expenditure is funded mainly through tax revenue, and hence funding from taxes to implement policies such as subsidies is needed to allow a government to achieve its aim ⇒ governments intervene in markets to raise tax revenue
allocative efficiency → definition
allocative efficiency is achieved when resources are allocated to produce the combination of goods and services most wanted by society, such that society’s welfare is maximised
allocative efficiency
allows one to better evaluate the outcomes of the various government policies implemented ⇒ has the policy improved or worsen society’s welfare
method: determine whether the sum of consumer and producer surplus is at its maximum
consumer surplus is represented by the area between the market
demand curve and the equilibrium price (area A), and producer surplus is represented by the area between the market
supply curve and the equilibrium price (area B)society’s welfare can be represented by the sum of consumer surplus and producer surplus (areas A and B)
in the absence of market failure, the (perfectly competitive) free market via the price mechanism, allocates resources efficiently ⇒ the free market equilibrium outcome results in a socially optimal allocation of resources where the sum of the consumer and producer surplus is at its maximum
government intervention in such markets would likely be for equity reasons but may also result in inefficient outcomes
consumer surplus and producer surplus → definition
consumer surplus: difference between the maximum price that consumers are willing and able to pay for a given quantity; and the market price
producer surplus: difference between the market price; and the minimum price that producers are willing and able to sell for a given quantity
equity → definition
equity is achieved when there is fairness in the distribution of economic welfare
equity
while the allocation of resources in a free market (without government intervention) may be efficient, it may not be equitable
inequity in markets often occurs when the market for necessities become inaccessible to lower income consumers when left to the free market → often due to equilibrium prices in the
market for necessities being too high because of high demand and/or low supplycan look at welfare distribution between: different groups of consumers (higher vs lower-income households), and consumers and producers
concept of equity exists in the realm of normative economics → placing value judgements on the concept of ‘fairness’
no objective way to distribute resources in the most equitable manner → what distribution is considered fair and
what goods are considered needs may be different for different economic agents in a society, and for different societiesdifferent notions of fairness across time → what is deemed as an equitable distribution now could be argued to be inequitable in the future
when looking at equity across different consumer groups:
first determine whether the good or service in question is a need or a want
needs: goods and services that are required for basic survival and societies may deem them as basic human rights, regardless of whether one can afford them ⇒ essential goods and services
if equilibrium prices are too high in these markets, there is inequity → the lower-income households might be excluded from the consumption of these necessities
wants: goods and services that people desire to have but they
can go on living even without themif equilibrium prices are too high in these markets, there is less concern with equity issues since these are often seen as wants, which are not as crucial for basic survival
tools of government intervention
market-based policies → indirect taxes and subsidies which work via the price mechanism, where the government influences market price and output by altering the incentives of consumers or producers
direct controls → policies like price controls and quantity controls, which use legislation to set the level of price or output, thus inhibiting the working of the price mechanism in terms of determining the equilibrium price and quantity
taxes → definition
direct taxes: imposed by the government directly on the wealth or income of either the consumer or the producer
affects demand
indirect taxes: taxes imposed by the government on each unit of output produced or transacted
progressive direct taxes: taxes imposed on directly on wealth or income where the higher income earners pay a larger percentage of tax than the lower income earners
taxes
governments typically prefer to impose indirect taxes on producers
illustrated by a leftward shift of the supply
while an indirect tax can be levied on either the producer or the consumer, in reality, monitoring and enforcement costs are likely to be much lower if the tax is imposed on producers because there are usually fewer producers than consumers
some indirect taxes are imposed on the consumers
nature: specific or ad valorem
specific or ad valorem tax → definition
specific tax: charges a fixed dollar amount for each unit transacted
parallel leftward shift of the supply curve
ad valorem tax: charges a percentage of the pre-tax price of the good
leftward pivot of the supply curve about the origin
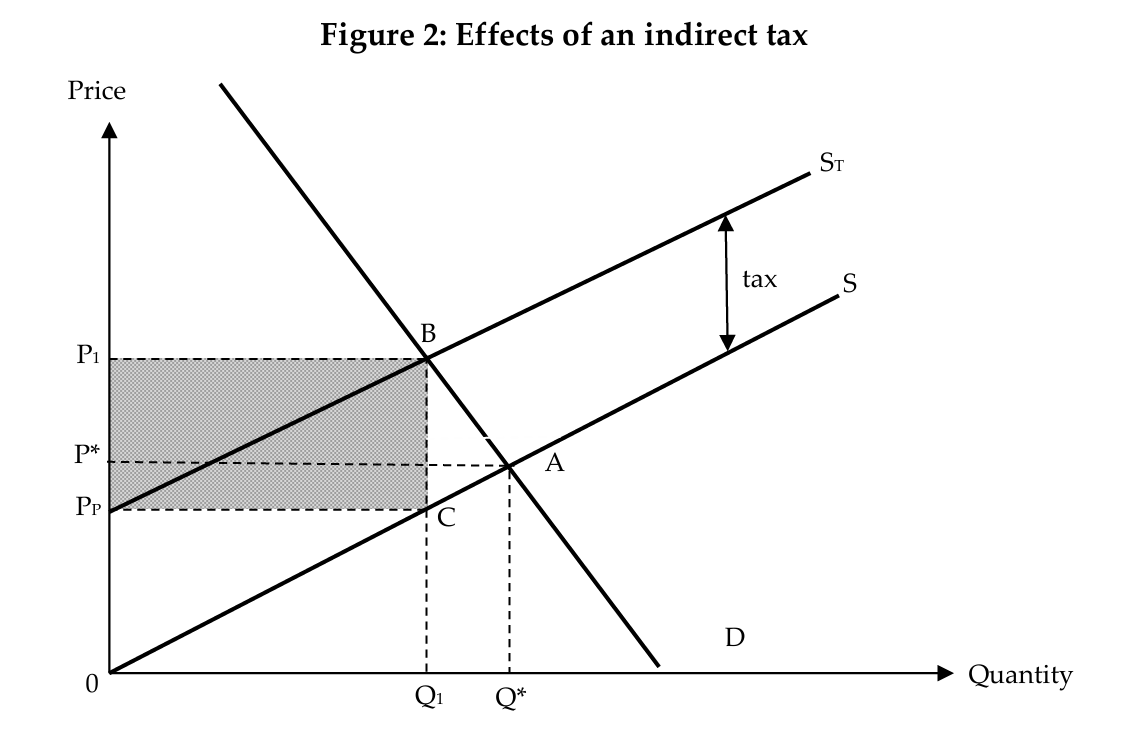
effects of an indirect tax on consumer expenditure and producer revenue
an indirect tax causes a rise in the equilibrium price to P1 and a fall in the equilibrium quantity to Q1
the cost of production rises, causing the supply curve to shift upwards by the tax amount from S to ST
the new equilibrium is where the demand curve D intersects the new supply curve ST
producers have to pay P1PP of tax to the government per unit of the good sold
consumers now pay a higher price of P1 for each unit of good consumed
producers receive a lower price of PP for selling each unit of good
before the tax was imposed, the consumer expenditure was equal to the producer revenue (area 0PAQ)
upon imposition of the tax, producer revenue decreases from 0PAQ to 0PPCQ1
whether consumer expenditure increases or decreases as a result of the tax imposed depends on the price elasticity of demand for the good
consumer expenditure increased to 0P1BQ1 because the fall in equilibrium quantity is less than proportionate to the rise in equilibrium price
the difference between the consumer expenditure and producer revenue after the imposition of the tax = amount of tax revenue the government collects from the tax (area PPP1BC)
tax revenue = tax per unit x total quantity sold
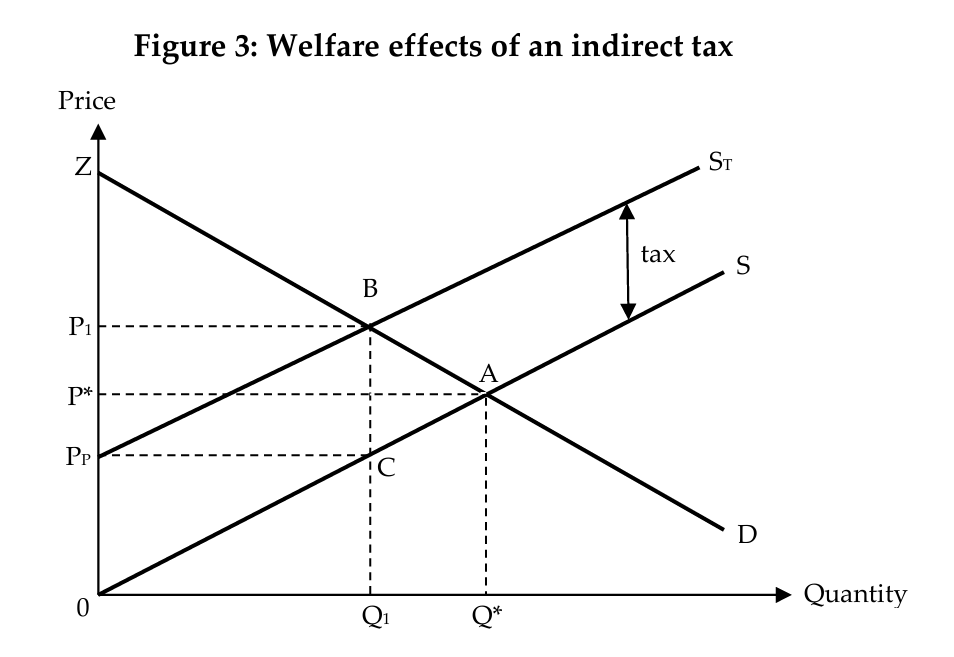
welfare effects of an indirect tax on consumer and producer surplus
imposition of an indirect tax will lower both consumer surplus and producer surplus
consumer surplus decreases by area P1BAP*
before the indirect tax, the consumer surplus is represented by the area ZAP*
after the indirect tax, the consumer surplus is represented by the area ZBP1
producer surplus decreases by the area P*ACPP
before the indirect tax, the producer surplus is represented by the area P*A0
after the indirect tax, the producer surplus is the area PPC0
part of the loss in consumer surplus and producer surplus is transferred to the government as tax revenue (area P1BCPP)
remaining loss in consumer and producer surplus that is not gained by anyone is considered as a welfare loss to society ⇒ deadweight loss (area ABC)
whether the indirect tax will hurt consumers or producers more depends on the relative price elasticities of demand and supply (PED and PES)
when an indirect tax is imposed, the more price inelastic the demand relative to supply, the greater the adverse effect on consumers relative to producers
demand is relatively more price elastic than supply
the fall in consumer surplus (area A) is less than the fall in producer surplus (area B)
demand is relatively more price inelastic than supply
the fall in consumer surplus (area C) is larger than the fall in producer surplus (area D)
PED and PES affect who suffers more as they reflect which economic agent is less flexible
the more price inelastic the demand, the less able consumers are able to respond to price changes caused by the tax and so the more they will suffer in terms of a reduction in consumer surplus
the more price inelastic the supply, the less able producers are able to respond to the price changes caused by the tax and the more they will suffer in terms of the reduction in producer surplus
benefits of taxes
increases the equilibrium price and reduces the equilibrium quantity
intended consequence: reduce the quantity consumed in the market
if governments need to rebalance their budgets, tax rates may be raised to reap higher tax revenues
limitations of taxes
demand for good is very price inelastic ⇒ limited effectiveness of achieving the intended consequence of reducing quantity consumed in the market
the rise in price would only lead to a less than proportionate fall in quantity demanded (and hence equilibrium quantity)
to evade taxes, producers may resort to smuggling ⇒ limit the effectiveness of the tax to reduce quantity consumed in the market
demand for good is very price elastic ⇒ limited effectiveness of achieving the intended consequence of raising tax revenue in the market
the rise in price would lead to a more than proportionate fall in quantity demanded (and hence equilibrium quantity)
as tax revenue is given by the per unit tax multiplied by the equilibrium quantity, the lower equilibrium quantity due to a price elastic demand would result in a lower tax revenue as compared to when an indirect tax was imposed in a market where the demand for the good is more price inelastic
unintended consequences of indirect taxes
in perfectly competitive markets where there is allocative efficiency, government intervention through the imposition of indirect taxes reduces consumer and producer surplus, resulting in deadweight loss to society
indirect taxes will increase prices ⇒ greater inequity in markets for essential goods if the lower-income groups may no longer be able to afford these necessities
even though higher tax rates aid in rebalancing the government’s budget, it often cannot be a long term policy due to the decrease in producer revenue which would reduce firms’ profits, ceteris paribus
indirect subsidy → definition
indirect subsidy is a grant given by the government to encourage the production or consumption of a good or service
indirect subsidy
can be used by the government for equity reasons; reducing the
price of necessities so that they remain affordable for consumers → equity argument is only valid in the case of necessitiesnature: specific or ad valorem
specific: parallel rightward shift of the supply curve by the
amount of the subsidyad valorem: rightward pivot of the supply curve around the
origin
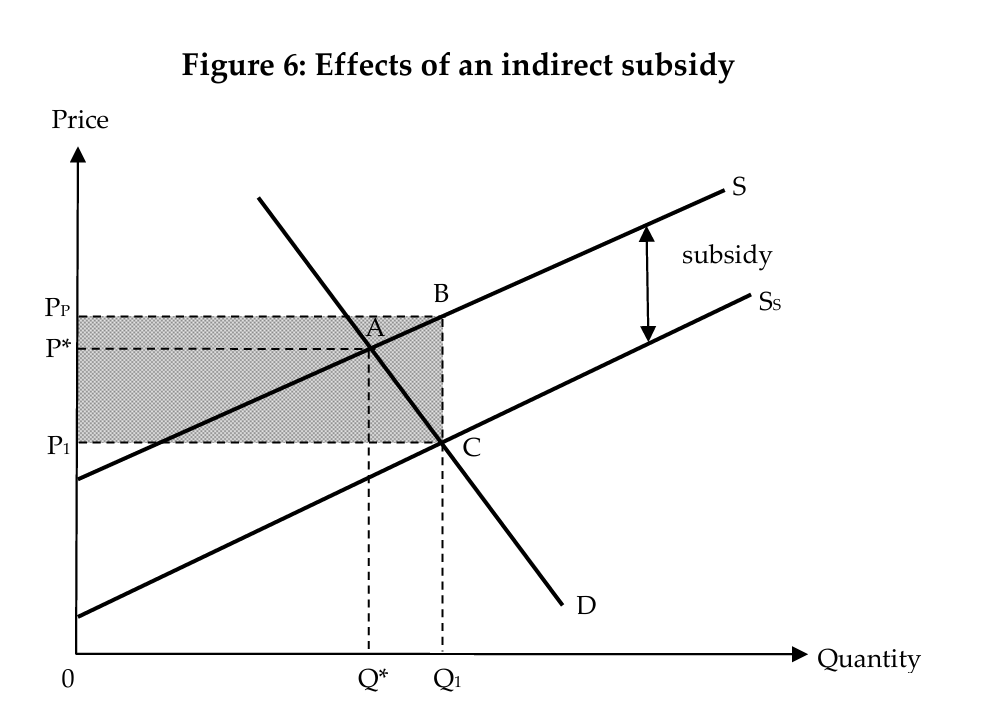
effects of an indirect subsidy on consumer expenditure and producer revenue
a subsidy causes a fall in the equilibrium price to P1 and a rise in the equilibrium quantity to Q1
a subsidy lowers the cost of production, causing the supply curve to shift downwards by the amount of the subsidy from S to SS
the new equilibrium is where the demand curve D intersects the new supply curve S
the price that producers receive is higher at PP
consumers pay a lower price of P1 after the subsidy
producers also receive an additional P1PP of subsidy per unit from the government
before the subsidy, the consumer expenditure was equal to the producer revenue (area 0PAQ)
after the subsidy, producer revenue increases from 0PAQ to 0PPBQ1
whether consumer expenditure increases or decreases as a
result of the subsidy depends on the price elasticity of demand for the goodconsumer expenditure decreased from 0PAQ to 0P1CQ1 because the increase in equilibrium quantity was less than proportionate to the fall in equilibrium
price
difference between the consumer expenditure and producer revenue after the subsidy = amount that the government spends on subsidising the good (area P1PPBC)
subsidy expenditure = subsidy per unit x total quantity sold
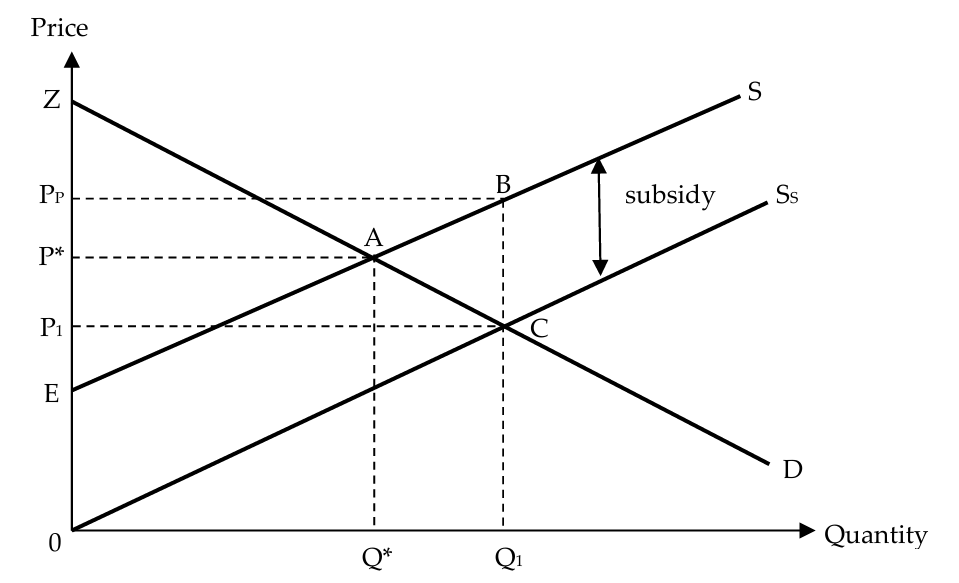
welfare effects of an indirect subsidy on consumer and producer surplus
provision of an indirect subsidy will increase both consumer surplus and producer surplus
consumer surplus increases by the area P*ACP1
before the subsidy, the consumer surplus is represented by the area ZAP*
after the subsidy, the consumer surplus is represented by the area ZCP1
producer surplus increases by the area PPBAP*
before the subsidy, the producer surplus is represented by the area P*AE
after the subsidy, the producer surplus is represented by the area PPBE
while the subsidy expenditure by the government is given by the area PPBCP1, the total gain in consumer and producer surplus is only the combined area of P*ACP1 and PPBAP ⇒ a net loss of society’s welfare as a result of the subsidy → deadweight loss (area ABC)
whether the indirect subsidy will benefit consumers or producers more depends on the relative price elasticities of demand and supply → PED and PES
when a subsidy is given, the more price inelastic the demand relative to the supply, the more consumers will benefit relative to producers
demand is relatively more price elastic than supply
the increase in producer surplus (area A) is larger than the increase in consumer surplus (area B)
demand is relatively more price inelastic than supply
the increase in producer surplus (area C) is smaller than the increase in consumer surplus (area D)
benefits of subsidies
a subsidy reduces the equilibrium price and increases the equilibrium quantity
intended consequence: reduce price and/or encourage the production or consumption of a good or service ⇒ especially useful in improving equity in the market for necessities
the producer revenue increases; the impact on consumer expenditure, however, depends on the price elasticity of demand for the good
both consumer and producer surplus increase when a subsidy is
granted
limitations of subsidies
subsidies put a strain on the government’s budget
over time, a government may end up with a budget deficit where the tax revenue collected is not enough to cover all government expenses ⇒ government expenditure > tax revenue
might result in difficulties in sustaining the intended consequence of the subsidies in the long run
if subsidies are cut due to a lack of government revenue in future, the intended outcome of improving equity would not be achieved in the long run
unintended consequences of subsidies
in order to address the budget deficit, the government may have to raise taxes to finance the budget deficit
a rise in direct taxes may result in adverse unintended consequences which include reducing the incentive to work and invest, leading to a slowdown in economic growth
rise in indirect taxes could also result in allocative inefficiency in other markets
given the limited government funds available for spending, any amount spent on subsidies would incur an opportunity cost to society
these funds will have to be diverted away from the next best use such as education, healthcare or housing
in perfectly competitive markets where there is allocative efficiency, government intervention through the giving of subsidies results in a deadweight loss to society
price ceiling
price ceiling is defined as the legal maximum price at which a good can be sold
for the price ceiling to be effective, it needs to be set below the market equilibrium price
usually used by the government for equity reasons → protect consumers from high prices of necessities by preventing the prices from rising above a certain level so they remain affordable ⇒ argument is only valid in the case of necessities
effects of a price ceiling on equilibrium price and quantity
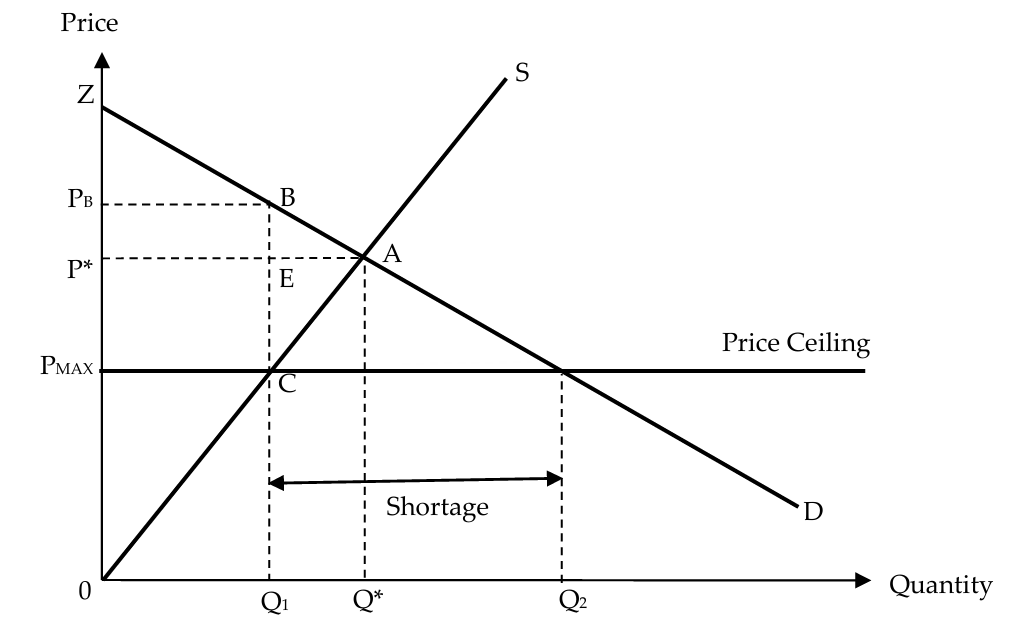
after a price ceiling at PMAX is imposed, the price falls to PMAX and the quantity transacted decreases to Q1
shortage of Q1Q2 units → the quantity demanded Q2 is greater than the quantity supplied Q1
both consumer expenditure and producer revenue decreases from PAQ0 to PmaxCQ10
due to the price ceiling, the price mechanism cannot work to clear the shortage and the good has to be distributed using other methods
queues: consumers buy the good on a first-come first served basis
balloting
rationing: issuing purchase coupons to each household

welfare effects of a price ceiling on consumer and producer surplus
consumer surplus
before the price ceiling: consumer surplus (area ZAP*)
after the price ceiling: consumers pay a lower price PMAX, while consumption falls to Q1 ⇒ consumer surplus (ZBCPMAX)
consumer surplus may increase or decrease depending on whether the rise in area P*ECPMAX is greater or less than the fall in area BAE → dependent on PES and PED respectively
since supply is price inelastic and demand is price elastic ⇒ gain in consumer surplus (area P*ECPMAX) is greater than the loss in consumer surplus (area BAE), the price ceiling causes consumer surplus to increase
producer surplus
producer surplus decreases by the area P*ACPMAX
before price ceiling: producer surplus (area P*A0)
after price ceiling: the price that producers receive falls to PMAX, and a lower quantity Q1 is sold ⇒ producer surplus (area PMAXC0)
final effect on society’s welfare
equivalent to the sum of the changes in the producer and consumer surplus
although area P*ECPMAX is lost by the producers, it is transferred to the consumers
the overall deadweight loss to society → area ABC
benefits of price ceiling
intended consequence: prices in the market will be capped
at a level deemed affordable by the government, improving the equity situation in the marketprotects consumers from higher prices in essential goods and services, increasing their ability to consume such goods
limitations/unintended consequences of price ceiling
the quantity transacted in the market has fallen, from Q* to
Q ⇒ some consumers who were initially able to enjoy the good (albeit at a higher price), may now no longer be able to consume the goodwhile prices are kept low, a shortage arises as quantity demanded exceeds quantity supplied at the maximum price
even with accompanying policies to distribute the goods, equity may not be improved as not everyone who
needs the good will have access to the good
resulting shortages may give rise to black markets, where the good is illegally sold at prices higher than the price ceiling
in perfectly competitive markets where there is allocative efficiency, government intervention through the imposition of price ceilings results in a deadweight loss to society
black market → price ceiling
black market occurs when buyers and sellers make illegal transactions without the knowledge of governments
at the maximum price, there are more buyers who are willing and able to pay for the good than there are goods available in the market
consumers who are unable to obtain the good through legal means due to the fall in quantity transacted may choose to purchase the good through these black markets
if unregulated, producers may choose to ignore the government’s price restriction and illegally sell at a higher price to consumers who have a higher willingness and ability to pay for the good
black market price is shown by PB
if producers are indeed illegally charging a higher price, then this clearly limits the price ceiling’s ability to keep prices low → possible for the black market price to be even higher than the free market price (PB > P*)
if this occurs, the price ceiling actually harms consumers, which is opposite of the intended aim of
the policy
on top of introducing a price ceiling, high costs of regulation and monitoring also have to be incurred by the government to deter black market activities to ensure that the policy is effective
price floor → minimum price
price floor is defined as a legal minimum price on which a good can be sold
for the price floor to be effective, it needs to be set above the market equilibrium price
usually used by the government to protect producers’ revenues
commonly used is in the labour market, where a minimum wage,
which serves as a price floor in the market for labour, is set to protect workers’ income by preventing their market wages from falling too low
effects of a price floor on equilibrium price and quantity
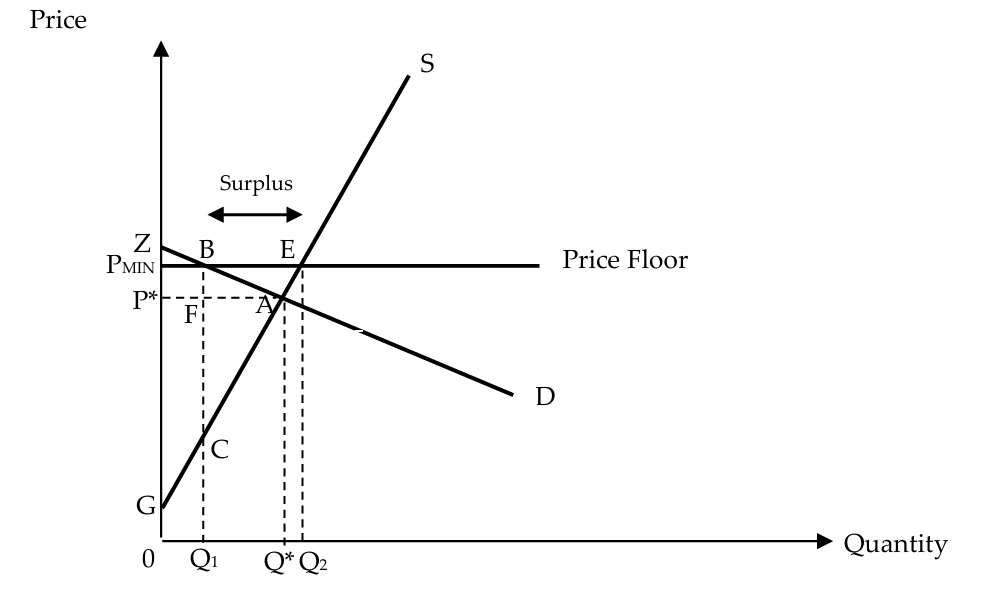
after a price floor at PMIN is imposed, the price increases from P* to PMIN and the quantity transacted decreases from Q* to Q1
surplus of Q1Q2 units ⇒ the quantity supplied Q2 is greater than the quantity demanded Q1
whether consumer expenditure and producer revenue increases or decreases as a result of the price floor depends on the price elasticity of demand for the good
consumer expenditure decreased to 0PMINBQ1 because the decrease in quantity demanded is more than proportionate to the increase in price
producer revenue would have fallen to 0PMINBQ1
defeats the purpose of the price floor as producers’ revenue and income have decreased
due to globalisation and the openness of countries to trade, many local agricultural markets actually face a price elastic demand due to the availability of substitutes from overseas ⇒ in imposing a price floor, it may result in a fall in local producers’ revenue
especially in agricultural markets, other policies must be used concurrently to manage the surplus from the implementation of a price floor, allowing for the increase in producer revenue ⇒ price support policy
price support policy → price floor
as local farmers, are likely to face a fall in their revenues with a price floor, a price support policy can be imposed to protect the prices and incomes that farmers receive for their produce + ensure food security
the farmers’ initial total revenue is shown by 0P* x 0Q*,
corresponding to area 0PAQwith a price floor, the price is now higher at PMIN, but
the quantity transacted falls more than proportionately to Q1, due to the price elastic demand for such local agricultural produce ⇒ the farmers’ total revenue
falls to 0PMINBQ1with a price floor at PMIN, the quantity demanded is at Q1 while the quantity supplied is Q2 ⇒ surplus of Q2Q1 units
to prevent the surplus from depressing prices, the government buys up this surplus, and the government spending required
to soak up the surplus is equal to area Q1BEQ2 ⇒ farmers’ revenue increases to area 0PMINEQ2the government can then deal with the purchased surplus
in a variety of waysbuffer stock scheme: surplus can be stored so that when poor harvests occur in the future, such surpluses are released into the market to prevent food shortages and escalating food prices
only feasible for food products that are relatively less perishable like wheat or milk powder
more perishable products like butter, fruits or vegetable requires refrigeration ⇒ extremely costly
surplus can be exported to other countries
as the exported price is usually lower than the domestic supported price, the government can only recover some but not all of the costs of buying up the surplus
these countries are indirectly subsidising its exports, which raises the world supply and depresses the world price of the product, causing more producers in other countries, especially the developing ones, to suffer from lower agricultural income
surplus can be donated to poorer developing countries as foreign food aid
irony is that these poor developing countries are often the ones who are doing badly in the first place partly because their agricultural markets are unable to compete with the subsidised produce coming from the developed countries

welfare effects of a price floor → without price support policy
consumer surplus
consumer surplus decreases by the area PMINBAP*
before the price floor: consumer surplus (area ZAP*)
after the price floor was imposed, consumers pay a higher price PMIN and consume less at Q1 ⇒ consumer surplus falls to area ZBPMIN
producer surplus
before the price floor: producer surplus (area P*AG)
After the price floor was imposed, while producers are willing and able to supply Q2 units of the good at the price PMIN, only Q1 units are transacted ⇒ producer surplus changes to the area
PMINBCGproducer surplus may increase or decrease depending on whether the rise in area PMINBFP* is greater or less than the fall in area FAC → dependent on PED and PES respectively
the more price inelastic the demand, the greater the gain in producer surplus (area PMINBFP*) + the more price elastic the supply, the smaller the loss in producer surplus (area FAC).
since demand is price elastic and supply is price inelastic, the gain in producer surplus (area PMINBFP*) is less than the loss in producer surplus (area FAC) ⇒ producer surplus decreases
final effect on society’s welfare
equivalent to the sum of the changes in the producer and consumer surplus
although the area PMINBFP* is lost by the consumers, it is transferred to the producers
overall deadweight loss to society is area ABC

benefits of price floor
intended consequence: protect producers’ revenues by preventing them from falling as they now face higher and more stable prices
ensures stability in supply as producers will still be incentivised
to produce the good/servicewhen a price support policy is included to complement the existing price floor, producers’ revenue will definitely increase
limitations of price floor
as price floors always result in surpluses, without the imposition of a price support policy, firms may try to evade the price control and cut their prices in order to get rid of the glut ⇒ defeats the purpose of implementing the price floor to raise prices in the first place
unintended consequences of price floor
implementing a price floor with a price support policy
puts a strain on the government’s budget
results in opportunity cost being incurred as the budget
spent on purchasing the surpluses could have been used for other purposes like building schools or hospitals
if the price floor is imposed on essential goods, the higher price could lead to greater inequity if the lower-income groups may no longer be able to afford these necessities
high prices from a price floor may cushion inefficiency
firms may be less incentivised to find more efficient methods of production and to cut their costs since their revenues and profits are being protected by the high price
high price may discourage firms from producing alternative goods which they could produce more efficiently or which are in higher demand, but which nevertheless have a lower (free-market) price
firms will become productive inefficient, as they do not produce goods and services at the lowest possible average cost of production based on current technology
in perfectly competitive markets where there is allocative efficiency, government intervention through the imposition of a price floor results in a deadweight loss to society
the price floor creates a surplus which reflects inefficient allocation of resources
in case of agricultural markets, these goods (e.g. grains)
require additional costs to be stored, incurring opportunity costs both in terms of manpower and logisticsperishables: may eventually end up going to waste in warehouses
minimum wage → price floor
minimum wage: the minimum amount of remuneration that an employer is required to pay wage earners for the work performed during a given period, which cannot be reduced by collective agreement or an individual contract
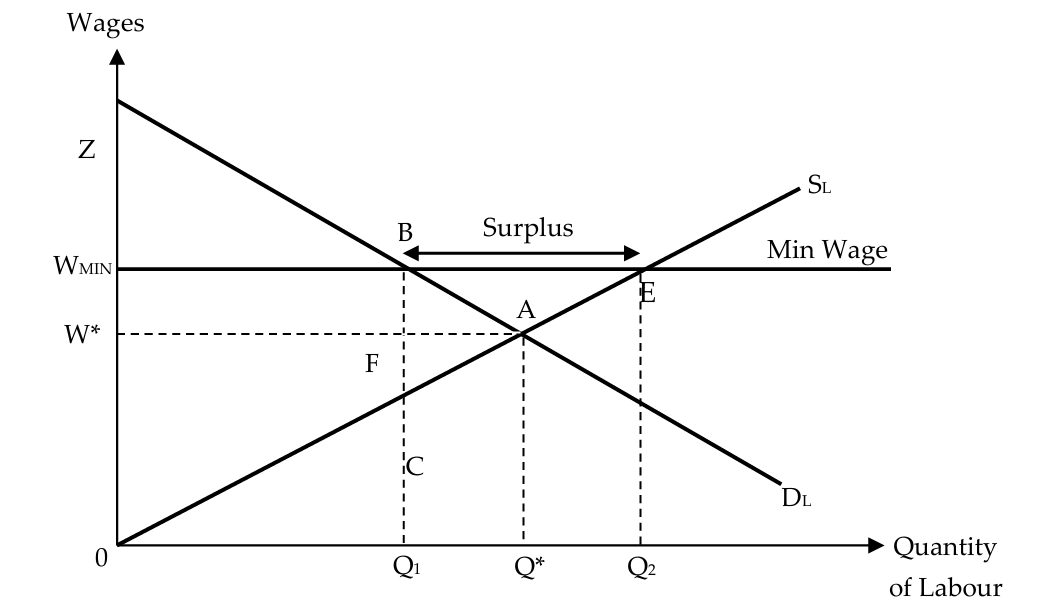
an effective wage floor is a legally established minimum wage, WMIN, set above the market equilibrium wage, W* to protect the incomes of low-wage workers ⇒ raises the wages of the bottom earners
minimum wage → in the context of singapore
the Ministry of Manpower in Singapore does not prescribe minimum wages for all workers in Singapore, whether local or foreign
the Singapore government believes that changes in wages should best be determined by market demand and supply for labour, skills, capabilities and competency to perform
the taskthe Singapore government implements policies that enable workers to become more skilled and productive, so as to raise the demand for these workers, and thus their wages instead
however, there is a minimum wage implemented in specific sectors such as the cleaning, security and landscape sectors under the Progressive Wage Model
as of March 2026, cleaning companies servicing F&B
establishments are required to pay their workers an entry-level salary of at least S$1910 each month, and subsequently give increments in tandem with skills upgrading
benefits of minimum wage (price floor)
to protect the incomes of low-wage workers
by legislating the minimum wage workers earn, it raises the wages of the bottom earners ⇒ reduces the income gap and the extent of inequity when more of these workers are better able to afford necessities
limitations of minimum wage (price floor)
level of minimum wages depends on the strength of labour unions within the industry
if labour unions are weaker in comparison to the producers, minimum wages may be depressed and thus, ineffective in reducing the income gap and the extent of inequity
minimum wages suffer from poor enforcement where producers may exploit their workers by paying wages that are below minimum wages
in cases where unemployment levels are high, workers may still be willing to work even though their wages are below the minimum wages, such that they are assured an income for survival
unintended consequences of minimum wage (price floor)
results in a surplus of labour as the quantity supplied of labour exceeds the quantity demanded ⇒ real-wage unemployment, which could end up lowering the material living standards of some of the low-wage workers
a minimum wage allows workers who remain employed to enjoy a higher wage, but it comes at the expense of workers who become retrenched as a result
there is an overall deadweight loss of area ABC to society
final effect on society’s welfare is equivalent to the sum of the changes in the producer (workers) and consumer (firms who are employing workers) surplus
quota/quantity control
quota/quantity control: a legal restriction on the quantity of goods or services that can be produced or transacted in a market
for a quota to be effective, it has to be implemented below the equilibrium quantity
a ban can be considered as an example of a quota where the output limit is set at zero
governments may decide to impose a quota to restrict the quantity of goods and services exchanged in the market
effects of a quota on equilibrium price and quantity
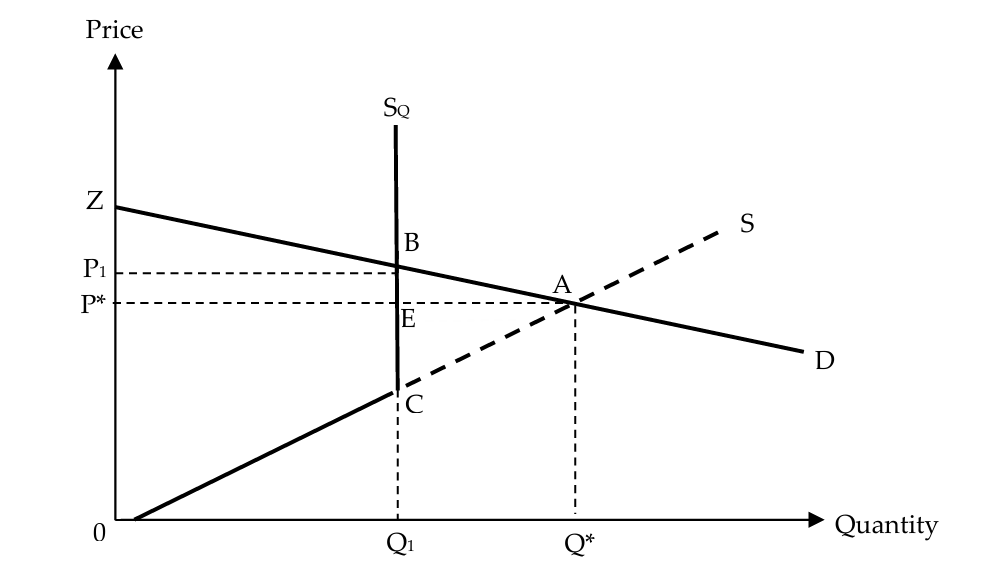
when a quota is imposed, the quota has no effect on the supply curve below output Q1 (the supply curve from 0 to Q1 remains upward sloping)
from Q1 onwards the supply curve becomes perfectly price inelastic (the supply curve is vertical at Q1)
an effective quota lowers the equilibrium quantity to Q1 and
increases the equilibrium price to P1new equilibrium occurs where the demand curve D intersects the quota supply curve SQ
whether consumer expenditure increases or decreases as a result of the quota depends on the price elasticity of demand for the good
if demand is price elastic: decrease in quantity demanded is more than proportionate to the increase in price, causing consumer expenditure to fall from 0PAQ to 0P1BQ1 + producer revenue would have fallen to 0P1BQ1
welfare effects of a quota on consumer and producer surplus
consumer surplus
consumer surplus decreases from area ZAP* to the area ZBP1
the imposition of the quota causes a reduction of consumer surplus by the area P1BAP*
producer surplus
producer surplus may increase or decrease depending on whether the rise in area P1BEP* is greater or less than the fall in area EAC → dependent on PED and PES respectively
the more price inelastic the demand, the greater the gain in producer surplus (area P1BEP*), and the more price elastic the supply, the smaller the loss in producer surplus (area EAC)
given demand is price elastic and supply is price inelastic, the gain in producer surplus (area P1BEP*) is less than the loss in producer surplus (area EAC) ⇒ producer surplus decreases
final effect on society’s welfare
equivalent to the sum of the changes in the producer and consumer surplus
although the area P1BEP* is lost by the consumers, it is transferred to the producers
the overall deadweight loss to society is area ABC

benefits of a quota
intended consequence: reduce the quantity consumed in the market
restricting the quantity of goods and services exchanged is more certain and can be achieved faster when quotas are set compared to imposing indirect taxes
limitations of a quota
additional costs incurred by the government may result in a budget deficit where the tax revenue collected is not enough to cover all government expenses → government expenditure > tax revenue
close monitoring is necessary to ensure that producers are adhering to the production limit
result in difficulties in sustaining the effect of the quota in the long run
if quotas are removed due to a lack of government revenue in future, the intended outcome of quantity control would not be achieved in the long run
unintended consequences of a quota
in perfectly competitive markets where there is allocative efficiency, government intervention through the imposition of a quota results in a deadweight loss to society
if the quota is imposed on essential goods, the higher prices could lead to greater inequity if the lower-income groups may no longer be able to afford these necessities
direct provision to reduce inequity
the situation where the government provides the good or service by either producing it or by outsourcing production to a private firm which can produce it at a lower cost
the government can choose to directly provide essential goods and services to its citizens at a highly subsidised rate or free of charge to ensure that everyone has access to these goods and services regardless of their income levels
the government will then finance the payment for these goods and services through taxation
benefits of direct provision
with direct intervention by the government, outcomes in terms of increasing production and consumption are more certain and can be achieved faster compared to subsidies which take time to work through the markets
having the government involved in the production of the good or service could increase its affordability to all, thus reducing the extent of inequity
if the production of an essential good or service was left entirely to the private firms who aim to profit-maximise, the higher prices charged might cause the lower income
earners to be left out of the market
limitations of direct provision
governments may also not have the incentive to improve on its production and quality of the service, which could lead to a fall in quality in the long run ⇒ even though everyone has access to the good, its quality is poor and unable to satisfy the needs of the population
governments may lack perfect information and may provide too much or too little of the goods or services → if the government provides too little of the good, the issue of inequity will persist as certain groups may still be excluded from accessing the good
unintended consequences of direct provision
can lead to productive inefficiency, where costs incurred are higher than necessary
absence of a profit motive by the government could also mean a lack of incentive to keep costs low
may be a sense of complacency, knowing that losses can
always be covered by taxpayers’ money
outsourcing production to a private firm could lead to productive
inefficiency or dynamic inefficiency during the contractual period due to the lack of contestability and competitiondynamic efficiency: achieved when there is an improvement in the quality or range of products, and/or when improved production processes reduce the costs of production over time
productive and dynamic efficiency may not be achieved as private firms may become complacent after winning the
contract since they would be given exclusive rights to produce the good or service for a specified time frame ⇒ could lead to higher costs than necessary being incurred,
and/or deterioration in the quality of service provided or good produced ⇒ fall in consumer welfare
may generate further deadweight loss
electoral pressures may lead to the government to provide beyond the social optimal quantity of the good or service, resulting in an over-allocation of resources to the market
policies to reduce price of essential goods and services
besides subsidies and price ceiling, governments can also implement other policies with the objective of lowering the demand or increasing the supply of essential goods and services, in order to reduce their price ⇒ makes essential good or service more affordable to lower-income households, thus reducing the extent of inequity
policies: demand-side and supply-side
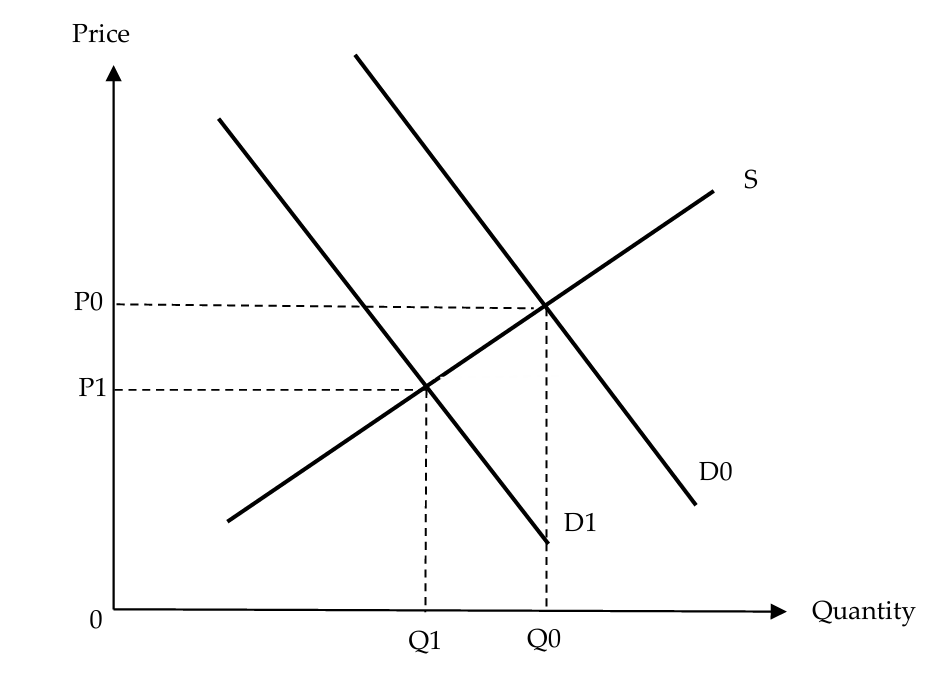
demand-side policies to reduce demand
governments may carry out public education campaigns
to persuade consumers to reduce their demand for a good or servicee.g. the National Environment Agency (NEA) in Singapore regularly carries out campaigns to call upon consumers to reduce food waste
if preferences can be effectively influenced by these campaigns, there would be a fall in demand, causing a leftward shift in the demand curve from D0 to D1, and the equilibrium price will decrease from P0 to P1
limitations of demand-side policies
campaigns take time
success of campaigns depends on the receptiveness of the people to change their consumption and buying habits
mindset shifts take time and demand may not be reduced by the intended extent
e.g. it may not be easy to change the mindset of the need to appear generous when giving treats or buffets, and food wastage may still occur
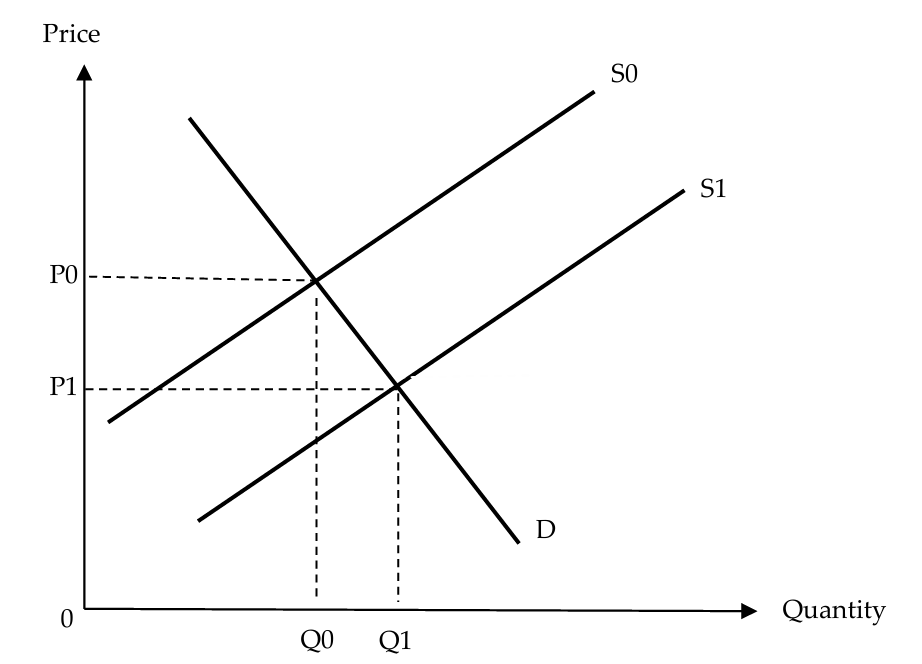
supply-side policies to increase supply
the government could incentivise research and development (R&D) among firms, to raise the productivity of producing it
e.g. Singapore government provides various grants to incentivise research and development (R&D) to increase productivity of growing food. This could improve the disease resistance of crops and fish and make them more resilient to climate change. Domestic food supply would increase, causing equilibrium price of food to fall. The policy of ‘growing local’ and ‘grow more with less’ by the Singapore Food Agency (SFA) allows producers to tap on the $63 million Agriculture Productivity Fund (APF), which co-funds high tech, productive farming systems.
the increase in productivity would lead to lower unit costs of production, thus increasing the supply → shifts the supply curve to the right from S0 to S1, decreasing the equilibrium price from P0 to P1
limitations of supply-side policies
outcomes of the policy of research and development takes a long time to take effect
e.g. the SFA aims to achieve locally producing 20% of fibre consumed and 30% of protein consumed by 2035 ⇒ the long time period for this policy to take full effect
outcomes may be uncertain due to reasons such as mistakes in the research process
unintended consequences of supply-side policies
when the government encourages R&D among firms in a market, firms may end up competing to be the first one to complete the research successfully so that their research may be protected by a patent
can lead to a duplication of efforts and thus result in allocative inefficiency as resources could have been used more productively in other areas