ECO2013 hammock FSU final
 Call Kai
 Learn
Learn Practice Test
 Spaced Repetition
 Match
Match Flashcards
 Knowt Play
1/185

There's no tags or description
Looks like no tags are added yet.
Name | Mastery | Learn | Test | Matching | Spaced | Call with Kai | Chat |
|---|
No analytics yet
Send a link to your students to track their progress
186 Terms
Scarcity
lack of something
choice
Scarcity implies ________
Opportunity cost
the value of the best thing we give up to get something
Rational self interest
assume people are rationally self interested; false but useful
Positive economics
describes the way the world actually is
Normative economics
describes the way the world should be
Production possibilities frontier
graph that shows the combination of output that the economy can possibly reduce given the available factors of production and the available production technology; demonstrate that tradeoffs exist and resources can be used efficiently or wastefully
Simple trade
voluntary exchange creates value
The law of demand
- As price increases, the quantity demand decreases
- As price decreases, the quantity demand increases
Marginal value (your willingness to pay for an additional good)
What does the height of the demand curve represent?
Diminishing marginal utility
decreasing satisfaction / usefulness as additional units of a product are acquired
Consumer surplus
the difference between the highest price a consumer is willing to pay for a good/service and the actual price the consumer pays (related to demand curve)
Changes in:
- the time of year
- quality of product
- income
- prices of subsidies
- complements, expectations, or tastes/preferences
What shifts the demand curve?
to the right
How does the demand curve shift when theres an increase in demand
to the left
How does the demand curve shift when theres a decrease in demand?
Law of supply
- As price increases, the quantity supplied increases
- As price decreases, the quantity supplied decreases
the marginal cost of producing an additional unit of output
What does the height of the supply curve represent
Producer surplus
difference between how much a producer is paid to produce one unit of output (the price) and the marginal cost of producing that unit of output
- input costs
- changes in technology
- expectations
- taxes/regulations
- firms enter/exit the market
- natural disasters
What shifts the supply curve?
Total surplus
consumer surplus + producer surplus
Equilibrium
where supply and demand meet
Efficiency
there is no reallocation of goods/resources that has benefits greater than costs; theres no way to make total surplus bigger
- total surplus is maximized
- marginal benefits = marginal costs
- every unit produced has a benefit to consumers that is greater than or equal to the cost of production
If equilibrium is efficient:
either price OR quantity will be indeterminate (but not both)
If supply and demand both shift, then:
supply/demand is inelastic (steep curve)
If the quantity demanded does not change much when the price changes, then:
supply/demand is elastic (more flat curve)
If quantity demanded does not change a lot when price changes, then:
Price controls
legal restrictions on what prices can be charged; generally inefficient
Price ceiling
legal maximum price
Non binding price ceiling
Price ceiling above equilibrium
Price floor
legal minimum price
Nonbinding price floor
price floor below equilibrium
shortage
Binding price ceiling causes a:
surplus
Binding price floor causes a:
Deadweight loss
the burden of a tax
the relative elasticities of supply and demand, NOT its legal assignment
What determines the burden of a tax
Monopoly
lack of competition; one seller
Public goods
a good that is non rivalrous and non excludable (ex: light from a lighthouse)
Negative externalities
the costs of an action of a third party (ex: pollution)
Tragedy of the commons
the overuse of common, publicly owned resources (ex: fisheries in international waters)
Tragedy of the anticommons
there are too many people with property rights to stop people from using a resource (ex: Russian shopping malls)
Public interest view of government
democratic governments effectively combine the preferences of the people and implement beneficial policy
Public choice view of government
democratic governments are made up of people who make decisions based on their self interest and incentives created by the political system
Rational ignorance
voters tend to be poorly informed; information is costly and benefits are low
Rational abstention
voters rationally abstain from voting
The special interest effect
when a concentrated group gets the policy it wants at the cost of a larger group (ex: NRA vs. gun control advocates)
A _____ is an amount.
A _____ is a change in an amount.
stock; flow
Gross domestic product (GDP)
- the market value of all final goods and services produced within a country (or other geographic area) within a year (or other time period)
- a measure of total production
Market value (GDP)
price X quantity of final goods
Final goods
goods that have reached the last buyers as a new good
Intermediate goods
goods in the production process, have not reached the consumer yet
Circular flow diagram
The expenditure approach
Y=C+I+G+NX
- y= GDP
- c= consumption spending
- i= investment spending
- g= government spending
- nx= exports - imports
The income approach
add up all spending
Per capita GDP
GDP divided by the total population
Problems with GDP
- non market production
- black/grey market production
- leisure/job quality are not counted
- product quality and new goods not reflected in GDP
- GDP can rise after bad events
- does not illustrate income inequality, poverty, etc
Price level
the overall level of prices of goods and services in an economy; measured with GDP deflator and consumer price index (CPI)
Inflation
an increase in the price level
Deflation
decrease in the price level
Disinflation
decrease in the rate of inflation
Nominal GDP
GDP calculated using prices and quantities from the current year
Real GDP
GDP calculated using prices from a base year and quantity from some other year of interest
GDP deflator
(Nominal GDP/Real GDP)x100
Consumer price index (CPI)
tracks the cost of an ordinary consumers typical prices over time
Inflation rate
[(New CPI-Old CPI)/(Old CPI)] x 100%
New price using CPI/GDP deflator
Old price X (new CPI/old CPI)
Old price using CPI/GDP deflator
New price X (old CPI/new CPI)
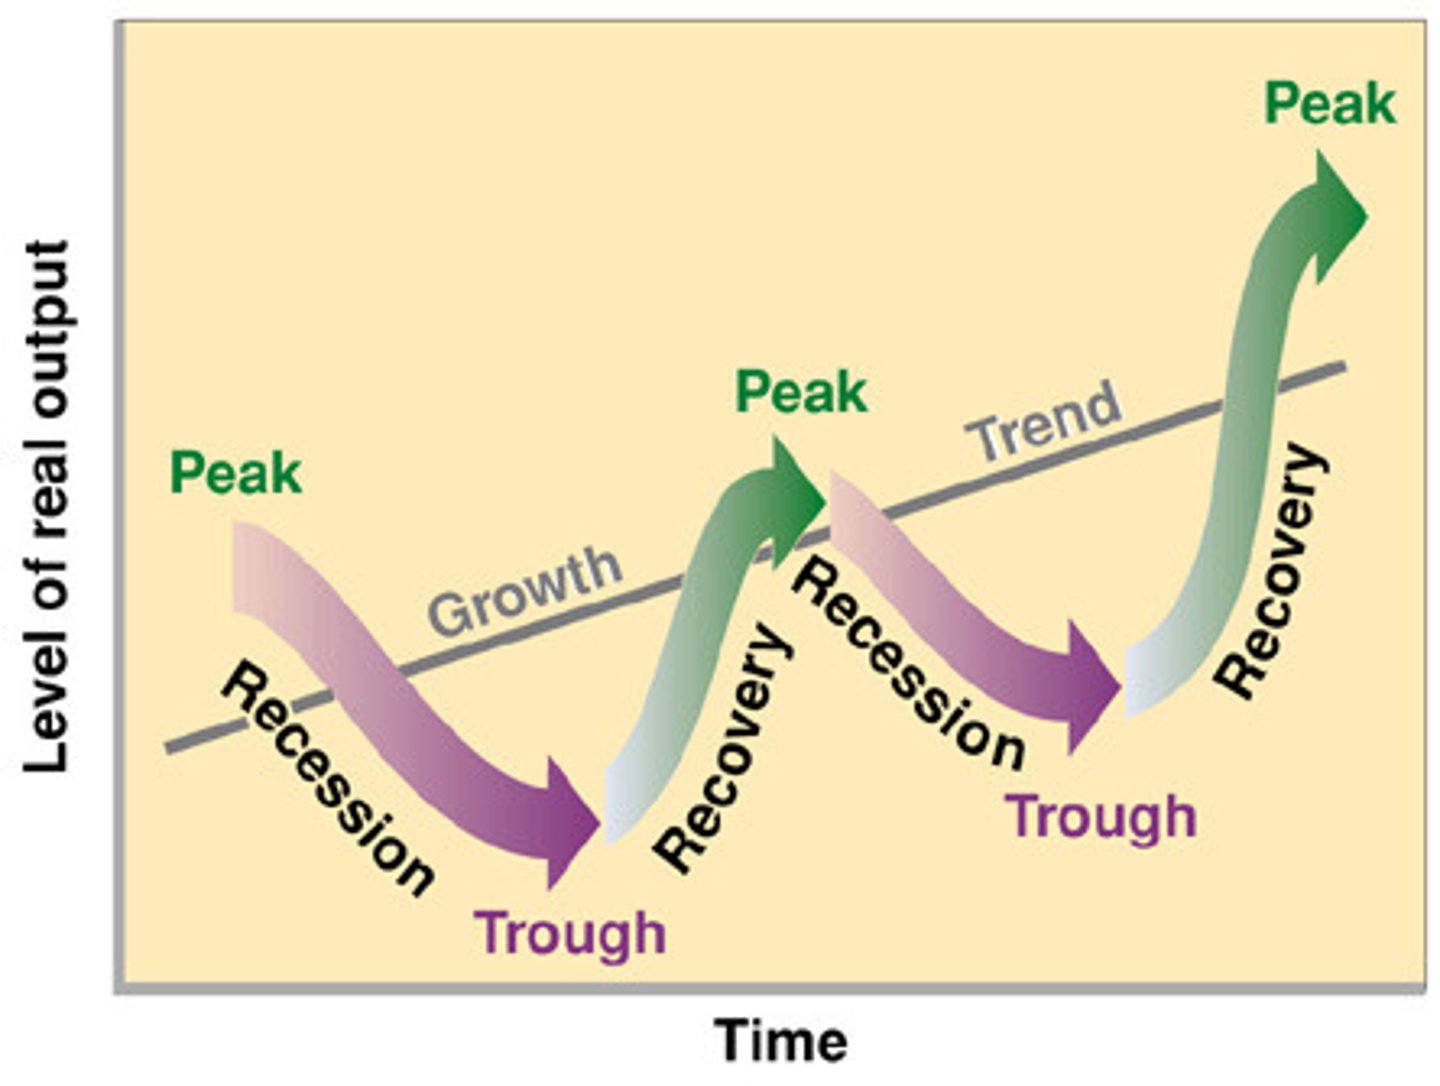
The business cycle
Categories for thinking about labor/employment
Total US population > adult non-institutionalized civilian population (16+) > labor force > employed and unemployed
Labor force participation rate
(Labor force/ adult non-institutionalized civilian population) X 100%
Unemployment rate
(unemployed/labor force) X 100%
Employed
- worked for pay
worked without pay in a family business
- have a job but are temporarily laid off
Unemployed
- don't have a job and are available for work
- have looked for a job in the last 4 weeks
Problems with the unemployment rate
- discouraged workers (wants jobs but have given up on looking)
- underemployment (people working part time but don't want to work full time)
Frictional unemployment
ordinary, temporary, caused by equal quitting or firing
Structural unemployment
- caused by mismatch between worker skills and employer needs
- there is some market structure that prevents hiring
Seasonal unemployment
caused by regular seasonal events
Cyclical unemployment
caused by recessions
Natural rate of unemployment
- when the economy is growing normally
- frictional + structural
Full employment
The rate of employment when employment is at its natural rate
Potential GDP
the value of outputs when we are at full employment
Menu costs
cost of changing prices (associated with anticipated inflation)
Shoe leather costs
people living with high inflation suffer the inconvenience of frequent bank trips (associated with anticipated inflation)
Unanticipated inflation causes
- people use resources to shield themselves from inflation
- relative prices to shift unpredictably bc higher inflation is more variable
Fancy circular flow model
- only includes money
- only leaking out (taxes, saving, imports)
- money coming in (government spending, business borrowing, exports)
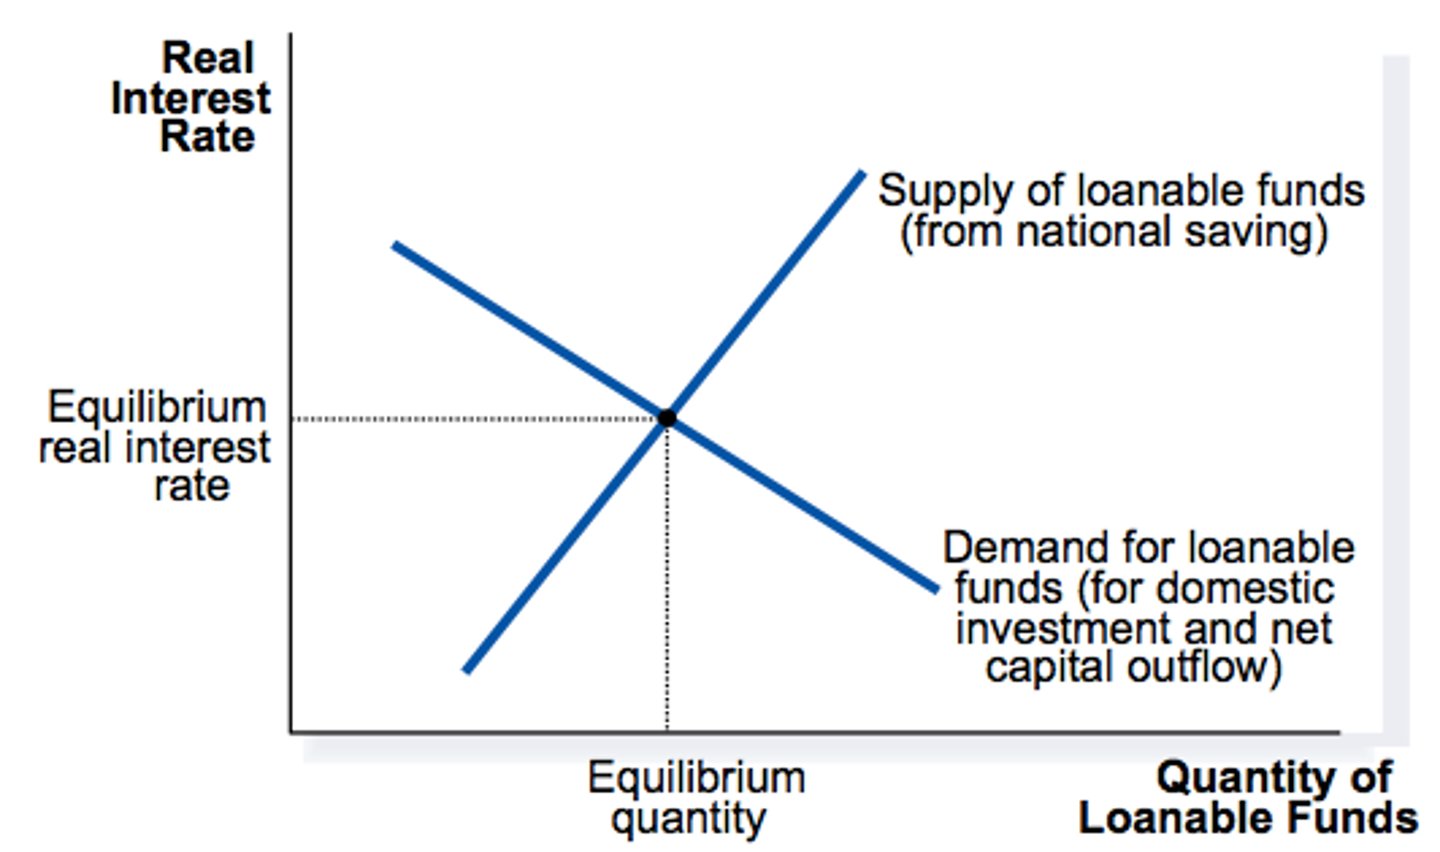
Loanable funds market
Fishers equation definition
determines the relationship between nominal and real interest rates under the effect of inflation
Fishers equation
i=r+pi
I= nominal interest rate
r= real interest rate
pi= inflation premium
Foreign exchange market
market in which people trade currencies
2 ways money leaves the US
- imports
- capital outflowing (buying foreign assets)
2 ways money enters the US
- exports
- capital inflow (foreigners buy our assets)
Appreciation
when the dollar can buy more foreign currency
Depreciation
when the dollar buys less foreign currency
Exports - imports =
Capital Outflow - Capital Inflow
Trade deficit
- amount by which the cost of a countries imports exceeds the value of its exports
- imports > exports
- 0 > net exports
Trade surplus
- amount by which the value of a countries exports exceeds the cost of its imports
- exports > imports
- net exports > 0
3 uses of money
- medium of exchange
- unit of account
- store of value
Liquidity
how close something is to spendable money
Fiat money
paper money, usually issued by governments
Commodity money
money based on a traded commodity with intrinsic value (ex: gold, silver)
Money supply
how much money is there